Energy and Power Engineering
Vol. 5 No. 2 (2013) , Article ID: 29410 , 6 pages DOI:10.4236/epe.2013.52012
Automated Multi-Meter Method for the Scaling of Low AC Voltage from 200 mV to 2 mV
Electrical Quantities Laboratory, National Institute for Standards (NIS), Giza, Egypt
Email: halaabdelmegeed@yahoo.com
Received January 4, 2013; revised February 10, 2013; accepted February 20, 2013
Keywords: Micropotentiometer; Low ac Voltage Calibration; ac-dc Difference; Digital Multimeter; Step Down Procedure
ABSTRACT
A set of seven single junction thermal converter Micropotentiometers (μPots) has been constructed at the National Institute for Standards (NIS), Egypt. This set has been built to cover the low ac voltage ranges from 2 mV to 200 mV at frequencies from 40 Hz up to 20 kHz. The construction of the μPots set has been presented and an adopted calibration method has been performed as well. This method has been performed by means of a step-down procedure using a Digital Multi-Meter (DMM). The scaling procedures have been carried out in sequential steps starting from the calibration of the 200 mV-μpot by using DMM that is accurately calibrated at its 200 mV ac voltage range down to 2 mV-µPot. Furthermore, a new automatic calibration system has been established to achieve the scaling procedures. This system has been specially designed using Laboratory Virtual Instrument Engineering Workbench (LabVIEW) software to overcome the deficiencies of manual methods. The automatic calibration has been investigated of all mPots at different frequencies. The ac-dc differences for the µPots and their uncertainty evaluation from 2 mV to 200 mV at different frequencies from 40 Hz to 20 kHz have been determined.
1. Introduction
The electrical SI units are defined and realized as dc electrical quantities. ac electrical quantities can’t be directly determined in terms of SI units, so ac quantities have been determined in terms of the dc quantities. In order to determine ac quantities, it is necessary to transfer ac to dc [1]. The ac-dc transfer standards are maintained by the National Metrology Institutes (NMIs) to provide a primary link between the active ac and dc quantities [2]. Device testing and characterization for today’s very small and power efficient electronics requires sourcing low ac voltage levels (microvolt and millivolt) which demands the use of precision low ac voltage sources. A device fulfilling this need is called radio frequency µPot. The μ pot is a very precision standard for determining a low output ac voltage over a wide range of frequencies. It is the most stable, accurate, and reliable standard in the millivolt (mV) region as low impedance sources of known radio frequency (RF) voltage [3]. Therefore, the traceability of ac voltage in the mV ranges has been established using μPots which can be used as ac reference transfer standards [4]. The µPot is used as thermal transfer devices that contain thermal converter (TC) and output radial resistor to obtain accurate AC voltages in the mV ranges. The thermal converters are widely used in the field of ac-dc transfer standards [2]. There are different types of µPots according to the thermal converter used in its construction such as single junction thermal converter (SJTC) and thin film multi junction thermal converter (MJTC). Although MJTC in planar technique are used for voltages down to 100 mV [5] and integrated µPots are designed in the same thin film technology [4], SJTC are widely used for ac-dc transfer because of their simple construction and ready availability [6]. This paper is dealing with a construction as well as an adopted automatic calibration method of a precise SJTC µPots set. This µPots set is implemented as a part of upgrading the ac capabilities at NIS. It has been entirely built to cover the ranges from 2 mV to 200 mV at frequencies from 40 Hz and up to 20 kHz. Nerveless, in metrological and Industrial laboratories, programmable instruments are now widely employed and increasingly included in measurement systems, because they can perform automatically the time consuming operations required in the calibration activity. Actually, the available commercial software is not suitable for the metrological laboratories which work at high level of accuracy and precision. Accordingly, there is an effective request for software able to calibrate such instruments [7]. For this reason, a special programmable calibration system has been built using the labVIEW. To achieve low ac voltage traceability at NIS, an automated DMM method has been performed for the scaling of ac voltage from 200 mV to 2 mV by means of a step-down procedure. The calibration results of all the µPots and their associated uncertainties are fully investigated as well.
2. Micropotentiometer Construction
The constructed set consists of seven SJTC µPots having output ac voltage with nominal values of 2, 5, 10, 20, 50, 100 and 200 mV. Each µPot consists of an ultra high frequency (UHF) single junction thermalelement in series with a low inductance radial output resistor. In the SJTC energy dissipated by an ac current flowing through a heater resistor, raising its temperature above the ambient is compared to the energy dissipated by a dc current flowing through the same heater. The increase in the temperature of the heater at ac and dc, proportional to the dissipated energy, is measured using a thermocouple. A relative difference between the response of the converter to ac and dc inputs, called ac-dc transfer difference, is determined from these two measurements. The SJTC which is used in each of our adopted μPots construction has been tested at NIS. It shows innovative design and produces extremely low transfer error [8]. The main technical specifications of it are 5 mA nominal heater current and 90 Ω heater resistance [9].
The second main component in constructing each μPot is the radial resistor. It consists of ten equal resistors ensured an optimum frequency response, as it is a special design annular shape film resistor. These ten resistors are connected in parallel and placed between the center pin and the outer flange of an N-type female connector. It is securely soldered into the output N-type coaxial connector and screwed into the μPot case [10].
Figure 1 shows μPot schematic diagram. The radial resistors with nominal values of 0.4 Ω to 40 Ω are combined with the 5 mA SJTC in order to obtain output voltage ranges from 2 mV up to 200 mV respectively. The output voltage is nominally the product of the heater current and the resistance of the radial resistor.
Table 1 indicates the nominal values of equivalent radial resistors for each μPot output voltage.
3. Step-Down Scaling of Measurements
Step-down scaling of the ac voltages from 200 mV to 2 mV is shown in Figure 2. The process starts with the NIS ac-dc transfer primary standard which is 300 mV Thin Film MJTC calibrated at PTB, Germany. This standard is used to calibrate a Fluke 8508 A Digital multimeter (DMM) at range 200 mV. The calibrated DMM is then used to calibrate the 200 mV-µPot. The μ pots are
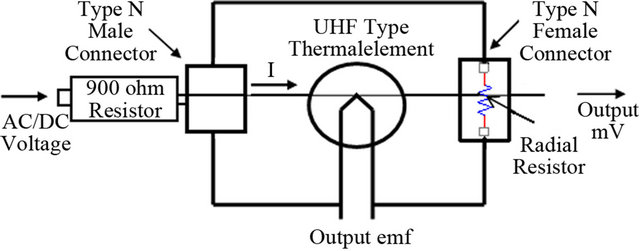
Figure 1. Schematic diagram of the μPot.
Table 1. Radial resistor nominal value for each μPot range.
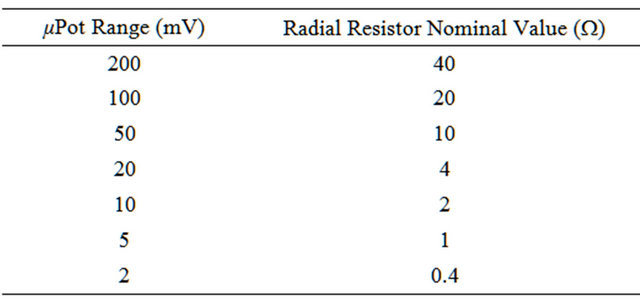
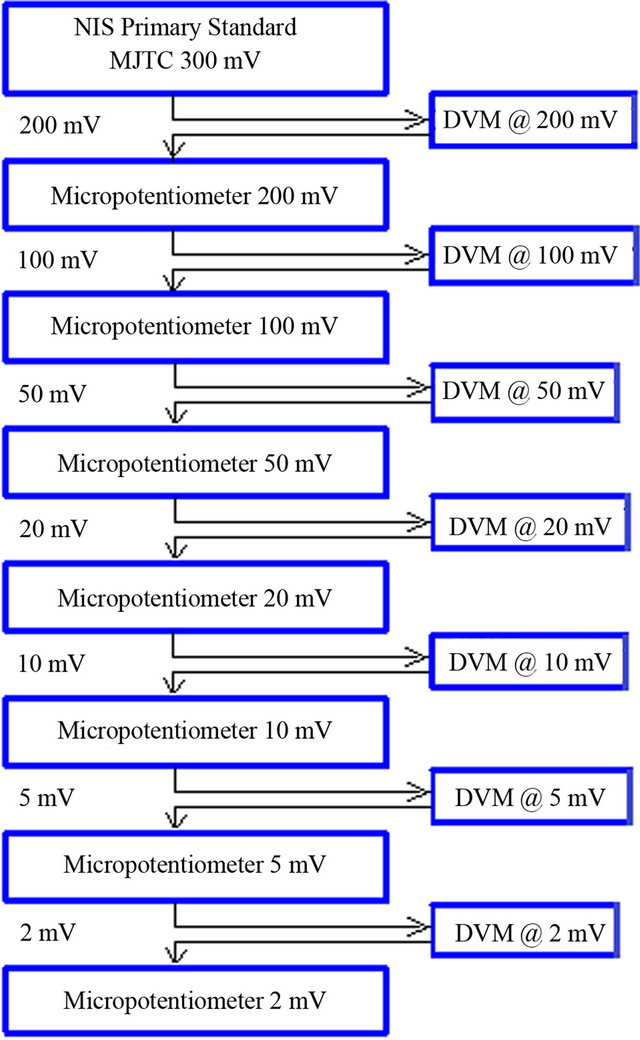
Figure 2. Step-down scaling of the ac voltages.
used from full to half of their nominal voltages with almost the same ac-dc differences [11]. Consequently, the calibrated 200 mV-µPot is used to calibrate the DMM at 100 mV level. The DMM is then used to calibrate the 100 mV-µPot. The process is continued until all the lower ranges of the µPots down to 2 mV are calibrated.
4. Procedures
The scaling procedures have been automatically performed through implementation of an automated calibration system. This automated system accelerates the measurement procedures, eliminates the operator’s errors, and significantly improves the measurement process. Moreover, it allows statistical proceeding of the results in rather short time. General Purpose Interface Bus (GPIB) card and cables are used to communicate and control the automated system hardware with its software. The new software LabVIEW program is designed to perform the following: control the calibrator output, perform measurement procedures with the specified times for the warming-up and the steady-state of the TE, collect measurements data indicated by DMM, and generate data sheets at the end for saving the measurement results. The scaling procedures from 200 mV to 2 mV are carried out in several sequential steps.
The first step of the scaling procedures is the calibration of Fluke 8508 A DMM at a 200 mV ac voltage range using the 300 mV thin-film MJTC. This automated calibration system consists of a highly accurate programmable calibrator (Fluke 5720 A) to precisely source both alternating and direct voltages, highly sensitive, 8.5 digits, DMM (Fluke 8508 A), 8.5 digits, DMM (HP 3458 A) to measure the μPot output emfs and 300 mV thin film MJTC.
The multifunction calibrator, which is the alternating and the direct voltages source is connected using a teeconnector to both the thin film MJTC and the Fluke 8508 A DMM which is recently calibrated at its dc voltage mode. Figure 3 illustrates the Set-up of this calibration step.
Alternating voltage in addition to direct voltage in positive and negative polarities is sequentially applied in the sequence (dc+, dc−, ac) from the calibrator. Enough time is allowed during the automated program adjustment to warm up the TE. Also, it is important to wait a frequently predicted time before recording the DMM output electro motive forces (emfs) indicated by HP 3458 A DMM until the MJTC reached its steady-state. This sequence is repeated for ten times. The corresponding MJTC output emfs readings have been automatically recorded from the 3458 A DMM in specially prepared
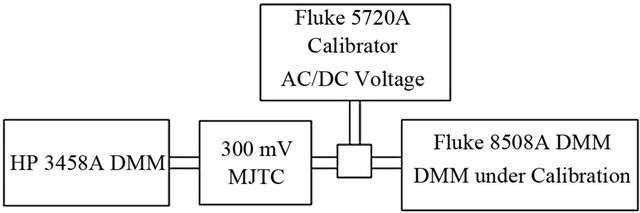
Figure 3. Circuit set-up for DMM calibration at 200 mV by MJTC.
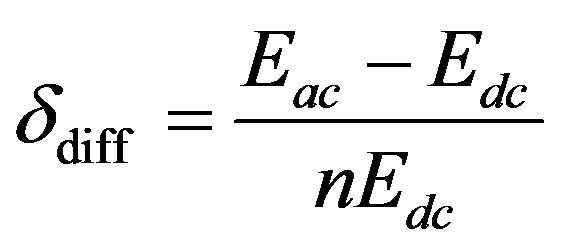
excel sheet. Furthermore, the 8508 A DMM readings are recorded in the same excel sheet. The difference between the MJTC responses due to the applied dc average voltage and the ac voltage (δdiff) is calculated using the equation:
 (1)
(1)
WhereEac: output emf for the AC input voltage.
Edc: mean emfs values for forward (dc+) and reverse (dc−) voltages.
n: response characteristic varies between 1.6 and 2, depending on the amplitude of the input signal [12]. The factor n is automatically determined for the MJTC and all the µPots individually. The procedures of the factor n determination and the automatic program are fully described in [13].
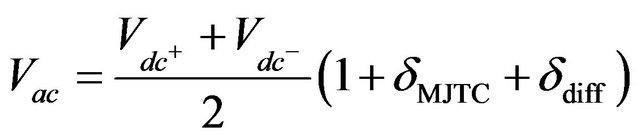
The accurate applied value at 200 mV ac voltage, Vac, is calculated from:
 (2)
(2)
WhereδMJTC: ac-dc transfer difference of the MJTC.
δdiff: difference between the MJTC responses due to the dc average voltage and the ac voltage.
Vdc+, Vdc−: the accurate applied dc voltages 8508 A DMM readings and the accurate applied value obtained from equation 2 is then used to obtain the 8508 A DMM correction at its 200 mV ac voltage in order to get its accurate calibrated value.
The second step is the calibration of the 200 mV-μPot using the Fluke 8508 A DMM which is calibrated from the previous step in its 200 mV ac voltage range. This automated calibration system consists of 5720 A calibrator, 8508 A DMM, 3458 A DMM to measure the μPot output emfs, 200 mV-μPot and 900 W resistor.
In order to perform this step, the calibrator is connected to the 200 mV-μPot through a 900 Ω series resistor to pass 5 mA to the μPot. 3458 A DMM is connected to measure the μPot output emf readings. Figure 4 demonstrates the set-up of the second calibration step. The μPot output emfs and the 8508 A DMM readings are recorded in another excel sheet.
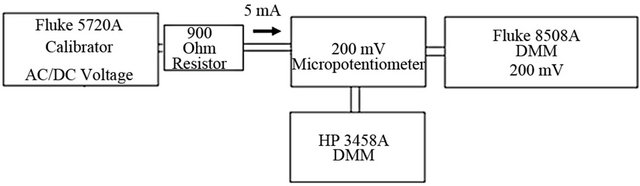
Figure 4. Circuit set-up for 200 mV-μPot calibration.
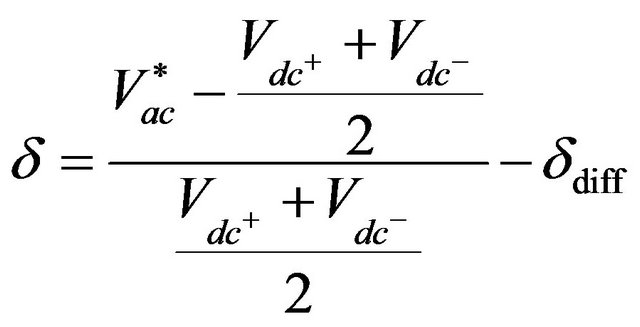
The 200 mV-μPot ac-dc difference (δ) is determined from the following equation:
 (3)
(3)
Where,
 : calibrated 200 mV ac voltage of 8508 A DMM after putting its correction obtained from the previous step.
Vdc+, Vdc: calibrated 200 mV dc voltages of 8508 A DMM.
δdiff: difference between the 200 mV-μPot responses.
In the third step, the calibrated 200 mV-μPot is used to calibrate the Fluke 8508 A DMM at its ac 100 mV range. The automated calibration system consists of 5720 A calibrator, 8508 A DMM, 3458 A DMM, 200 mV-μPot and 900 W resistor. As shown in Figure 5, the calibrator is connected to the 200 mV-μPot through a 900 Ω series resistor to pass 2.5 mA to the μPot to obtain 100 mV output voltage. The μPot output e.m.fs and the 8508 A DMM readings are recorded in excel sheet.
The 8508 A DMM correction at its 100 mV ac voltage is then obtained from the 8508 A DMM recorded readings and from:
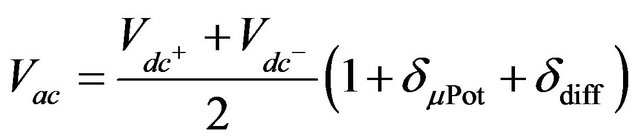 (4)
(4)
WhereVac: the accurate calibrated ac voltage applied on the 8508 A DMM.
δµPot: ac-dc transfer difference of the 200 mV-μPot.
The calibrated 100 mV range DMM is used for the calibration of 100 mV-μPot. Then, the calibrated 100 mV- μPot is used to calibrate the DMM at 50 mV range and so on till reaching to the calibration of the 2 mV-μPot by using the automated calibration systems described in the second and third steps.
5. Experimental Results
The values of the n-factor test of our µPot set are within (1.76 to 1.91). These values of n-factor are very acceptable [5]. The ac-dc differences for the µPots from 2 mV to 200 mV at different frequencies from 40 Hz to 20 kHz are also determined. All components of the combined standard uncertainty (Type A and Type B) are taken into consideration. The combined uncertainty equals to the Root Sum Square (RSS), of all the uncertainty contributions. The expanded uncertainty is obtained by multiplying the combined uncertainty by coverage factor “k”. The value of coverage factor gives the confidence level for the expanded uncertainty. Most commonly, we scale the overall uncertainty by using the coverage factor k = 2, to give a level of confidence of approximately 95% according to the ISO GUM [14,15]. Table 2 illustrates the uncertainty budget for the 100 mV-μPot at 40 Hz as an example.
Generally, the considered expanded uncertainty is a round approximation of the calculated uncertainty. For example, the considered expanded uncertainty for the 100 mV-μPot at 40 Hz becomes 30 ppm. Table 3 shows the ac-dc differences (δ) and the expanded uncertainties (Uexp) of all the calibrated μPots from 200 mV to 2 mV at the specified frequencies 40 Hz, 1 kHz, 10 kHz and 20 kHz.
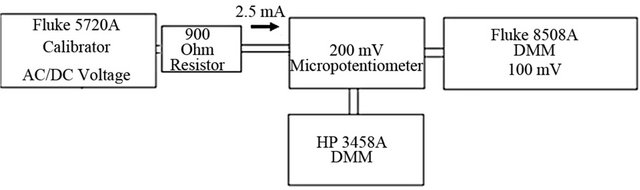
Figure 5. Circuit set-up for DMM calibration at 100 mV by the calibrated 200 mV-μPot.
Table 2. Uncertainty budget for 100 mV μPot at 40 Hz.
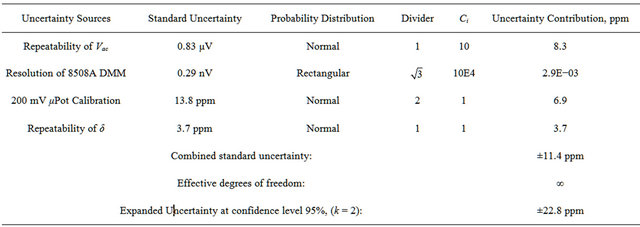
Table 3. δ and expanded uncertainties of all μPot at different frequencies.
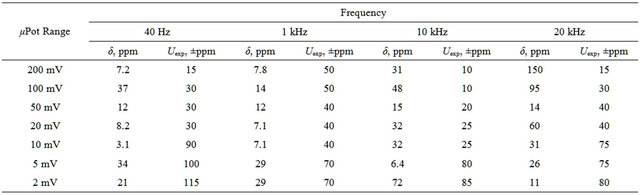
It is found that the ac-dc differences of the 200 mV to 2 mV µPots are from 3.1 ppm to 150 ppm at the different frequencies from 40 Hz up to 20 kHz. µPots can be used to generate ac voltage signals in millivolt ranges with ac-dc differences ranging from 20 ppm to 1000 ppm [3]. Thus, it is shown that ac-dc differences of our µPots are acceptable where their values are much smaller than the higher limit of the admitted ac-dc differences.
6. Conclusion
The established single junction thermal converter µPots set provides a reference standard ac voltage source in the millivolt region. It offers stable output ac voltage ranges from 2 mV up to 200 mV at frequencies range from 40 Hz to 20 kHz. To achieve low ac voltage traceability at NIS, an automated DMM method has been performed for the scaling of ac voltage from 200 mV to 2 mV by means of a step-down procedure. The LabVIEW program which is constructed to automatically calibrate the µPots significantly improves the measurement process as well as it allows statistical proceeding of the results in rather short time. The ac-dc differences for the µPots at different frequencies from 40 Hz to 20 kHz are determined. It is clearly shown that the ac-dc differences of the µPots are within reasonable and acceptable ranges. The expanded uncertainty of the calibrated µPots is also evaluated with 95 % confidence level at these frequencies.
7. Acknowledgements
The authors thank Dr. Umberto Pogliano for his guidance and advices.
REFERENCES
- E. S. Williams, “The Practical Uses of AC-DC Transfer Instruments,” NBS Technical Note 1166, October 1982.
- P. S. Filipski and R. L. Rinfret, “An Automated AC-DC Transfer Calibration System,” IEEE Transactions on Instrumentation and Measurement, Vol. 49, No. 2, 2000, pp. 279-284. doi:10.1109/19.843064
- I. Budovsky, “A Micropotentiometer-Based System for Low-Voltage Calibration of Alternating Voltage Measurement Standards,” IEEE Transactions on Instrumentation and Measurement, Vol. 46, No. 2, 1997, pp. 356-360. doi:10.1109/19.571855
- H. Dintners, M. Klonz, A. Lerm, F. Vblklein and T. Weimann, “AC-DC-mV-Transfer with Highly Sensitive ThinFilm Multijunction Thermal Converters,” IEEE Transactions on Instrumentation and Measurement, Vol. IM-42, 1993, pp. 612-614.
- D. X. Huang, J. Harber and D. McAdoo, “Measurement Assurance of RF-DC Differences of Thermal Standards,” NCSL Workshop & Symposium, 1996.
- J. R. Kinard, D. X. Huang and D. B. Novotny, “Integrated Thin-Film Micropotentiometers,” IEEE Transactions on Instrumentation and Measurement, Vol. IM-44, No. 2, 1995, pp. 374-376. doi:10.1109/19.377856
- U. Pogliano, G. C. Bosco and M. Lanzillotti, “Generalized Automatic System for AC/DC Transfer, AC Voltage, and AC Current Measurements,” IEEE Transactions on Instrumentation and Measurement, Vol. 55, No. 5, 2006, pp. 1747-1751. doi:10.1109/TIM.2006.880958
- A. Haroutunian, M. Halawa, A. Hassan, R. Attyia and H. A. Mageed “Comparison of the Technical Performance for Different Designs of Single Junction Thermal Converters,” Cpem-2008 Boulder, USA, 2008.
- http://www.besttech.com /techinfo2.htm
- H. A. Mageed, A. F. Zobaa, A. Ghitas, M. H. A. Raouf, M. Sabry, A. H. A. Rahman and M. M. A. Aziz, “Electrical Performance Study of a Large Area Multicrystalline Silicon Solar Cell Using a Current Shunt and a µPotentiometer,” Engineering Transactions, 2010, pp. 263-269.
- P. S. Filipski and M. Boecker, “AC-DC Current Shunts and System for Extended Current and Frequency Ranges,” IMTC Instrumentation and Measurement Technology Conference, Ottawa, 17-19 May 2005.
- T. E. Lipe, “Operation and Reference Manual for the NIST Automated AC-DC Calibration Systems and Software,” National Institute of Standards and Technology Special Publication 250-61, National Institute of Standards and Technology, 2004.
- H. A. Mageed, A. F. Zobaa, M. H. A. Raouf, A. H. A. Rahman and M. M. A. Aziz, “An Improved Design of a Fully Automated Multiple Output µPotentiometer,” Energy and Power Engineering Transactions, May 2010, pp. 103-110.
- Uncertainty Guide to the Expression of Uncertainty in Measurement, JCGM 100, 2008
- http://www.ukas.com/library/Technical-Information/Pubs-Technical-Articles/Pubs-List/M3003.pdf