Atmospheric and Climate Sciences
Vol.3 No.1(2013), Article ID:27536,5 pages DOI:10.4236/acs.2013.31001
Contrasting Vertical Structure of Recent Arctic Warming in Different Data Sets
1Nansen Environmental and Remote Sensing Centre, G. C. Rieber Climate Institute, Bergen, Norway
2International Arctic Research Centre, University of Alaska, Fairbanks, USA
3A. M. Obukhov Institute for Atmospheric Physics, Moscow, Russia
4Centre for Climate Dynamics (SKD), Bergen, Norway
Email: *igore@nersc.no
Received September 27, 2012; revised October 29, 2012; accepted November 6, 2012
Keywords: Arctic Warming; Data Set Intercomparison; Atmospheric Vertical Structure
ABSTRACT
Arctic region is experiencing strong warming and related changes in the state of sea ice, permafrost, tundra, marine environment and terrestrial ecosystems. These changes are found in any climatological data set comprising the Arctic region. This study compares the temperature trends in several surface, satellite and reanalysis data sets. We demonstrate large differences in the 1979-2002 temperature trends. Data sets disagree on the magnitude of the trends as well as on their seasonal, zonal and vertical pattern. It was found that the surface temperature trends are stronger than the trends in the tropospheric temperature for each latitude band north of 50˚N for each month except for the months during the ice-melting season. These results emphasize that the conclusions of climate studies drawn on the basis of a single data set analysis should be treated with caution as they may be affected by the artificial biases in data.
1. Introduction
The largest magnitude of the recent temperature change has been observed in the northern midand high-latitudes [1]. As the Arctic warms, the physical and ecological surface environment of the region experiences unprecedented transition from snow and ice to tundra and open water [2]. There are however considerable differences in the temperature trends between regions and latitudes [3] that are likely interconnected. Moreover, during this transition, the temperature change in the near surface atmospheric layer can be not indicative to the large-scale climate processes as melting snow and ice would keep the temperature close to freezing point [4].
The very complicated geographical and seasonal patterns of the temperature change found in available data sets are often inconsistent. These inconsistencies cause extensive debates and hinder the attribution of the climate change mechanisms. This study addresses the inconsistency of the vertical structure of the temperature trends. The problem is important as it is directly related to distinction between the anthropogenic and natural climate variability and as it is significant to understanding of the scale of physical feedbacks (e.g. the ice-albedo and ice-clouds feedbacks) in high latitudes. The related studies contrast the surface temperature (ST) trends [5] and the tropospheric temperature (TT) trends [6]. The surface feedbacks should result at the first place in the amplification of the ST trends, as the shallow atmospheric boundary layer would confine the temperature change in the lowermost atmospheric layers [7,8]. On the contrary, the large-scale circulation feedbacks and teleconnections [9-12] could result in different TT trends, unrelated to ST trends, at least during the climate transition period, as the lowermost atmospheric layers capped by a strong temperature inversion and to large degree decoupled from the tropospheric variability [4].
Because both the surface and teleconnection feedbacks are acting independently to some extent in the earth’s climate system, climate datasets may provide a differing view on their relative importance and scale of impact, thus introducing different biases. Those biases have been a matter of debate following Graversen et al. [6] report on stronger TT trends in ERA-40 reanalysis data between 1979 and 2002. This finding was questioned in a series of successive publications, which used other reanalysis products and radiosonde data [13-15]. In particular, Alexeev et al. [15] showed that the trend patterns strongly depend on the data set used and that there is little agreement between reanalysis, observation and blended data sets on the extent, geographical distribution and seasonality of the warming. The present study extends the results in [15] to address the vertical and zonally integrated temperature trend differences in several data sets.
2. Data
This study is based on temperature data taken from: IABP/POLES [16], CRU [17], NANSEN [18], and HadAT [19] datasets; and from ERA-40 reanalysis [20]. In order to make the data sets comparable, the analysis was limited to 1979-2002 with some data sets covering even shorter time interval.
IABP/POLES is the International Arctic Buoy Program (IABP) data [16]. The Polar Science Center of the Applied Physics Laboratory, University of Washington, in collaboration with the participants of IABP, has maintained a network of drifting Argos buoys in the Arctic Ocean since 1979. The data are collected at the World Data Center for Glaciology at the National Snow and Ice Data Center (NSIDC). The dataset used in this study covers 1979-2002. The monthly mean data interpolated on 1 by 1 degree regular grid were obtained from http:// iabp.apl.washington.edu/data_satemp.html.
CRU is the Climate Research Unit data (CRUTEM2v) collected at the University of East Anglia, UK [17]. A land station temperature database was used to produce a gridded dataset of temperature anomalies of 5 by 5 degree resolution. It is available from http://www.cru.uea. ac.uk/cru/data/. It is worse noting that in high latitudes the CRU data set significantly deviates from the GISS data set [1].
NANSEN is a new 2.5 by 2.5 degree resolution gridded dataset created in the Nansen Environmental and Remote Sensing Center, Bergen, Norway and Nansen International Environmental and Remote Sensing Center, Sankt-Peterburg, Russia [18]. The data cover the region north of 40˚N for the period 1900-2000, using all available surface air temperature data including land meteorological stations, IABP, Russian and western drifting stations, and Russian patrol ships. The in situ data were optimally interpolated using a standard objective analysis method. The main advantage of NANSEN dataset is its enhanced spatial coverage, especially in the central Arctic north of 70˚N. This is an important feature making it indispensable for the present analysis. Data is available from http://www.niersc.spb.ru/NANSEN_SAT_gridded.rar.
HadAT is globally gridded radiosonde temperature anomalies prepared by the Hadley Centre [19]. HadAT consists of temperature anomaly time series on 9 standard reporting pressure levels (850 hPa to 30 hPa). In our analysis, we used monthly and zonally averaged product. Detail description of the product and the data are available from http://hadobs.metoffice.com/hadat/.
3. Results
In this study, temperature trends (TT and ST) were computed using the least-square fit method for the linear function (realised in MATLAB subroutine “detrend”) over the entire period 1979-2002 (or from the period available in the data set). At a first step, monthly temperature anomalies in each greed node were calculated, which gave total of 284 months of data. At a second step, the data were averaged within latitude bands. Finally, the obtained (year, band, month) dataset was de-trended for every month of the year thus providing a 2-D array (band, month) of temperature trends.
Figure 1 shows the ST trends in four data sets: the reanalysis ERA-40 set, the objectively interpolated and combined NANSEN set, the gridded CRU set and the in situ IABP/POLES set. The CRU and ERA-40 trends are similar in the lowand mid-latitudes but differ in highlatitudes. The trend in the NANSEN data generally follows the CRU trend but the trend of in situ IABP/POLES data follows ERA-40.
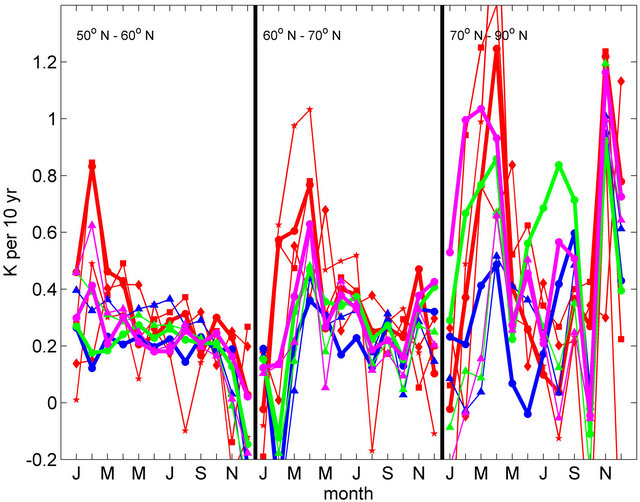
Figure 2 shows the same trends for each month in three different latitude zones. The largest inconsistency between the trends is found during the winter season (November through March). However, ST trends are always larger than TT trends with the exception of the summer season over the Arctic Ocean (70˚N to the pole) where melting sea ice and cold water surface do not allow the surface temperature to rise. This is more clearly shown in Figure 2(b) where ST trends are compared with TT trends at the level of the maximum of the Arctic radiative inversion (700 mb). ST trends do not increase monotonically toward the pole as it has been suggested by the hypothesis of the polar amplification [5]. At the same time, TT trends do reveal such a feature, which is consistent with the idea of the poleward propagation of the signal from the low latitudes [9].
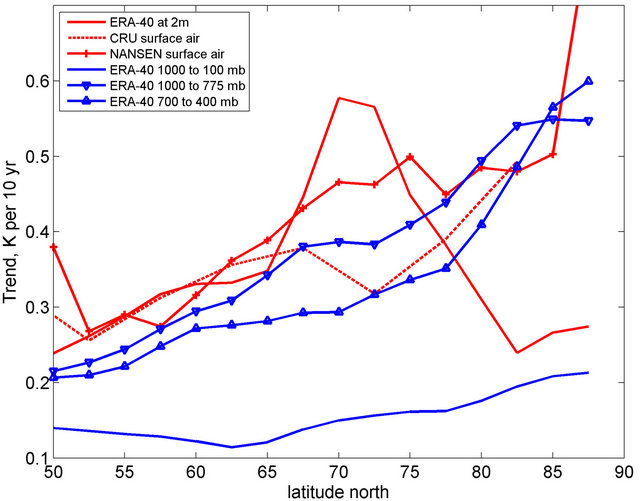
Figure 3 compares vertically integrated temperature trends with ST trends in the summer and winter seasons.
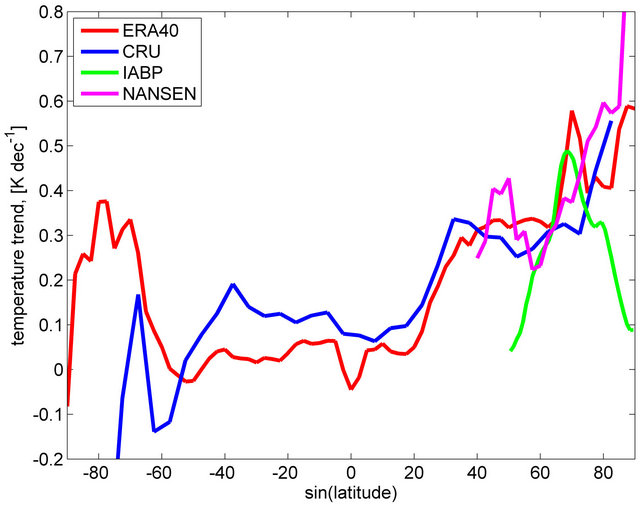
Figure 1. Zonally averaged surface temperature trends in different data bases over the period 1979 and 2002.
 (a)
(a)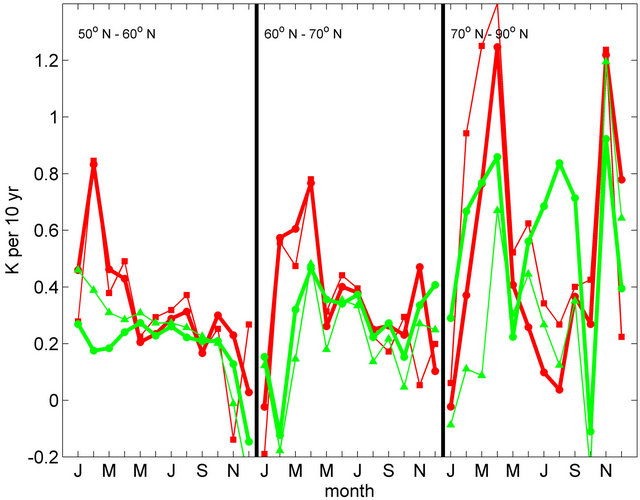 (b)
(b)
Figure 2. (a) Surface (2 m—red) and tropospheric (850 mb— magenta; 700 mb—green; 500 mb—blue) temperature trends between 1979 and 2002, calculated for every month for three latitude bands 50˚N - 60˚N, 60˚N - 70˚N, and 70˚N to the North Pole. Circles and bold lines are ERA-40 reanalysis data. Thin lines and symbols are: squares—NANSEN surface temperature data; diamonds—CRU surface temperature data; pentagrams—IABP/POLES surface temperature data; triangles—HadAT troposphere temperature data; (b) Surface (2 m—red) and tropospheric (700 mb— green) temperature trends between 1979 and 2002 calculated for every month for three latitude bands 50˚N - 60˚N, 60˚N - 70˚N, and 70˚N to the North Pole. Symbols are: bold lines and circles—ERA-40 reanalysis data; thin lines and squares—NANSEN surface temperature data; thin lines and triangles—HadAT troposphere temperature data.
It shows that the trends are largest at the surface, while they become smaller if a thicker air layer is considered. The only exception is the ERA-40 ST trend. Problems with ERA-40 climatology, particularly its warm bias in the Arctic, are known and documented. Simmons et al. [21] compared monthly-mean anomalies in surface air temperature from the ERA-40 and NCEP/NCAR re-
 (a)
(a) (b)
(b)
Figure 3. Temperature trends at the surface (ST) (red) and in the tropospheric columns (blue) between 1979 and 2002, calculated for the summer (a) and winter (b) seasons.
analyses with corresponding values from the CRU dataset. Least-square linear trends were found to be significantly lower for both reanalysis projects, but ERA-40 trends are within 10% of CRU for the whole northern hemisphere when computed from 1979 onwards. There is however a warm model bias prevalent at middle and high latitudes and a cold bias at low latitudes. The ECMWF model (basis for the ERA-40 reanalysis) as such is producing a cold bias in midand high-troposphere in datasparse regions. This feature may amplify the troposphere temperature trends in ERA-40 as the Arctic data coverage and instrumentation used has varied between 1979 and 2002. Trends and variability in ERA-40 throughout the planetary boundary layer (1000 mb to 850 mb layer) are generally similar to those at the surface from the late 1970s onwards.
Alexeev et al. [15] showed that the data sets are inconsistent in their estimation of the regional temperature, temperature anomalies and trends. Here, we show that those inconsistencies persist even when the data are averaged over large latitude zones and over a thick troposphere layers. The analysis revealed that the inter-dataset inconsistencies increase significantly over the Arctic Ocean as compared to the more southern latitudes. The inconsistencies increase drastically in the winter season. It could be related to the amplification of the temperature trends by the planetary boundary layer feedback [7,8], which confines the surface feedbacks [5] in a thin and therefore responsive surface layer of the atmosphere.
4. Conclusion
The results of this study revealed that magnitude, geographical and seasonal patterns of the surface and tropospheric temperature trends are considerably different in the considered climate data sets. All considered data sets indicated the strong warming in the Arctic region. However, there is less agreement on the spatial and seasonal pattern of the warming. Data sets disagree on the magnitude, seasonality, geographical localization and the vertical structure of the temperature trends. It was found that the surface temperature trends are stronger than the trends in the tropospheric temperature for each latitude band north of 50˚N for each month except for the months during the ice-melting season. Therefore conclusions drawn on the basis of a single data set analysis should be treated with caution as they may be affected by the set-specific biases in data. Nevertheless, the majority of data sets support the statement that the ST trends are larger in the high latitudes and simultaneously they also have also larger seasonal and geographical variability. It lowers the signal-to-noise ratio and impedes the formal detection and attribution analysis as presented in [22]. The surface melting processes over the Arctic Ocean considerably modify the ST trends making them insignificant as compared with the TT trends.
5. Acknowledgements
The research leading to these results has received funding from: the Norwegian Research Council projects PBLfeedback 191516/V30, RECON 200610/S30; NERSCIAP 196174/S30, NERSC-IARC 196178/S30, and CLIMARC; the EU Research Council Advanced Grant, FP7- IDEAS, 227915. VA was supported by the Japan Agency for Marine Science and Technology (JAMSTEC) and NSF ARC 0909525.
REFERENCES
- J. Hansen, R. Ruedy, M. Sato and K. Lo, “Global Surface Temperature Change,” Reviews of Geophysics, Vol. 48, No. 4, 2010. doi:10.1029/2010RG000345
- M. C. Serreze and R. G. Barry, “Processes and Impacts of Arctic Amplification: A Research Synthesis,” Global Planetary Change, Vol. 77, No. 1-2, 2011, pp. 85-96. doi:10.1016/j.gloplacha.2011.03.004
- S. Outten and I. Esau, “A Link between Arctic Sea Ice and Recent Cooling Trends over Eurasia,” Climatic Change, Vol. 110, No. 3-4, 2011, pp. 1069-1075. doi:10.1007/s10584-011-0334-z
- M. Tjernstroem, “The Summer Arctic Boundary Layer during the Arctic Ocean Experiment 2001 (AOE-2001),” Boundary-Layer Meteorology, Vol. 117, No. 1, 2005, pp. 5-36. doi:10.1007/s10546-004-5641-8
- M. C. Serreze, A. P. Barrett, J. C. Stroeve, D. N. Kindig and M. M. Holland, “The Emergence of Surface-Based Arctic Amplification,” The Cryosphere, Vol. 3, 2009, pp. 11-19. doi:10.5194/tc-3-11-2009
- R. G. Graversen, T. Mauritsen, M. Tjernström, E. Källén and G. Svensson, “Vertical Structure of Recent Arctic Warming,” Nature, Vol. 451, No. 7174, 2008, pp. 53-56. doi:10.1038/nature06502
- I. Esau and S. Zilitinkevich, “On the Role of the Planetary Boundary Layer Depth in the Climate System,” Advances in Science and Research, Vol. 4, 2010, pp. 63-69. doi:10.5194/asr-4-63-2010
- I. Esau, R. Davy and S. Outten, “Complementary Explanation of Temperature Response in the Lower Atmosphere,” Environmental Research Letters, Vol. 7, No. 4, 2012, p. 044026.
- V. A Alexeev, P. L. Langen and J. R. Bates, “Polar Amplification of Surface Warming on an Aquaplanet in Ghost Forcing Experiments without Sea Ice Feedbacks,” Climate Dynamics, Vol. 24, No. 7-8, 2005, pp. 655-666. doi:10.1007/s00382-005-0018-3
- J. E. Overland, R. G. Graversen and M. Honda, “Hot Arctic-Cold Continents: Global Impacts of Arctic Change,” EOS Transactions, Vol. 91, No. 41, 2011, p. 373. doi:10.1029/2010EO410007
- J. Ukita, M. Honda, H. Nakamura, Y. Tachibana, D. J. Cavarieli, C. L. Parkinson, H. Koide and K. Yamamoto, “Northern Hemisphere Sea Ice Variability: Lag and Propagation,” Tellus, Vol. 59, No. 2, 2007, pp. 261-272.
- S. Sorokina and I. Esau, “Meridional Energy Flux in the Arctic Obtained From Data of the Igra Radio Sounding Archive,” Izvestiya, Atmospheric and Oceanic Physics, Vol. 47, No. 5, 2011, pp. 572-583. doi:10.1134/S0001433811050112
- C. M. Bitz and Q. Fu, “Arctic Warming Aloft Is Data Set Dependent,” Nature, Vol. 455, No. 7210, 2008, pp. E3- E4.
- J. A. Screen and I. Simmonds, “The Central Role of Diminishing Sea Ice in Recent Arctic Temperature Amplification,” Nature, Vol. 464, No. 7293, 2010, pp. 1334- 1337. doi:10.1038/nature09051
- V. A. Alexeev, I. Esau, I. Polyakov, S. J. Byam and S. Sorokina, “Vertical Structure of Recent Arctic Warming from Observed Data and Reanalysis Products,” Climatic Change, Vol. 111, No. 2, 2012, pp. 215-239. doi:10.1007/s10584-011-0192-8
- I. Rigor, R. Colony and S. Martin, “Variations in Surface Air Temperature Observations in the Arctic, 1979-1997,” Journal of Climate, Vol. 13, No. 5, 2000, pp. 896-914. doi:10.1175/1520-0442(2000)013<0896:VISATO>2.0.CO;2
- P. D. Jones and A. Moberg, “Hemispheric and LargeScale Surface Air Temperature Variations: An Extensive Revision and an Update to 2001,” Journal of Climate, Vol. 16, No. 2, pp. 206-223.
- S. Kuzmina, O. M. Johannessen, B. Bengtsson, O. G. Aniskina and L. P. Bobylev, “High Northern Latitude Surface Air Temperature: Comparison of Existing Data and Creation of a New Gridded Dataset 1900-2000,” Tellus A, Vol. 60, No. 1, 2008, pp. 113-130.
- P. W. Thorne, D. E. Parker, S. F. B. Tett, P. D. Jones, M. McCarthy, H. Coleman and P. Brohan, “Revisiting Radiosonde Upper Air Temperatures from 1958 to 2002,” Journal of Geophysical Research, Vol. 110, No. D18, 2004. doi:10.1029/2004JD005753
- S. M. Uppala, et al., “The ERA-40 Re-Analysis,” Quarterly Journal of the Royal Meteorological Society, Vol. 131, No. 612, 2005, pp. 2961-3012. doi:10.1256/qj.04.176
- A. J. Simmons, et al., “Comparison of Trends and Variability in CRU, ERA-40 and NCEP/NCAR Analyses of Monthly-Mean Surface Air Temperature,” European Centre for Medium-Range Weather Forecasts, Reading, 2004.
- D. J. Karoly and Q. Wu, “Detection of Regional Surface Temperature Trends,” Journal of Climate, Vol. 18, No. 21, 2005, pp. 4337-4343. doi:10.1175/JCLI3565.1
NOTES
*Corresponding author.