International Journal of Astronomy and Astrophysics
Vol. 3 No. 3A (2013) , Article ID: 34804 , 9 pages DOI:10.4236/ijaa.2013.33A001
On the M-σ Relationship and SMBH Mass Estimates of Selected Nearby Galaxies
Astronomy and Space Sciences Department, Ege University, İzmir, Turkey
Email: alperates@mail.ege.edu.tr
Copyright © 2013 Alper K. Ateş et al. This is an open access article distributed under the Creative Commons Attribution License, which permits unrestricted use, distribution, and reproduction in any medium, provided the original work is properly cited.
Received March 11, 2013; revised April 13, 2013; accepted April 20, 2013
Keywords: Galaxies; Active Galaxies; AGN; SMBH; Stellar Velocity Dispersion; Bulge Velocity Dispersion
ABSTRACT
Super massive black holes are believed to influence galactic evolution and dynamics. A histogram of SMBH masses for different redshift regimes may reveal clues on how the SMBH evolve in time. A prominent method for SMBH mass estimation is based on the linear correlation between the bulge velocity dispersion and the SMBH mass. Known as M-σ relationship, this method is known to provide reasonable but not very accurate mass estimates due to considerable scatter in data. In order to increase the precision, we surveyed the literature and gathered SMBH and velocity dispersion data for low redshift (z < 0.02) spiral galaxies. We report the M-σ relationship for low redshift spiral galaxies as,
1. Introduction
In the past decades existence of extraordinary compact objects known as super massive black hole (SMBH) at the center of spiral and elliptical galaxies have been confirmed by numerous observational studies, most notably in the Milky Way (Ghez, et al., 1996 [1]) and in M31 (Dressler and Richstone, 1988 [2]; Kormendy, 1988 [3]). The existence of SMBH has first been suspected in active galaxies. In many cases these galaxies had star-like cores emitting up to 1046 ergs/sec (in the case of luminous Seyfert galaxies) and displaying significant optical variations pointing out fluctuations in generations of vast amounts of energy. The physics of the active galactic nuclei has been debated over the years; creative scenarios such as synchronized pulsations of supergiant stars have been suggested and fell short of explaining this complex structure. The most plausible explanation is a single “engine” residing at the host galaxy nucleus. The source of the energy for the engine is directly attributed to gravitational attraction of a central object with a mass in the order of 106 or more solar masses. The massive central objects have no optical signal and thus proven to be SMBH. Therefore the active galactic nuclei have been thought to be a SMBH surrounded by an accretion disk. The disk is enveloped by a dust torus. The materiel inside the torus displays a wide emission band due to high velocity of the gas surrounding the SMBH, which is known as a Broad Line Region (BLR). Outside the torus the gas orbits slowly, displaying a narrow emission line (NLR). Compression of the gas surrounding SMBH triggers energy generation in a way far more efficient than stars.
SMBH turns out to be ubiquitous. Many normal galaxies are observed to have a SMBH. It is presently believed that active or not all galaxies have SMBH at their centers. The difference between an active galaxy and a normal one is either the existence or lack of fuel; SMBH without accretion disks is believed to be dormant engines. So far estimated SMBH masses are in the range of 1.4 × 10⁶ (Greenhill et al., 1997 [4]) - 21 × 109 (McConnell et al., 2012 [5]) solar masses.
It is believed that the AGN and the host galaxy are closely related; entire system shares an evolutionary history (Rees, 1984 [6]; Dressler, 1989 [7]; Magorrian, et al. 1998 [8], Richstone, 1998 [9]). In the last decade, it has been observationally proven that several properties including the velocity dispersion in the bulge region are directly proportional with the SMBH mass (Ferrarese and Merritt, 2000 [10]; Gebhardt et al., 2000 [11]; Häring and Rix, 2004 [12]). Such an influence can only be attributed to a co-evolution of the SMBH and the host galaxy. In order to attain a better understanding of this phenomenon, SMBH masses from all kinds of galaxies need to be known.
In order to measure SMBH masses various methods based on dynamic studies of gas and stars have been developed. In particular, “reverberation mapping” and kinematic studies are known to provide the most reliable mass measurements (Kaspi et al., 2000 [13]). Studies using these methods enabled a census of well-known SMBH masses, which provide a base for further treatments of photometric and spectroscopic data. Various features such as line intensities, Doppler broadening of the prominent lines and line strength ratios of the host galaxies’ spectra have been investigated for potential and mostly successful empirical relationships towards accurate measurement of the SMBH masses.
2. M-σ Relation
2.1. M-σ Relation and Its Background
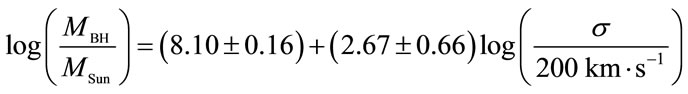
All galaxies display composite spectra that can be used in estimating SMBH masses. Since the galactic light is a conglomerate of stars and luminous gas, the spectrum will inescapably show all ingredients superimposed onto each other. Some of the spectral lines are more prominent and easily discernible. One of the most prominent features in a galactic spectrum is the [OIII] emission line (λ[OIII]rest= 5007 Å). The Doppler broadening of this line shows velocity dispersion (σ) in the bulge region of the galaxy (Gebhardt et al., 2000 [11]; Nelson, 2000 [14]; Boroson, 2003 [15]). A logarithmic plot of known SMBH masses versus σ reveals a linear relation known as an M-σ relationship (Ferrarese and Merritt 2000 [10]). According to the M-σ relationship the velocity of the gas in motion in the bulge region is directly proportional to the mass of the SMBH residing at the galactic center. As more mass measurements have became available the M-σ relationship is been refined since its first conception in 2000. Based on approximately 50 BH masses obtained from various galaxy types Gültekin et al. (2009) [16] reports the current best fit as
 (1)
(1)
This linear relationship permits estimation of the SMBH masses from a single epoch spectroscopic data.
2.2. Reliability of the M-σ Relation: Fine Tuning of the Relationship
Despite its promise, M-σ relation is not a first order mass estimation method. Two sources of uncertainty can play hampering roles in the precision of the mass measurements. Equation (1) expresses that there is considerable scatter in M-σ plot. It has also been reported that there are some potential sources of error in velocity measurements such as line asymmetries, blending or stellar temperature mismatch (Nelson et al., 2004) [17].
We also believe that the M-σ relation can be improved by taking different galaxy morphologies into account. For instance, the linear relation given in Equation (1) are obtained from a wide array of galaxies: 12 ellipticals, 2 probable ellipticals, 13 barred spirals, 12 spirals, an irregular and some cross-type galaxies. Every one of these types must have followed a different evolutionary track and end-up with varying morphologies. SMBH formation and growth histories must be linked to host galaxy properties including morphological differences and the host galaxy bulge type. In order to increase the precision of the mass estimation, new fits based on galaxy types would be worth enthused. For instance, in an investigation of the scatter in M-σ relationship by Gültekin (2009) [18], a slightly different fit for elliptical galaxies was observed. It is also important to take into account cosmic distance and time scales. Since redshift is a measure of distance and time, the M-σ relationship has to be obtained for objects that have close redshift values thus belonging to the same epoch.
To understand potential variations for the M-σ relationship for different morphologies, we took into account two different types: elliptic and spiral galaxies. We surveyed the literature for the known masses and bulge velocities by paying attention to the following points:
• All masses are measured by primary methods such as reverberation mapping, stellar dynamics and gas dynamics.
• All objects have low redshifts (z < 0.1); this ensures that they belong to the same epoch. It is also easy to identify morphological type and orientation of nearby galaxies.
• In order to prevent any potential errors in velocity measurements due to galaxy orientation, only edge-on spirals are selected.
• All targets are bright enough to be observed by moderate aperture telescopes and have discernible [OIII] lines.
• None of the targets is a merger.
Surveying the literature we found 10 spirals and 19 elliptical galaxies satisfying the above conditions. The data for the sample are tabulated in Tables 1 and 2.
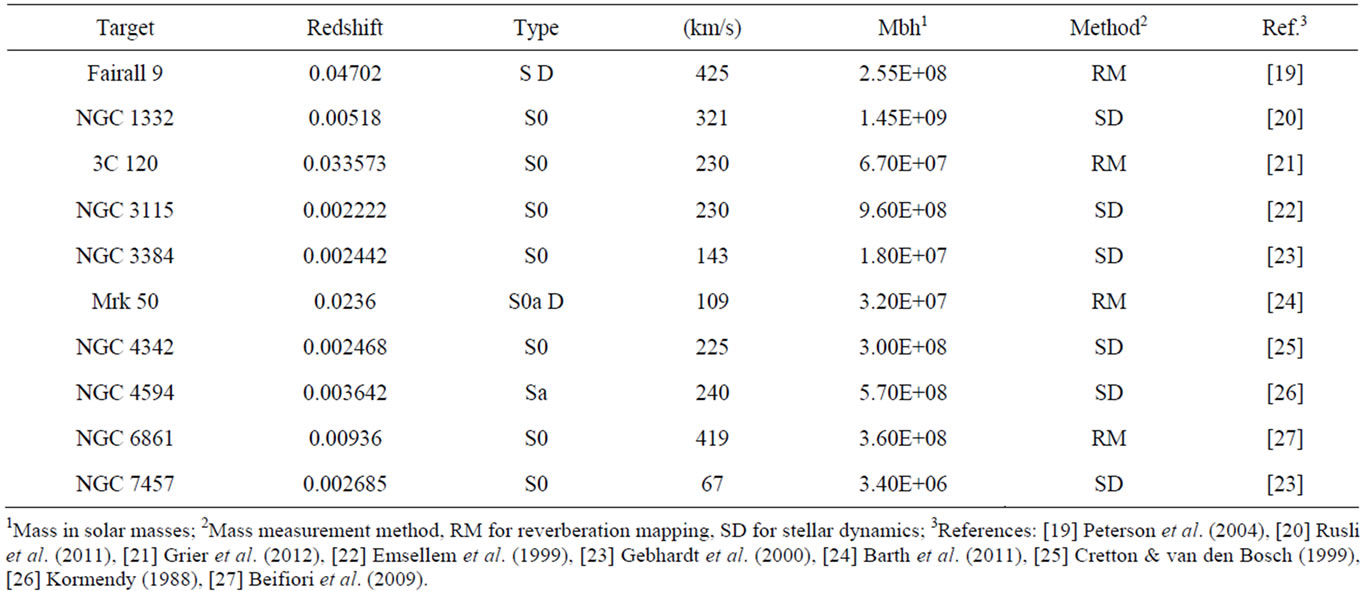
Table 1. Spiral galaxies.
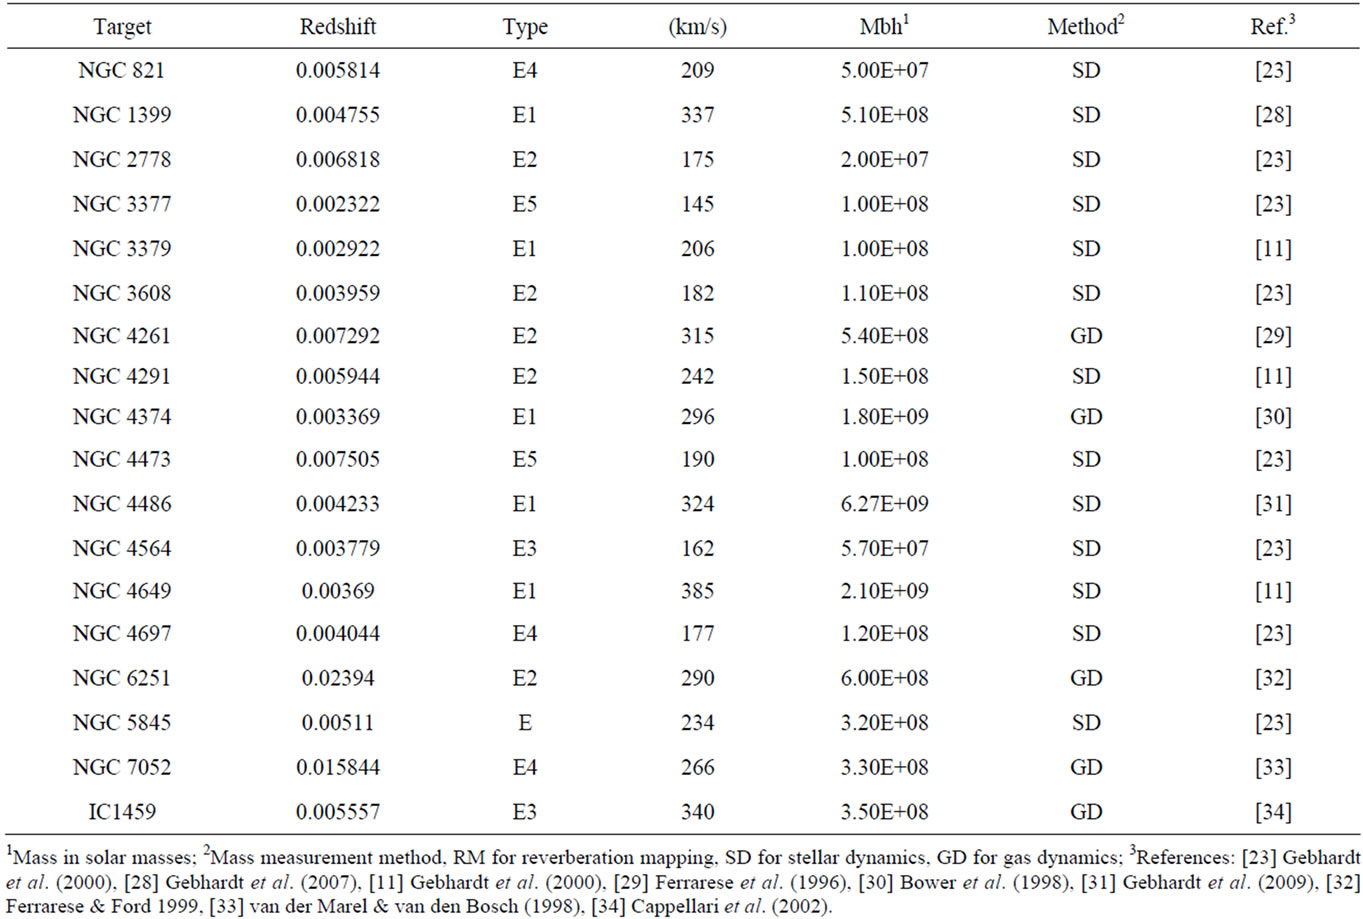
Table 2. Elliptical galaxies.
Based on above samples the linear least square fits are obtained using commercially available GraphPad Prism software. The fit for the spiral galaxies is
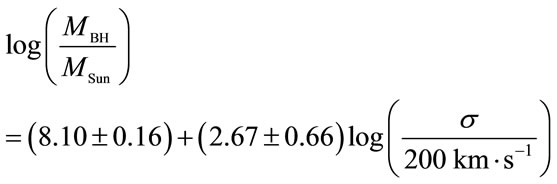 (2)
(2)
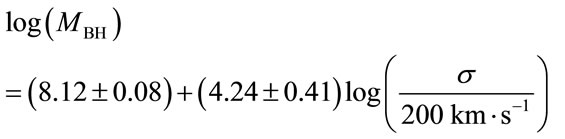
with a correlation coefficient of 0.826. Similarly for the elliptical galaxies,
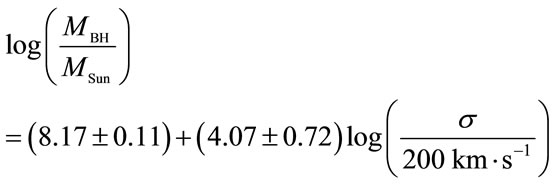 (3)
(3)
with a correlation coefficient of 0.819. When the above fits are compared with that of Gültekin (2009) [16], a considerable difference for the spiral galaxies is apparent.
As seen in Figure 1, M-σ relationship holds well for elliptical galaxies yet varies considerably for edge-on spirals. The difference is quite prominent for velocities below and above 200 km/s. Based on the above plot, the refined version of the M-σ relationship presented in Equation (2) proves more suitable for low redshift, edgeon spirals when compared to the commonly used M-σ relationship.
3. Spectral Study of Selected Galaxies
Employing Equation (2) we calculated SMBH masses for the selected edge-on spiral galaxies. The spectroscopic
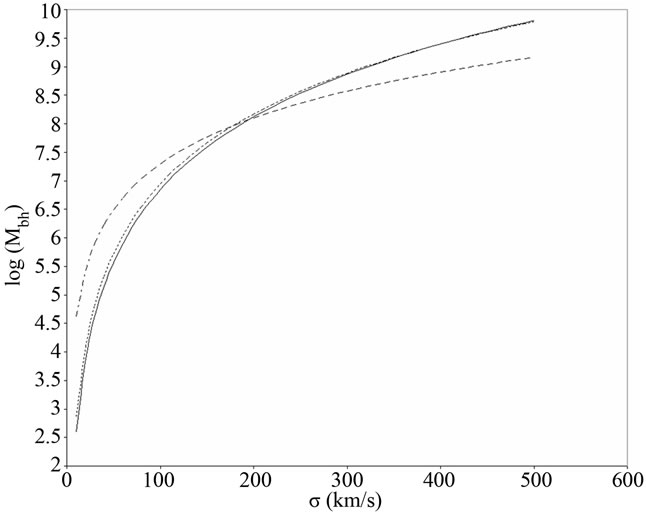
Figure 1. Mbh as function of velocities. The solid line is Mbh values based on commonly used M-σ relationship, Equation (1) (Gültekin 2009 [18]). The dashed line is for the edge-on spiral, dotted line for elliptical galaxies based on Equations (2) and (3).
data are obtained from two sources: TUBITAK National Observatory and the SLOAN Digital Survey.
3.1. TUG Targets
The targets observed at the TUBITAK National Observatory are selected primarily for their brightness (m > 16 in SLOAN u’g’r’i’z’, g’ or Johnson V bandpass) within a narrow redshift range (0.016 < z < 0.017). Galaxies in this distance have large angular size displaying their orientation and they are bright enough to be observed spectroscopically with our existing TUG RTT150-TFOSC setup. The properties of the targets are presented in Table 3.
3.2. TUG Observations
The observations are carried out at the TUBITAK National Observatory, Antalya, using a RTT150 (1.5 m Russian-Turkish Telescope) located at 36˚49'27" North, 30˚20'08" East at an altitude of 2500 meters. RTT150 operates at f/7.7 and for this project the TUG Faint Object Spectrograph Camera (TFOSC) was installed. TFOSC is a dual-purpose camera capable of doing photometry and spectroscopy simultaneously. We used grism #15 with a dispersion of 2.9 Å/pixel with liquid nitrogen cooled 2K (Fairchild 447) CCD array. Exposures up to three hours were given for three nights of 8th, 9th and 17th of July 2010.
The data reduction is done using MIRA image processing software. After reduction for atmospheric, optical and electronic effects, the spectra were compared with the spectra of Helium and Thorium-Argon lamps for precise wavelength calibration. Spectra of Vega taken same nights were used to double-check the line identifications. Once the line positions were assured, red-shifted strong [OIII] emission lines are located at the expected wavelengths. Data below 4100 Å and above 7000 Å are cropped out due to high amount of interference. The TFOSC has a near linear dispersion between this wavelength interval.
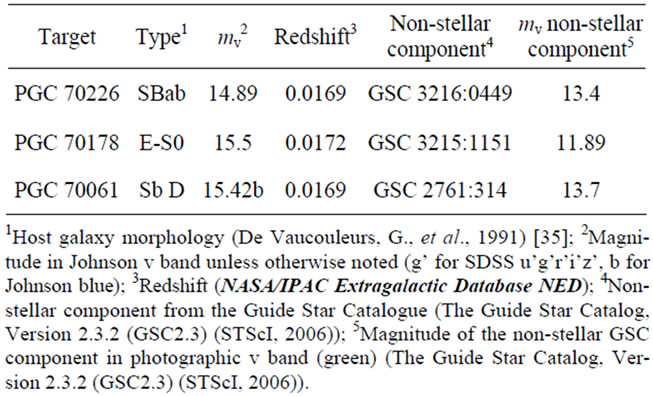
Table 3. TUG RTT150 targets and non-stellar components.
The spectra covering the Hβ and [OIII] lines are shown is Figure 2. The central wavelength and the FWHM of the [OIII] emission lines corrected for resolution and calculated by means of Gaussian fits are given in Table 4.
3.3. The SLOAN Data
The SLOAN Digital Survey has been mined for galaxies that satisfy TUG criteria. Out of over 500 000 galaxies in SLOAN Data Release 7 Best Object List database, 538 fell within above-mentioned brightness and distance parameters. The data are in the form of a list containing spectroscopic and photometric object identifications, position, redshift and brightness in u’g’r’i’z’ photometric system. Every target on the list is investigated using SDSS Object Explorer tool. By analyzing the survey images the list has been reduced to 111 targets, which are edge-on spiral galaxies and have no mergers. The fits files containing the spectra are downloaded to local computer for analysis. The 28 targets showed high signal level for [OIII] lines with no contamination.
4. SMBH Mass Estimates
As stated in part 1.2, the width of [OIII] line is indicative in estimating stellar bulge velocity dispersion. The bulge velocities and corresponding masses calculated by the refined M-σ relation given in Equation (2) are tabulated in Table 5 with their standard deviations.
5. Discussion
The M-σ relation is a secondary mass estimation method with some considerable scatter primarily due to indiscriminating data from all morphologies and redshift regimes. In order to address this issue, we selected low redshift galaxies and compared two main morphological types in the same epoch. As seen in Figure 1, fits for spiral and elliptical galaxies varied most probably due to diverse evolutionary experiences of two main morphological types. We believe that strong constraints allowed us to obtain a more precise mass estimation relation given in Equation (2) and used this refined relationship for mass estimation of SMBH residing in similar galaxies.
In Figure 3 we plot the measured masses against the stellar bulge velocity dispersion. The histogram of mass distribution is shown in Figure 4.
We find that the central SMBH residing in edge-on spiral galaxies within a narrow 0.016 < z < 0.017 redshift range has in the order of 107 solar masses. 59% of the targets have less than 5 × 10⁷ solar mass SMBH. 40% are somewhat heavier, between 5 × 10⁷ < MBH < 1 × 10⁸ solar masses. Only PGC70061 looks like an outlier with a mass of 2.36 × 10⁸ solar masses.
Since above assessments are based on Equation (2), a comparison with the commonly used M-σ relationship in Equation (1) will reveal whether our refinement caused dramatic differences. A plot for TUG and SDSS velocity measurements versus mass values calculated by Equations (1) and (2) are presented in Figure 5. Bulge velocities up to 1.6 × 10² kilometers per second yield 106 - 107 solar masses, which are close but different than values compiled by Gültekin (2009) [16]. The difference is more prominent at lower velocities (Figure 6).
When compared to values from Gültekin (2009) [16], the SMBH in 0.016 < z < 0.017 redshift regime appears to have almost no “heavy weight” (Mbh > 108 Msun) SMBH.
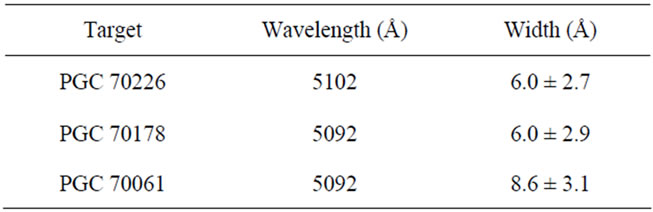
Table 4. The measured [OIII] line positions and FWHM values.
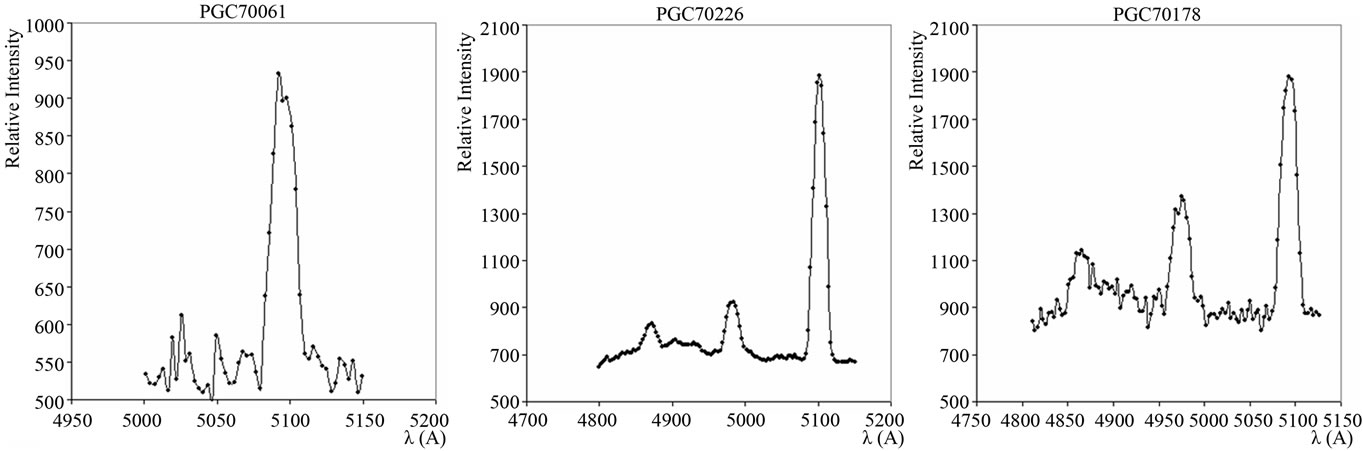
Figure 2. The spectra of the TUG sample between Hβ and [OIII] lines.
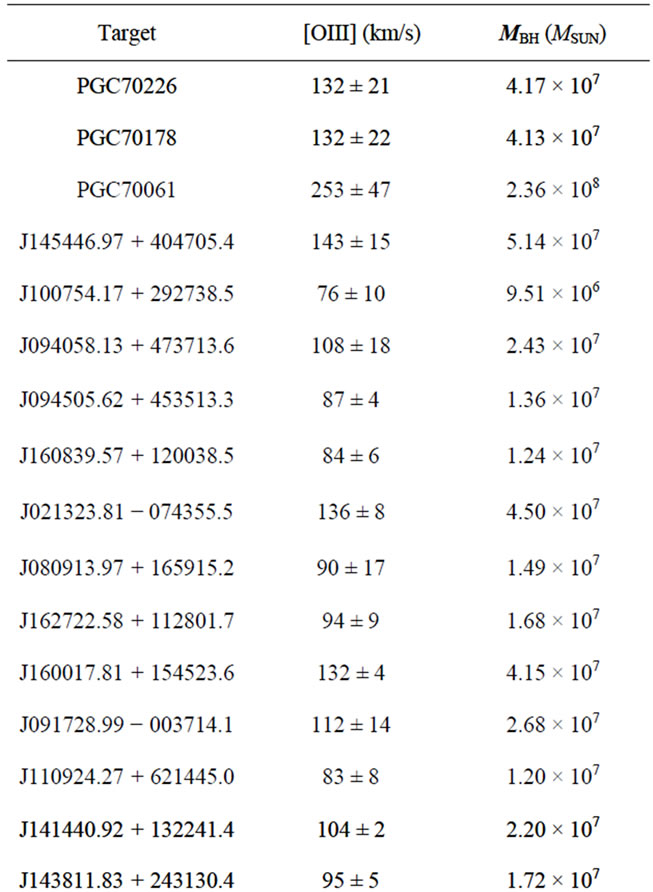
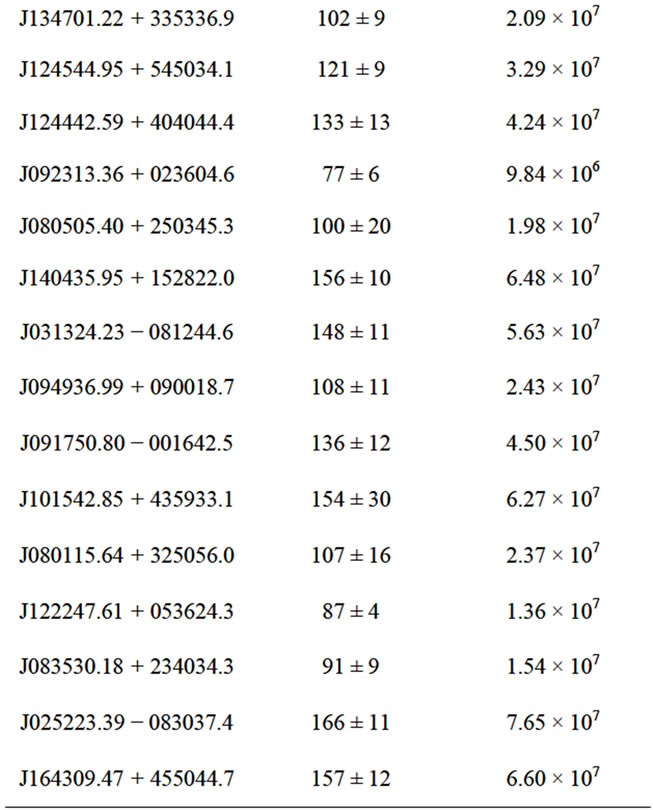
Table 5. Bulge velocity dispersion and estimated black hole masses. First three are TUG RTT150, rest are SDSS DR7 targets.
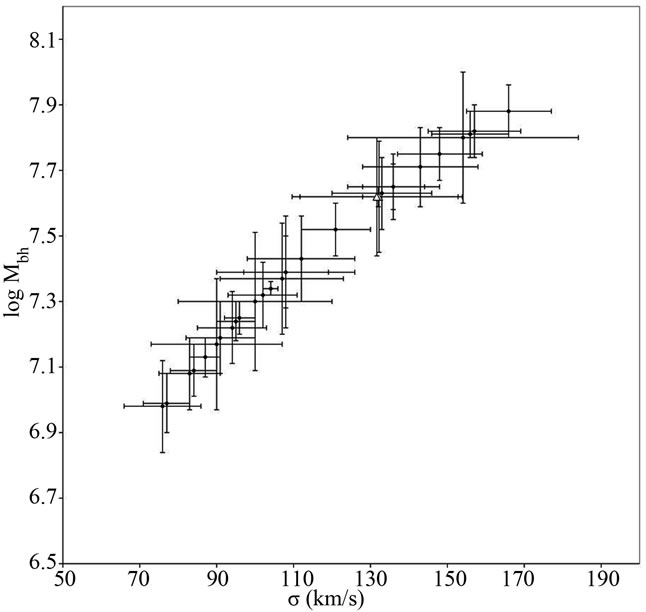
Figure 3. Stellar bulge velocities versus SMBH masses. Solid diamonds are SDSS DR7 targets, hollow triangles are TUG RTT150 values. PGC70061 has been excluded for ease of viewing.
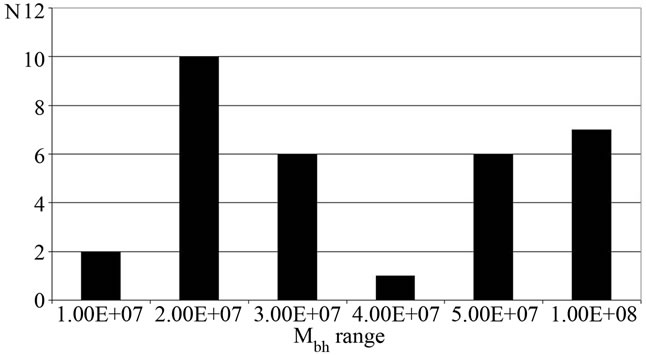
Figure 4. Number distribution of SMBH masses.
SMBH growth rate has been an intense area of research and based on above-mentioned masses no conclusive statement can be made. Still we can make a rough estimation on SMBH growth rate. The common logic dictates that the SMBH hosted by low redshift galaxies must have benefited accumulation of mass during their long existence thus must be heavier; yet SDSS and TUG sample yield contradicting mass estimations. Assuming observed AGN luminosity in other galaxies is the result of mass in fall on to SMBH, roughly speaking in order to satisfy a 1046 erg/s quasar, 2 solar masses per year is required. A low redshift galaxy with z = 0.01 in an open universe is approximately 11 × 109 years old (H0 = 71 km/s/Mpc, WM = 0.27). Assuming the core to be active with the above-mentioned luminosity ratio, the galaxy must have been accumulated over 2 × 10¹⁰ solar masses during its life. The discrepancy between measured 106 - 107 and 2 × 10¹⁰ solar masses can be attributed to signifi-
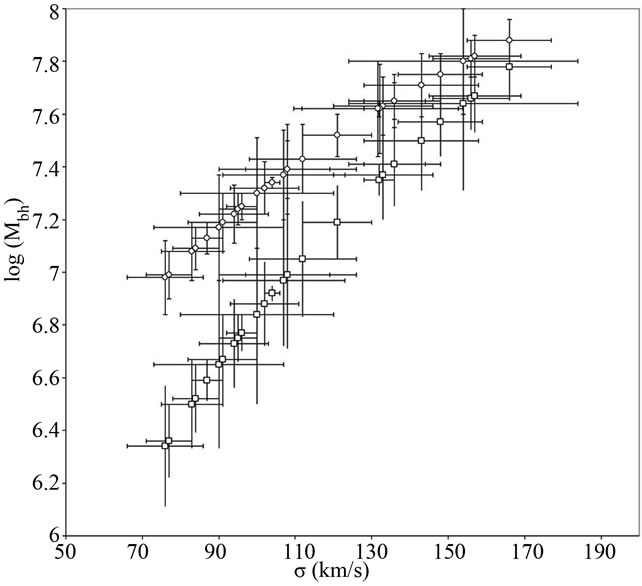
Figure 5. SMBH masses calculated by commonly used M-σ fit Equation (1) (squares) versus refined version Equation (2) (circles) show considerable difference at lower velocities.
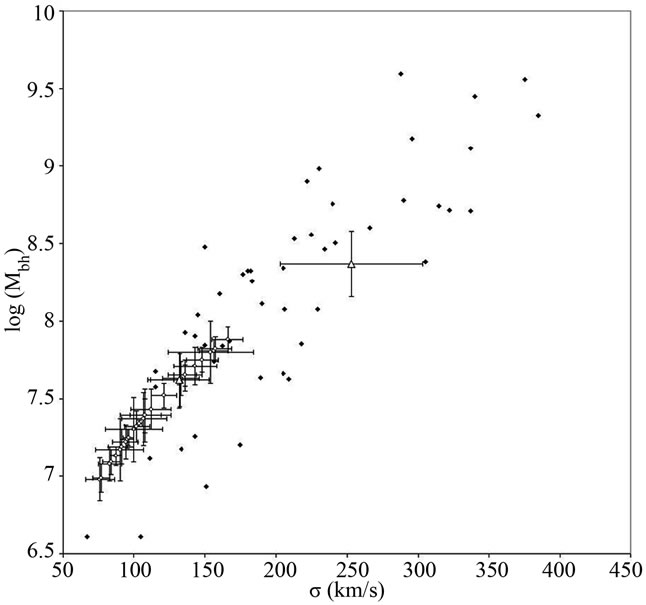
Figure 6. Stellar bulge velocities versus SMBH masses. Solid diamonds are the values taken from Gültekin (2009) [16], hollow circles are SDSS DR7 targets and the triangles denote TUG estimates.
cant dormant periods. Without reliable information on initial mass and accumulation rates it is hard to make an accurate estimate, still it is safe to say that these galaxies were either not active or had very little activity for the most of their lives.
In conclusion the M-σ relationship can be refined for each redshift regime by taking morphological type and galaxy orientation into account. As shown in Figure 1, Equation (2) provides more reliable mass estimates for edge-on, low redshift spirals thus more suitable than the commonly used M-σ relationship. Such refinements will reduce the scatter in the original fit [Equation (1)] and increase the reliability of the M-σ relationship. Using the refined formula [Equation (2)] we find that low redshift spiral galaxies harbor in the order of 107 solar mass SMBH’s. When compared to the general census of the SMBH the masses presented in Table 5 cannot be considered among the heavier weight SMBH. Thus we conclude low redshift galaxies must have spent most of their lifetime without active cores.
We intend to investigate mass histograms for different redshift regimes and morphologies. This will probably enable us to reach to an M-σ function rather than a single equation. It should be the case, the function will probably require new terms for morphological type, redshift and orientation. In order to increase the quality of the data, besides using newer data releases of SLOAN survey, we intend to observe new targets using TUG RTT150 TFOSC spectrograph with higher resolution setup, concentrating on 5000 - 7000 Å. This will sacrifice many potentially useful wavelengths; yet our precision in velocity measurements will increase.
6. Acknowledgements
The authors thank Ahmet Dervişoğlu for valuable discussion in data reduction, Ömür Çakırlı for initial FWHM estimations for TUG observations, Irek Khatimov and Murat Parmaksızoğlu for their assistance during the TUG observations, Esin Sipahi and Hasan Ali Dal for reviewing fits and errors, Dale Allen Ross for careful editing. This project has been supported by Turkish Scientific Council (no. 485) and all observations are done using TUBITAK National Observatory 1.5 m telescope.
Funding for the SDSS and SDSS-II has been provided by the Alfred P. Sloan Foundation, the Participating Institutions, the National Science Foundation, the US Department of Energy, the National Aeronautics and Space Administration, the Japanese Monbukagakusho, the Max Planck Society, and the Higher Education Funding Council for England. The SDSS Web Site is http://www.sdss. org/.
REFERENCES
- A. M. Ghez, et al., “Measuring Distance and Properties of the Milky Way’s Central Supermassive Black Hole with Stellar Orbits,” Astrophysical Journal, Vol. 689, No. 2, 2008, pp. 1044-1062. doi:10.1086/592738
- A. Dressler and D. O. Richstone, “Stellar Dynamics in the Nuclei of M31 and M32—Evidence for Massive Black Holes?” Astrophysical Journal, Vol. 324, 1988, pp. 701-713. doi:10.1086/165930
- J. Kormendy, “Evidence for a Supermassive Black Hole in the Nucleus of M31,” Astrophysical Journal, Vol. 325, 1988, pp. 128-141. doi:10.1086/165988
- L. J. Greenhill, J. M. Moran and J. R. Herrnstein, “The Distribution of H2O Maser Emission in the Nucleus of NGC 4945,” Astrophysical Journal Letters, Vol. 481, No. 1, 1997, p. L23. doi:10.1086/310643
- N. J. McConnell, et al., “Two Ten-Billion-Solar-Mass Black Holes at the Centres of Giant Elliptical Galaxies,” Nature, Vol. 480, No. 7376, 2012, pp. 215-218. doi:10.1038/nature10636
- R. Martin, “Black Hole Models for Active Galactic Nuclei,” Annual Review of Astronomy and Astrophysics, Vol. 22, 1984, pp. 471-506. doi:10.1146/annurev.aa.22.090184.002351
- D. Alan, “Observational Evidence for Supermassive Black Holes Active Galactic Nuclei,” Proceedings of the 134th Symposium of the International Astronomical Union, Kluwer Academic Publishers, Dordrecht, 1989, p. 217.
- J. Magorrian, et al., “The Demography of Massive Dark Objects in Galaxy Centers,” The Astronomical Journal, Vol. 115, No. 6, 1998, pp. 2285-2305. doi:10.1086/300353
- D. Richstone, et al., “Supermassive Black Holes and the Evolution of Galaxies,” Nature, Vol. 395, No. 6701, 1998, pp. A14-A19.
- L. Ferrarese and D. Meritt, “A Fundamental Relation between Supermassive Black Holes and Their Host Galaxies,” The Astrophysical Journal, Vol. 539, No. 1, 2000, pp. L9-L12. doi:10.1086/312838
- K. Gebhardt, et al., “A Relationship between Nuclear Black Hole Mass and Galaxy Velocity Dispersion,” Astrophysical Journal, Vol. 539, No. 1, 2000, p. L13. doi:10.1086/312840
- N. Häring and H. W. Rix, “On the Black Hole MassBulge Mass Relation,” The Astrophysical Journal, Vo. 604, No. 2, 2004, pp. L89-L92. doi:10.1086/383567
- S. Kaspi, et al., “Reverberation Measurements for 17 Quasars and the Size-Mass-Luminosity Relations in Active Galactic Nuclei,” The Astrophysical Journal, Vol. 533, 2000.
- C. H. Nelson, “Black Hole Mass, Velocity Dispersion, and the Radio Source in Active Galactic Nuclei,” Astrophysical Journal, Vol. 544, No. 2, 2000, pp. L91-L94. doi:10.1086/317314
- T. Boroson, “Does the Narrow [O III] l5007 Line Reflect the Stellar Velocity Dispersion in Active Galactic Nuclei?” Astrophysical Journal, Vol. 585, No. 2, 2003, pp. 647-652. doi:10.1086/346111
- K. Gültekin, et al., “The M-σ and M-L Relationd in Galactic Bulges, and Determinations of Their Intrinsic Scatter,” The Astrophysical Journal, Vol. 698, 2009, pp. 198-221. doi:10.1088/0004-637X/698/1/198
- C. Nelson, A. Plasek, A. Thompson, R. Gelderman and T. Monroe, “[OIII] Emission Line Profiles in PG Quasars,” ASP Conference Series, Vol. 311, Astronomical Society of the Pacific, San Francisco, 2004, p. 83.
- K. Gültekin, “Determination of the Intrinsic Scatter in the M-Sigma and M-L Relations,” 2009.
- B. M. Peterson, et al., “Central Masses and Broad-Line Region Sizes of Active Galactic Nuclei. II A Homogeneous Analysis of a Large Reverberation-Mapping Database,” Astrophysical Journal, Vol. 613, 2004, pp. 682-699.
- S. P. Rusli, et al., “The Central Black Hole Mass of the High-σ but Low-Bulge-Luminosity Lenticular Galaxy NGC 1332,” Monthly Notices of the Royal Astronomical Society, Vol. 410, No. 2, 2011, pp. 1223-1236. doi:10.1111/j.1365-2966.2010.17610.x
- C. J. Grier, et al., “Reverberation Mapping Results for Five Seyfert 1 Galaxies,” Astrophysical Journal, Vol. 755, No. 1, 2012, 16 p.
- E. Emsellem, H. Dejonghe and B. Roland, “Dynamical Models of NGC 3115,” Monthly Notices of the Royal Astronomical Society, Vol. 303, No. 3, 1999, pp. 495-514. doi:10.1046/j.1365-8711.1999.02210.x
- K. Gebhardt, et al., “Black Hole Mass Estimates from Reverberation Mapping and Spatially Resolved Kinematics,” Astrophysical Journal, Vol. 543, No. 1, 2000, pp. L5-L8. doi:10.1086/318174
- A. J. Barth, et al., “The Lick AGN Monitoring Project 2011: Reverberation Mapping of Markarian 50,” The Astrophysical Journal Letters, Vol. 743, No. 1, 2011, p. L4. doi:10.1088/2041-8205/743/1/L4
- N. Cretton and F. C. van den Bosch, “Evidence for a Massive Black Hole in the S0 Galaxy NGC 4342,” ASP Conference Series, Vol. 182, 1999.
- J. Kormendy, “Evidence for a Central Dark Mass in NGC 4594 (the Sombrero Galaxy),” Astrophysical Journal, Vol. 335, 1988, pp. 40-56. doi:10.1086/166904
- A. Beifiori, et al., “Upper Limits on the Masses of 105 Supermassive Black Holes from Hubble Space Telescope/ Space Telescope Imaging Spectrograph Archival Data,” The Astrophysical Journal, Vol. 692, No. 1, 2009, pp. 856-868. doi:10.1088/0004-637X/692/1/856
- K. Gebhardt, et al., “The Black Hole Mass and Extreme Orbital Structure in NGC 1399,” The Astrophysical Journal, Vol. 671, No. 2, 2007, pp. 1321-1328. doi:10.1086/522938
- L. Ferrarese, H. C. Ford and W. Jaffe, “Evidence for a Massive Black Hole in the Active Galaxy NGC 4261 from Hubble Space Telescope Images and Spectra,” Astrophysical Journal, Vol. 470, 1996, p. 444.
- G. A. Bower, et al., “Kinematics of the Nuclear Ionized Gas in the Radio Galaxy M84 (NGC 4374),” Astrophysical Journal Letters, Vol. 492, 1998, p. L111.
- K. Gebhardt and J. Thomas, “The Black Hole Mass, Stellar Mass-to-Light Ratio, and Dark Halo in M87,” The Astrophysical Journal, Vol. 700, No. 2, 2009, pp. 1690-1701. doi:10.1088/0004-637X/700/2/1690
- L. Ferrarese and H. C. Ford, “Nuclear Disks of Gas and Dust in Early-Type Galaxies and the Hunt for Massive Black Holes: Hubble Space Telescope Observations of NGC 6251,” The Astrophysical Journal, Vol. 515, No. 2, 1999, pp. 583-602. doi:10.1086/307046
- R. P. van der Marel and F. C. van den Bosch, “Evidence for a 3 108 Msun Black Hole in NGC 7052 from Hubble Space Telescope Observations of the Nuclear Gas Disk,” Astronomical Journal, Vol. 116, No. 5, 1998, pp. 2220-2236. doi:10.1086/300593
- M. Cappellari, et al., “The Counterrotating Core and the Black Hole Mass of IC 1459,” Astrophysical Journal, Vol. 578, No. 2, 2002, pp. 787-805. doi:10.1086/342653
- G. De Vaucouleurs, et al., 3rd Reference Catalogue of Bright Galaxies (v.3.9), Springer-Verlag, New York, 1991.