Journal of Sensor Technology
Vol.1 No.4(2011), Article ID:8949,7 pages DOI:10.4236/jst.2011.14013
A Lightweight Data Aggregation Protocol in Wireless Sensor Networks for the Protection of Ancient Sites
1College of Information Science and Technology, Northwest University, Xi’an, China
2Shaanxi Provincial Professional and Technical Institute, Xi’an, China
3Physics Department and INFN, University of Salento, Lecce, Italy
4Key Laboratory of Culture Heritage Research and Conservation, Ministry of Education, Northwest University, Xi’an, China
E-mail: *alessio.perrone@unisalento.it
Received September 1, 2011; revised October 14, 2011; accepted October 28, 2011
Keywords: Wireless Sensor Networks, Ancient Sites, Network Lifetime, Data Aggregation
Abstract
In the application of large-scale ancient site protection, it is necessary to continuously monitor the ambient light, temperature, humidity and so on. However, it is impractical to frequently replace the nodes’ battery in the protected areas. So, the key methods to prolong the network lifetime are to aggregate the collected data and reduce the number of transferring messages. In this paper a Lightweight Data Aggregation Protocol (LDAP) based on the characteristics of the environmental changes in ancient sites is proposed. It has been implemented in the Lab with a dozen of MICAz motes and deployed in the real ancient sites. The result shows that LDAP is effective in reducing the number of transferring packets and satisfies the real application requirements.
1. Introduction
Large-scale ancient site is an important component of China’s precious cultural heritage, such as the worldrenowned Terracotta Warriors and Horses of Qin Dynasty. In the application of Ancient Site protection, it is necessary to monitor the ambient environment continuously and to research the impact of environmental factors on soil erosion, the damage of natural factor to ancient site, the destruction mechanism and how to explore and protect the ancient sites. Therefore, the long-term environment monitoring is an important job of studying protection of ancient sites. It requires to collect and to analyze the environmental data in a real-time and long-term way so as to get the best environmental parameters of ancient site protection. The Wireless Sensor Networks (WSN’s) become the prevalent way for environmental monitoring of Ancient Sites because they are usually landed in the wild region and man-made destruction behaviors, such as drilling and wiring. As a result, it is very important to extend the whole lifetime of WSN’s as long as possible, because it is impractical to replace the node’s battery frequently in the protected areas. Furthermoresensor networks consume energy mainly in the wireless data transmitting and receiving [1], so the key point to prolong the network lifetime is to reduce the number of transferring redundant messages.
Data fusion is defined as to collect information from a raw data source, and extract the raw data using the flexible, programmable components, and transmit data timely after the extraction [1]. It extracts large amounts of data and reduces the number of transmission messages in order to extend the network lifetime. In this paper a lightweight data aggregation protocol based on the characteristics of the environmental changes in the ancient site is proposed. It has been implemented in TinyOS-2.0 and deployed in the simulation soil pit of historical and cultural heritage protection Research Center in Shaanxi Province, using the Crossbow’s MICAz mote (Figure 1). Here, the LDAP performance is analyzed based on a long period of the network operation.
2. Related Work
In recent years, data fusion has been utilized in a variety of environmental monitoring applications. Crowley K. et al.
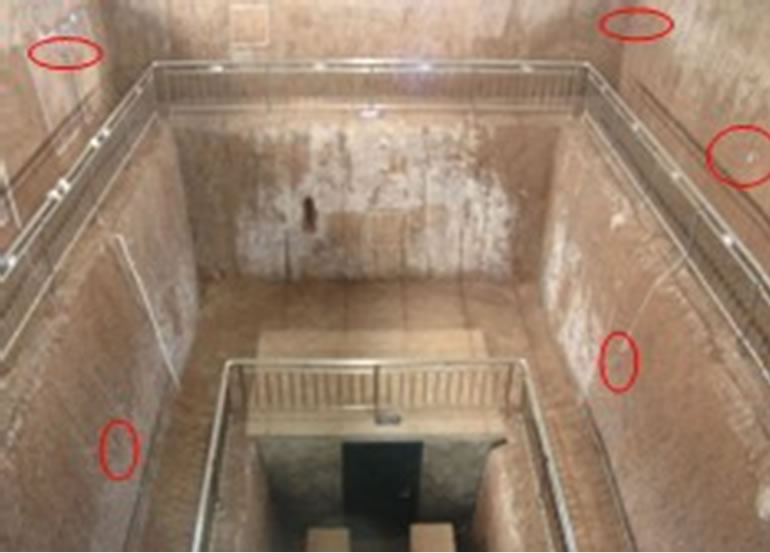
Figure 1. Simulation real ancient site.
[2] monitored the ambient temperature of the storage and transportation of fish products using wireless sensor networks to ensure food safety. Barrenetxea G. et al. [3] deployed nodes in Grand Saint Bernard Mountains between Switzerland and Italy to monitor the environment; in a 900m-long line, 17 nodes have been deployed to prevent the avalanche and accident. Jeon Chan-Sik et al. [4] implemented a campus environmental information monitoring system based on wireless sensor networks. Environmental data are saved to the database and the user can view them by the wireless Personal Digital Assistant (PDA). Lee M. et al. [5] deployed wireless sensor networks in a greenhouse to monitor the greenhouse environment, and it can adjust the ambient temperature and humidity automatically. Sung J. et al. [6] deployed wireless sensor networks in Bul-guk-sa temple in South Korea to collect environmental data, wood structures change and forest fires periodically. Cho S. et al. [7] proposed a two-way query and response mechanisms for data fusion, which aggregates data on the both uplink and downlink to reduce data redundancy effectively, but cannot express the environmental characteristics in the soil environment precisely using a simple maximum or minimum value. Akcan H. et al. [8] proposed a mechanism based on the Weight Tree, which is the first sampling algorithm based on the Weight Tree. This device plays a very good performance compared with the previous random sampling algorithm.
The algorithms dynamically adjust the sampling weights in order to be applied in any network topology. However, the accuracy of data depends on the tree location of nodes, which would result in the uneven expression of the environmental characteristics. Aquino A. L. L. et al. [9] proposed a network data stream compression algorithm OGK according to the requirements of real-time data collection OGK runs in the routing phase and chooses the compression algorithm according to network traffic. Besides, OGK data can reach before the deadline without loss of data, so it has high reliability. However OGK depends on network layer and cannot be independent of the application layer. Chen H. et al. [10] proposed a clustering network adaptive data fusion mechanism ADA, which ensures the reliability of the incident monitoring and adjusts the sample frequency according to the reliability of observation to reduce time relativity of data collection; however, the algorithm mainly implemented in the SINK node. Li X. et al. [11] used TDMA time schedule for each node to collect and report data, deducing the relationship between the time schedule and the ratio of data aggregation theoretically, and the algorithm aggregates internal and external data of the clusters to reduce redundant data transmission; however in the small-scale ancient site environment, the particle size is large to express the environmental characteristics in units of cluster. Liao W. H. et al. [12] used the ant colony algorithm into data fusion, reducing the duplication of redundant data effectively; however, the complexity of the data fusion algorithm should be as light as possible, because the purpose of data fusion is to reduce their energy consumption. Obviously, the complexity of ant colony algorithm is high, which increases the energy consumption of nodes.
3. Protocol Design
LDAP protocol is between the network layer and data link layer, network layer data enter in the data queue, and the aggregated data packets enter in the input queue of Media Access Control (MAC) layer waiting to be sent. Through aggregating the data from the network layer, the number of data transferring on the MAC layer is reduced so that energy consumption of each node is reduced effectively.
3.1. LDAP Protocol Design
As shown in Figure 2, LDAP is divided into aggregation and restore, receiving the data from the MAC layer and restoring the data that is aggregated. The network layer packets and the restored data packets of the other nodes are transmitted after aggregation, thereby reducing the number of data transferring messages, and it is transparency above the network layer, achieving the independent data fusion layer. The workflow of this protocol is as follows: considering a number of sensor nodes, the network layer data enter in the data queue by different data types, and access into the send queue of MAC layer after data fusion. For the MAC layer, it does not know the data types and whether to aggregate the data, which is transparent for the data fusion; the node restore data packets
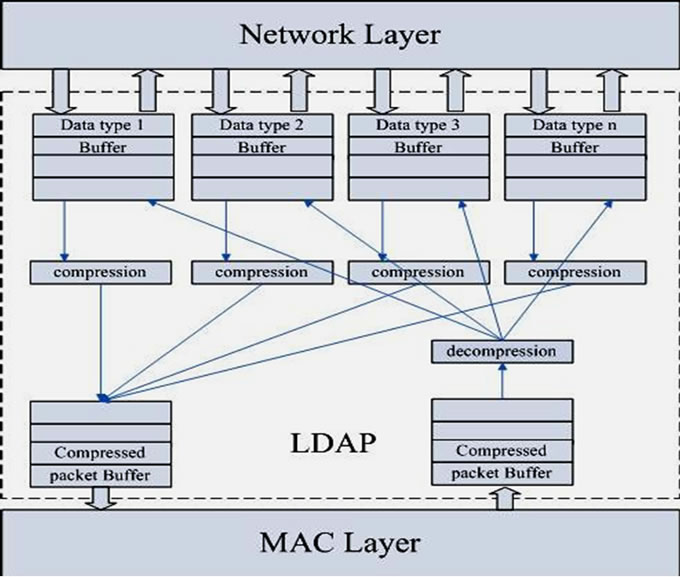
Figure 2. Framework of data aggregation protocol.
in the received data queue of MAC layer after receiving packets, the restored data is sent into the corresponding data queue; one node may receive transmitting data from multiple nodes. Thus, during transmitting, the data will access into data queue of MAC layer after aggregating the data of itself and other nodes in order to achieve the multi-node data fusion to reduce the number of data transferring messages, and compared with the raw data transmitted directly, it optimizes the energy balance of data source nodes and relay nodes. Based on the framework of this protocol, combined with the environmental characteristics of ancient site, a lightweight data compression and decompression algorithm is proposed in the section of 3.2 and 3.3.
3.2. Time-Related Data Compression Algorithm
The environment factors of ancient site (such as temperature, light) change over time slowly and continuously. It will lead to a lot of data redundancy if the raw data is sent directly to the base station each sample cycle. Here, 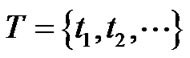 is the sampling cycle,
 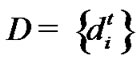 is the data collected by node i at time t. Since the environmental factors change slowly, the data collected by node i from time 0 and time t meet the changing:
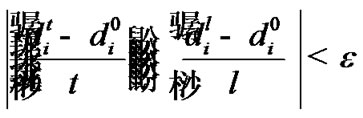
where ,
,  ,
,  , and
, and  is datum collected in the first cycle, ε is the threshold,
 is limited time.
The process of this Algorithm is as follows: the data collected in the first two cycles are the initialization value for value0 and valuelast, count indicates that the number has been saved; if variation of the data during next cycle does not exceed the threshold , then valuelast is changed as the current collecting data, the counter counts plus one; until a sample cycle when the collected data changes beyond
 , a data packet contains the node ID, data type, the first data, the last data, as well as the count and time stamp is constructed. The algorithm depends on the changes of environmental characteristics, if the environment always changes and the change has uncertain pace, each compressed packet contains a smaller amount of raw data, resulting in inefficiency; if the environment changes slowly or the pace of change is relatively stable, each compressed packet contains a relatively large amount of raw data, thus data compression rate and transferring efficiency are improved. The compression ratio of this algorithm is controlled by
 . When
  is larger, more raw data are compressed into a packet, in particular, when
  = 0 it is the lossless compression. The pseudocode of this algorithm is shown in Figure 3.
The packet loss rate is an important performance index, and the high loss rate will impact system greatly. In the experiment, we found that the algorithm has a lower packet loss rate. In order to prevent a lower packet loss rate, ACK-based mechanisms require a lot of system overhead, while the NACK mechanisms need to set aside buffer to store the packet which is not acknowledgment, so it is inappropriate for the low memory sensor node. Therefore, when the number of raw data contained in LDAP data packet beyond a certain threshold value, the packet need to be resent to reduce the probability of packet loss.
3.3. Time-Related Data Decompression Algorithm
Nodes decompress the data packets and extract the original data after receiving the MAC layer data packet. For the data packets in which the value of count is greater
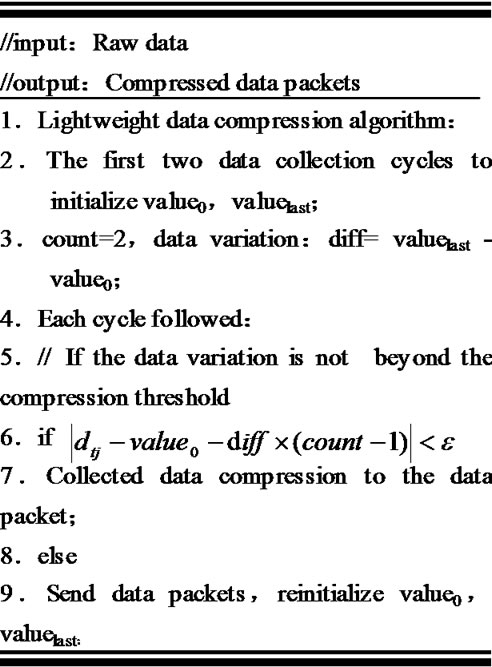
Figure 3. Data compression algorithm.
than the threshold value, the algorithm checks whetherhas been received and neglects duplicate packets. When decompressing the raw data, the timestamp contained in compressed data packet is used to compute the original timestamp. Here, Tperiod is the data collection cycle. At last, the nodes forward the data after compressing and aggregating its own data and those of other nodes. The pseudo-code of this algorithm is shown in Figure 4.
3.4. Time-Related Data Energy Consumption Model
To analyse and calculate equally the difference between the energy consumption of decompression algorithm and no data aggregation and to realize the energy consumption of nodes in different positions.we use a first-order radio model to indicate the deliver energy consumption:  the
the and
and  express energy consumption of transmitter and channel transmission respectively. For convenience ,we set the average packet size as "a" bit and the space between adjacent node as “d”.
The energy consumption without data aggregation can be describe as below: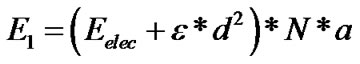 . After using the data decompression algorithm, the number of packets of node is
 , in which the
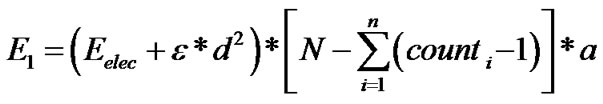
 indicate the number of data be saved in i-th cycle. Then the energy consumption with data aggregation as below:
4. Selection of Algorithm Parameter and Analysis of Experimental Results
This section mainly researches the test and selection of LDAP parameters in a lab environment, and then analyzes the LDAP data traffic, packet loss rate and energy consumption in a real environment.
4.1. Comparison of Algorithm Parameters
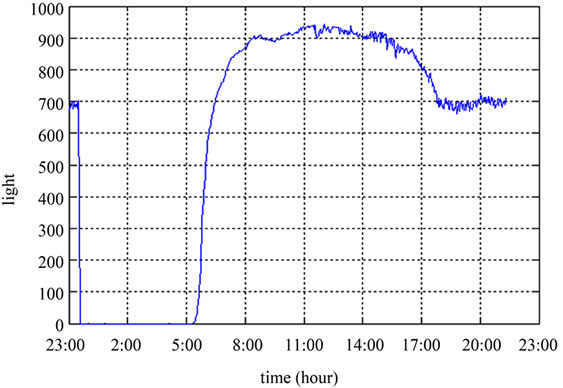
Threshold value  has a direct impact on compression ratio of LDAP. We deployed 6 MICAz nodes which collect light, temperature and voltage once every two minutes for 24-hour in the laboratory, and compared the impact of compression rates and network data traffic with the different thresholds. In order to observe the changes between the data after aggregation and the raw data (take light data as an example), the node 1 sends the raw data back to Gateway directly, nodes 2-6 took 2,6,10,14,18 as light threshold respectively; Figure 5(a) shows light raw data from the node 1. Figure 5(b) shows light raw data from nodes 2-6 that were decompressed in the base station. As the light threshold value increases, the data curve waves so little that it can be seen approximately as a straight line.
Figure 5(b) shows that the time of node 2 is a longer extension because when at the end of experiment, the other nodes are compressing data, and do not send the last compression packet back.
When the threshold value  is smaller, it is more
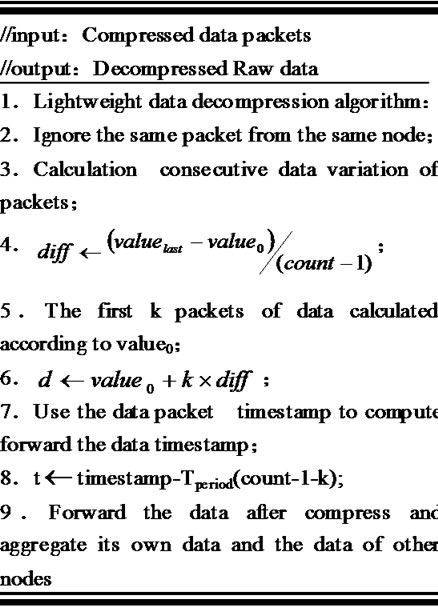
Figure 4. Data decompression algorithm.
 (a)
(a)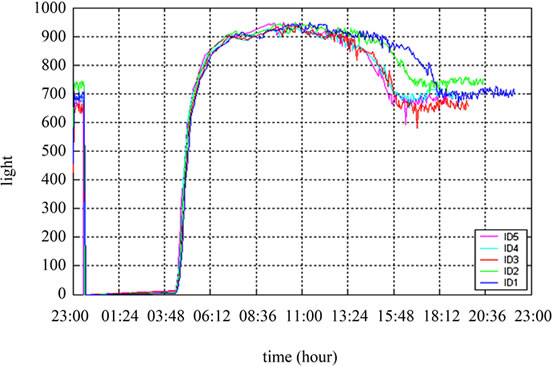 (b)
(b)
Figure 5. (a) No compressed raw light data; (b) Light data for different compression thresholds.
sensitive to environmental change, and the number of compressed data packets may be even greater than the number of raw data. As shown in Figures 6 and 7, the number of compressed data packets of node 2 is greater than the number of raw data of node 1, and the number of compressed packets decreased with the increasing of the threshold. As Figure 7 shows, the compression ratio has reached to 60% when the threshold of light is greater than 3 and the threshold of temperature is greater than 4.
4.2. Performance Analysis of Algorithm in Real Environment
The simulation soil pit of historical and cultural heritage protection Research Center in Shaanxi Province (Figure 1) is 18 m long, 17 m wide, 8 m deep, which is a three-tier structure. In order to study the best environment to the protection of ancient sites, it is required to monitor the temperature and light of the soil wall in the pit. Based on the experimental analysis proposed in Subsection 3.1, we selected 10 and 0.4 as the light and temperature thresh-old, and deployed eight nodes collecting light and tem-
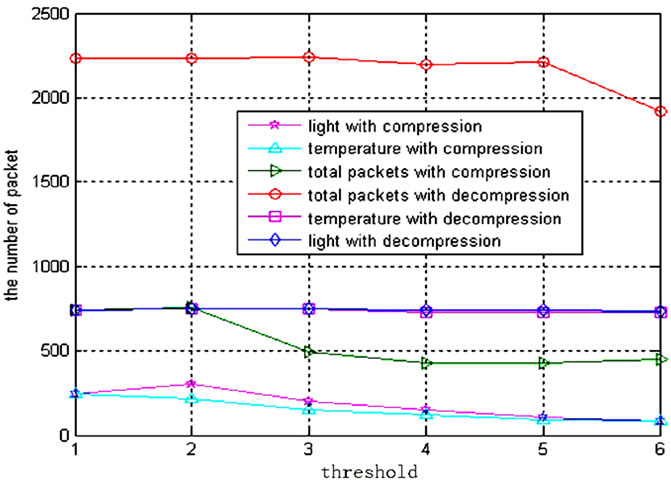
Figure 6. Number of light and temperature packets.
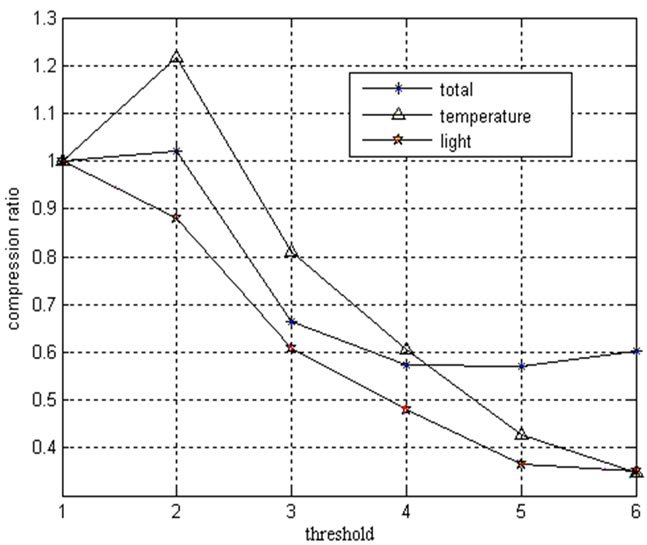
Figure 7. Data compression ratio, temperature compression ratio, light compression ratio.
perature data every five minutes in the actual environment.
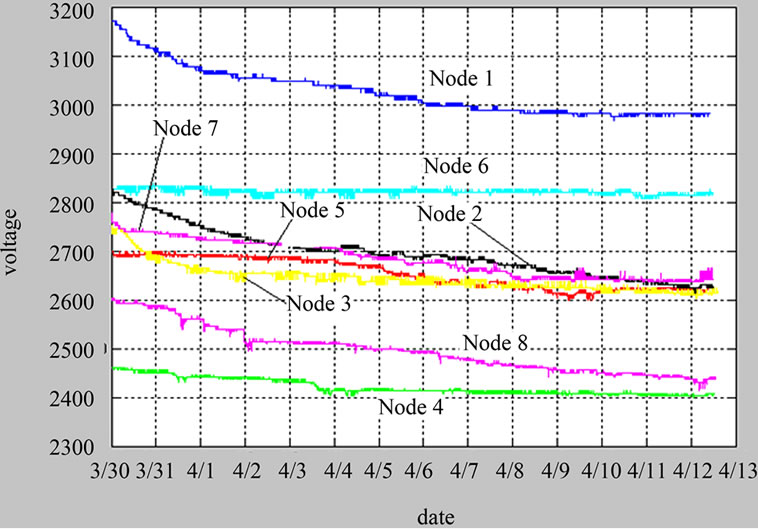
In order to analyze how the battery and the hardware impact on the algorithm, each node used batteries with different remaining electricity. As shown in Figure 8, different batteries have different energy consumption rate. Even though the initial capacity in node 2 and node 4 is the same, the energy consumption rates are different. Nodes run in no data aggregation algorithm regime and in data aggregation algorithms regime for 14 and 10 days, respectively. Figure 8 demonstrate that the voltage decay rate with data aggregation (Figure 8(b)) is far less than the one of no data aggregation (Figure 8(a)). At 4/14 we replaced all the nodes’ battery, in order to get a fair comparison, and put our algorithm into nodes’ program.
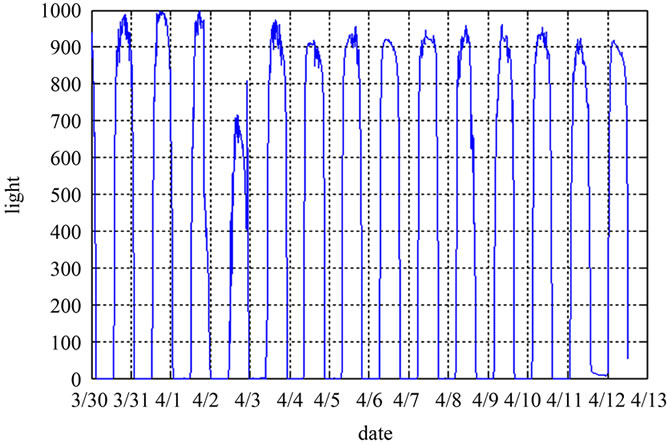
Eight nodes use the same compression threshold, and the decompressed light data of node 2 that was selected randomly are shown in Figure 9 indicating a smaller difference between the data after decompression and the raw data. Because using the resend mechanism when Count is greater than the threshold, the packet loss rate is
 (a)
(a)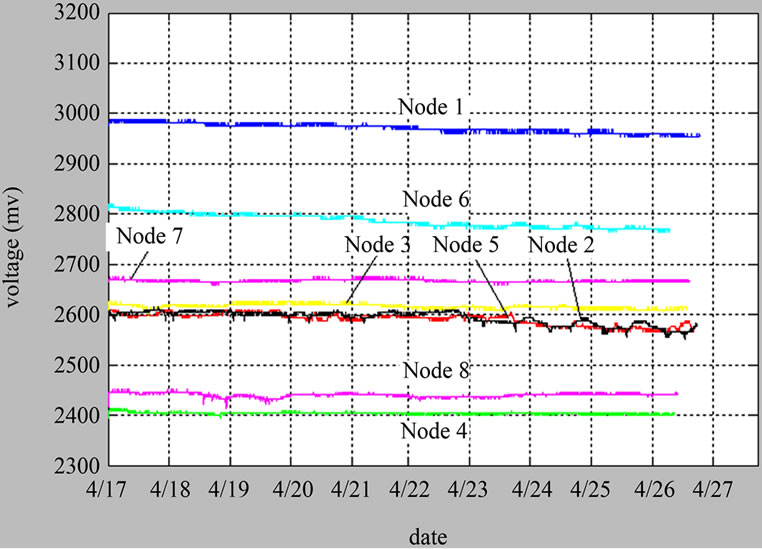 (b)
(b)
Figure 8. (a) Voltage decay rate with no data aggregation ratio; (b) Voltage decay rate of LDAP with data aggregation.
reduced effectively, and packet loss as shown in Figure 10. With the same compression threshold, the number of compressed data packets received by base station just reflects the environmental changes extent at different positions. The smaller change range of light and tempreraturea are, the more time point data could be aggregated. As shown in Figure 11, the high number of packet per day indicates that the changes scope and speed of light and temperature of node 2 and node 3 are larger. That because they are close to the door; therefore when the door is open or closed, the sensor data change more than other nodes and more packets will be sent.
LDAP reduces the amount of data sent by nodes, as shown in Figure 11, the average number of packets sent by LDAP per day is less than 57% of the raw data; com-
 (a)
(a)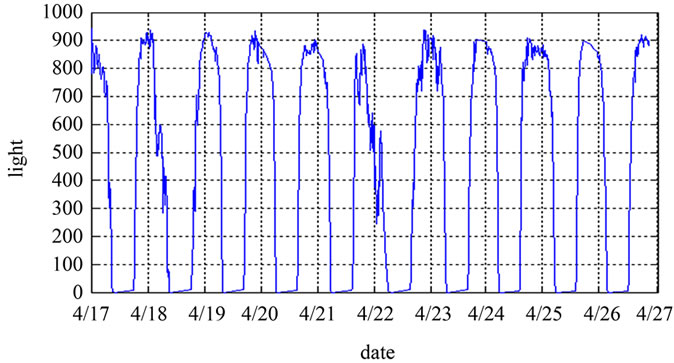 (b)
(b)
Figure 9. (a) Raw light data; (b) LDAP light data.
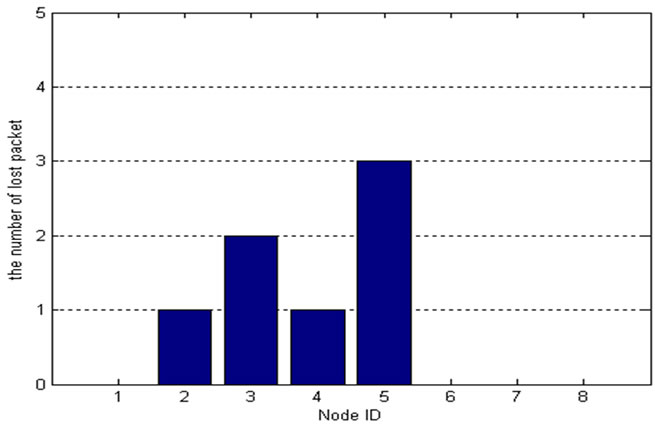
Figure 10. LDAP number of loss packet.
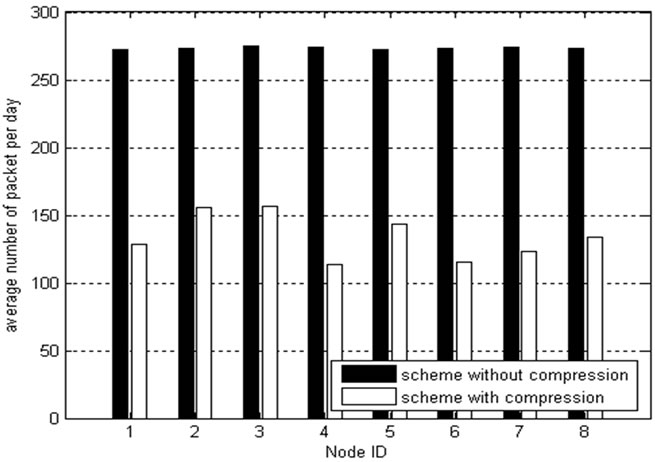
Figure 11. Raw data & average no. of packets/day.
pared with no data fusion algorithm, it reduces the node’s energy consumption obviously, as shown in Figure 8, the remaining electricity of node 1 down to 2.98 V from 3.18 V during the first 14 days, and down to 2.96 V from 2.98 V during the next 10 days; the remaining electricity of node 7 down to 2.66 V from 2.77 V during the first 14 days, and down to 2.67 V from 2.68 V during the next 10 days.
4.3. Evaluation of Energy Consumption and Network Lifetime for a Long-Term Deployment
The network has been running for 4 months, and data were collected once every 15 minutes, the battery voltage down to 2.63 V from 2.82 V. As shown in Figure 12, with the drops of battery voltage, the speed of voltage drop accelerates. The operating voltage range of MICAz is 2.4 V - 3.3 V, but in the actual scene, when the voltage is as low as 2.1 V, the node communication only began to become unstable, so we estimate the network can continuously work 4 more months without replacing the batteries. As shown in Figure 13, there is no influence on the temperature data.
If the initial battery voltage is 3.2 V, according to the energy consumption in the actual scene, the lifetime of sensor network will reach 18 months. So, it becomes a reality site to continuously monitor ancient site environment in a long-term.
The Figure 14 shows the total energy consumption with LDAP in a whole year. The curves of 8 nodes can show clearly that in the period of April to May and September to October, due to seasonal changes in temperature increasing the rate of change, the data packets increased then the energy consumption increases obviously.
5. Conclusions
In this paper a lightweight data aggregation protocol LDAP has been designed and implemented. A time-re-
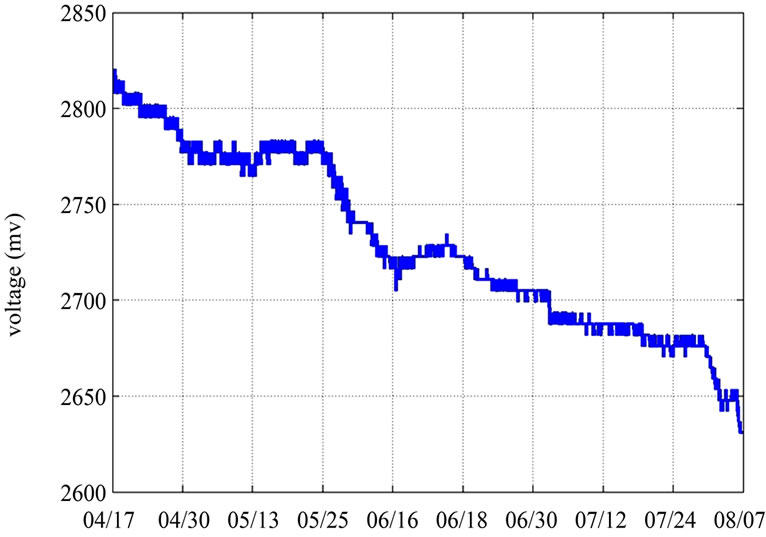
Figure 12. LDAP voltage decay of node battery.
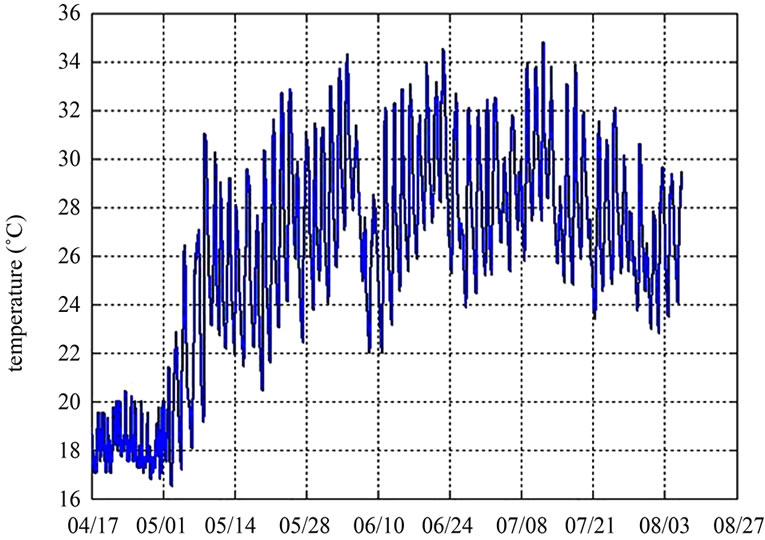
Figure 13. LDAP temperature data.
lated datacompression and decompression algorithms have been also implemented, reducing the data redundancy which can reduce the number of data transferring packets, reaching the final purpose of saving node’s energy. Using the sensor network with LDAP deployed in the real environment and run for two weeks, we obtained a number of valuable testing data. Data packets traffic and the relationship between packet loss rate and energy consumption have been also analyzed. The experimental results show that it is possible to monitor ancient sites environment with the heuristic data aggregation mechanism proposed in this paper.
In this paper, we only compress the time-related data, but we do not consider the space-related data. In the future work we will study the spatial relativity of actual environmental data collection; furthermore we shall eliminate the redundancy of space-related data attaining a data aggregation framework combined with time and space.
6. Acknowledgements
This work was supported by the National Natural Science Foundation of China (61070176,61170218); 2010 Sino-Italian Inter Governmental Cooperation Project (the 13th Science and Technology Joint Committee Protocol, No.16, Annex 4); the Research Fund for the Doctoral Program of Higher Education of China (201061011100 180); the Key Project of Chinese Ministry of Education (211181); the Scientific and Technological Project in Shaanxi Province (2011K06-07, 2011K06-09); the Department of Education research project of Shaanxi province, China (2010JK854, 09JK736, 2010JC25); Opening Foundation of Key Laboratory of Culture Heritage Research and Conservation (Northwest University); Ministry of Education; Opening Foundation of Key Laboratory of Resource Biology and Biotechnology in Western China (Northwest University), Ministry of Education.
7. References
[1] E. F. Nakamura, A. A. F. Loureiro and A. C. Frery, “Information Fusion for Wireless Sensor Networks: Methods, Models, and Classifications,” ACM Computing Surveys, Vol. 39, No. 3, 2007, pp. 1-55.
[2] K. Crowley, J. Frisby, S. Edwards, S. Murphy, M. Roantree and D. Diamond, “Web-Based Real-Time Temperature Monitoring of Shellfish Catches Using a Wireless Sensor Network,” Sensors & Actuators A: Physical, Vol. 122, No. 2, 2005, pp. 222-230. doi:10.1016/j.sna.2005.05.011
[3] G. Barrenetxea, F. Ingelrest, G. Schaefer and M. Vetterli, “Wireless Sensor Networks for Environmental Monitoring: The SensorScope Experience,” 2008 IEEE International Zurich Seminar on Communications, Zurich, 12-14 March 2008, pp. 98-101.
[4] J. Chan-Sik, L. Min-Jae and O. Seung-Hyun, “A Design and Implementation of Ubiquitous Campus Environment Information Service,” International Conference on Advanced Language Processing and Web Information Technology (ALPIT 2008), Dalian, 23-25 July 2008, pp. 362-366.
[5] M. H. Lee, K.-B. Eom, H. J. Kang, C. S. Shin and H. Yoe, “Design and Implementation Wireless Sensor Network for Ubiquitous Glass Houses,” Seventh IEEE/ACIS International Conference, 2008 Computer and Information Science, Portland, 14-16 May 2008, pp. 397-400.
[6] J. Sung, S. Ahn, T. Park, S. Jang, D. Yun, J. Kang, S. E. Yoo, P. Chong and D. Kim, “Wireless Sensor Networks for Cultural Property Protection,” 22nd International Conference on Advanced Information Networking and Applications—Aina Workshops, Okinawa, 25-28 March 2008, pp. 615-620.
[7] S. Cho, “Bidirectional Data Aggregation Scheme for Wireless Sensor Networks,” Springer-Verlag Berlin, Heidelberg, 2006.
[8] H. Akcan and H. Brönnimann, “A New Deterministic Data Aggregation Method for Wireless Sensor Networks,” Signal Processing, Vol. 87, No. 12, 2007, pp. 2965-2977. doi:10.1016/j.sigpro.2007.05.007
[9] A. L. L. Aquino, A. A. F. Loureiro, A. O. Fernandes and R. A. F. Mini, “An in-Network Reduction Algorithm for Real-Time Wireless Sensor Network Applications,” Proceedings of the 4th ACM Workshop on Wireless Multimedia Networking and Performance Modeling, Vancouver, British Columbia, Canada, 2008.
[10] H. Chen, H. Mineno and T. Mizuno, “Adaptive Data Aggregation Scheme in Clustered Wireless Sensor Networks,” Computer Communications, Vol. 31, No. 15, 2008, pp. 3579-3585. doi:10.1016/j.comcom.2008.06.011
[11] X. Li, H. Kang and J. Cao, “Coordinated Workload Scheduling in Hierarchical Sensor Networks for Data Fusion Applications,” Journal of Computer Science and Technology, Vol. 23, No. 3, 2008, pp. 355-364. doi:10.1007/s11390-008-9138-7
[12] W. H. Liao, Y. Kao and C.-M. Fan, “Data Aggregation in Wireless Sensor Networks Using Ant Colony Algorithm,” Journal of Network and Computer Applications, Vol. 31, No. 4, 2008, pp.387-401. doi:10.1016/j.jnca.2008.02.006