Advances in Molecular Imaging
Vol.2 No.2(2012), Article ID:18700,7 pages DOI:10.4236/ami.2012.22002
Spontaneous Luminescence Background in Living Nu/Nu Mice
1Department of Neurological, Neuropsychological, Morphological and Motor Sciences, Section of Anatomy and Histology, University of Verona, Verona, Italy
2Medical Physics Department, S. Raffaele Scientific Institute, Milan, Italy
Email: federico.boschi@univr.it
Received March 6, 2012; revised March 20, 2012; accepted April 9, 2012
Keywords: In Vivo; Small Animal Imaging; Optical Imaging; Bioluminescence; Cerenkov Luminescence Imaging; Radionuclide Luminescence Imaging; Diet
ABSTRACT
Spontaneous light emission from living animals can overcome the investigated light signals in small animal luminescence imaging. Despite autofluorescence emission is well studied the spontaneous luminescence background is less known and its importance is growing due to the new born imaging techniques like Cerenkov Luminescence Imaging and Radionuclide Luminescence Imaging in which faint sources are often involved. In order to investigate the spontaneous emission we studied the background luminescence in vivo from health Nu/Nu mice in optical imaging acquisitions and we related it with the optical properties of the diet of the animals. In particular luminescence images of mice feed with normal diet used in animal facilities were acquired using a commercial optical imager. The intensity and the spectral features of the luminescence emission from the animal surface after sunshine exposition and after normal lighting laboratory conditions were measured. The same was done with the pellets of food used to feed the animals. We found a background emission from the entire animal surface and localized light sources in the abdominal/lumbar region. Their intensity can be modulated by the light exposition of the animals before the imaging session and decreases along the time when they are put in darkness. The comparison of the luminescence time decay of animals and pellets suggests that the light sources are related to the persistent luminescence of the molecules contained in the food. So ambient exposure before imaging is important for luminescence imaging in order to keep down the background. The optical properties of food are also important and it necessary to check them before to feed the animals not only in fluorescence imaging but also in luminescence imaging.
1. Introduction
In vivo bioluminescence imaging (BLI) is a molecular imaging technique that offers important opportunities for investigating a wide variety of disease processes. BLI utilizes luciferase as an internal biological light source that can be genetically programmed to noninvasively “report” the presence or activation of specific biological events and it is used to demonstrate expression of celland tissue-specific promoters, label cell populations and detect protein-protein interaction. These applications of BLI technology have allowed quantitative measurements of tumor burden and treatment response, immune cell trafficking, and detection of gene transfer [1]. Due to its versatility, BLI has been adopted to study preclinical efficacy of drug candidates [2-5] as well as various aspects of mammalian biology via reporter assays [6,7].
BLI can detect relatively weak signals and many factors can limit such detection. Increasing the light emission from cells is one of the most effective ways of overcoming these limitations [8]. In order to increase the signal to noise ratio another approach can be based on the reduction of the spontaneous background emission from the animal surface that can be revealed during the imaging process. The origins of this emission needs to be investigated and despite they could be due to a large plethora of different experimental conditions, it is necessary to investigate the most important ones. On the contrary the autofluorescence at the living organisms is more investigated and the sources are considered endogenous cromophores in animal tissues and fluorochromes accumulated with the diet [9].
Besides the well known BLI technique in the last years a novel technique called Cerenkov Luminescence Imaging (CLI) appeared in the in vivo molecular imaging landscape [10,11]. CLI is based on the detection of optical photons that are generated in a medium when charged particles travel in the biological tissues with a velocity greater of the speed of light in the same media. The use of CLI allows the use of nuclear radiotracers such as 18F-FDG in small animal models. More precisely it has been shown that radiotracers uptake in tumor sites and can be visualized with CLI technique [10,12]. Moreover CLI permits now 3D imaging reconstruction for a better localization of the luminescence sources [13-15].
More recently Optical Imaging techniques were also used to investigate in vivo luminescence emissions due to the interaction of alpha particles with biological tissues [16] or the fainter fluorescence produced by gamma-rays emitted by Tc99 m [17].
BLI, CLI and the new radio luminescence imaging (RLI) are based on the detection of faint light signals and thus a CCD detector with high quantum efficiency and low noise is typically required in order to measure a signal above the background level. Any other possible unspecific sources of optical photons need to be reduced in order to increase the signal to background ratio and or to avoid misleading conclusions, in particular when studying organs located in the abdomen.
During measurements conducted with an Optical Imager (IVIS 200, Caliper, Alameda USA) we noticed a small light emission from healthy animals before treatment with luciferine or radioisotopes. The light emission from control (untreated) mice showed a slow reduction after the animals were placed in the dark chamber of the instrument when performing kinetic studies.
Very little attention to the background emission can be found in literature [9] and, thus, a more detailed investigation is needed. A deeper understanding of the background light emission is important due to the detection of weaker optical emission using the novel techniques mentioned before.
The main goal of this work was to investigate the luminescence background emission form healthy Nu/Nu mice, along with the time decay of the signal and its spectral features. In order to find a possible cause we compared the in vivo results with the optical properties of the food provided to the animals for two weeks before the experimental sessions.
2. Materials and Methods
2.1. Animal Preparation
Twelve living Nu/Nu mice of six weeks were feed for two weeks with Global diet 2018 complete feed for rodents, purchased by Harlan Italy (produced and packaged by Mmucedola, Settimo milanese, Italy). For the feed composition see Appendix A. One animal group (n = 6) was exposed for one hour to the sunshine exposure (SE) before being placed in the laboratory while the second group (n = 6) was exposed for one hour to the normal laboratory lightening exposure (NE). Animals were handled accordingly with the regulations of the Italian Ministry of Health and to the European Communities Council (86/609/EEC) directives.
Similarly the pellets of food were exposed to SE and NE for one hour and then imaged with the optical images instrument.
2.2. Instrument and Images Acquisition
BLI images were acquired in the IVIS 200 optical imager (Caliper Life Sciences, Alameda, USA). The IVIS 200 is equipped with a back-thinned, back-illuminated CCD camera cooled at –90˚C. The CCD has an active array of 1920 × 1920 pixels with a dimension of 13 microns.
Mice were imaged with exposure time = 300 s, binning B = 16 for animals, f/1 and a Field of View = 12.8 cm. Pellet of food were imaged with exposure time = 60 s, binning B = 8, f/1 and a Field of View = 12.8 cm. Spectra were measured by acquiring six images with the narrow band (FWHM ~20 nm) emission filters (centred on 560 nm, 580 nm, 600 nm, 620 nm, 640 nm and 660 nm) and corrected for time decay. Images were acquired and analyzed with Living Image 4.0 (Caliper Life Sciences, Alameda, USA).
3. Results
3.1. In Vivo Imaging
BLI images of the animals revealed a luminescence background emission from the entire animal surface and localized high intensity sources in the abdominal/lumbar region; this emission can be seen both in mice placed in dorsal position (Figure 1) and in mice placed in ventral position (Figure 2).
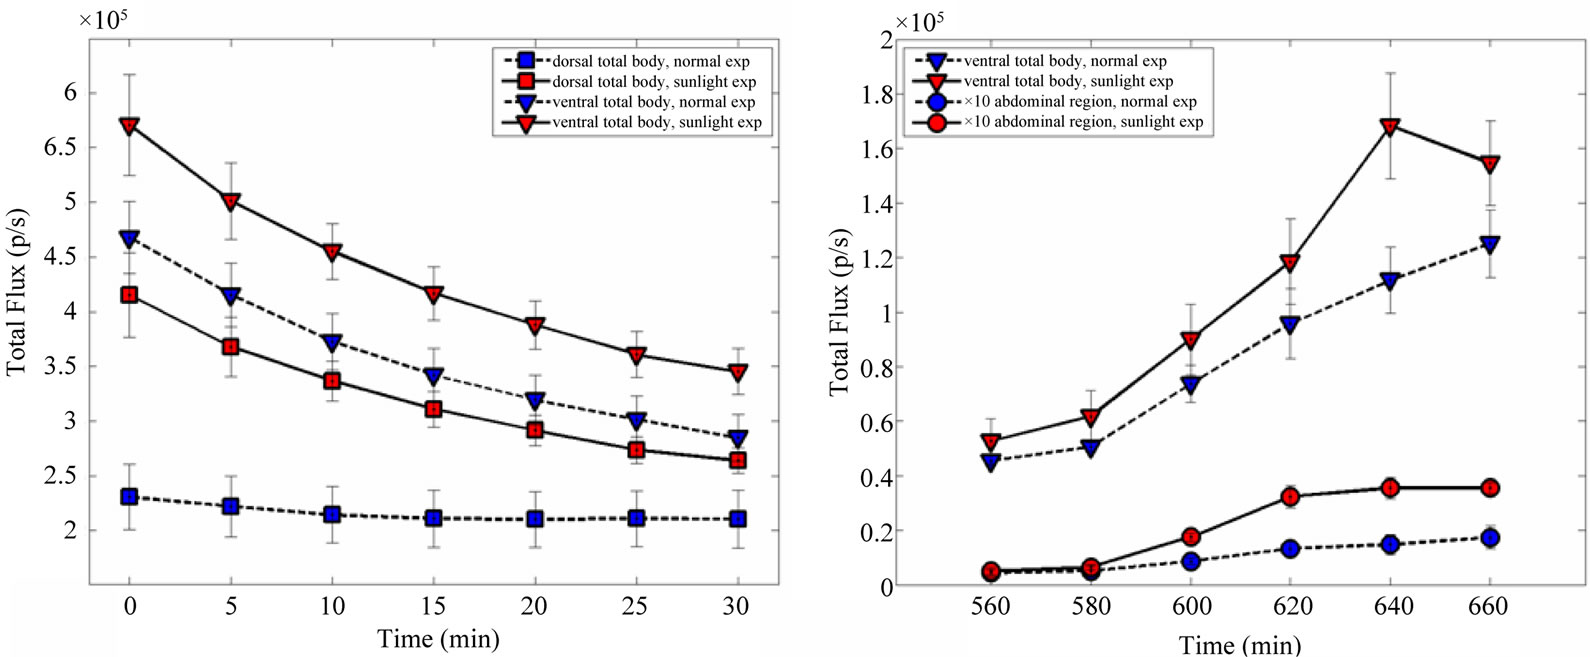
Luminescence background has similar spatial distribution in both SE and NE groups; however the total flux (ph/s) of diffuse and localized light emissions are higher in the SE animals with respect to the NE ones. Luminescence intensities show an exponential decrease during the experimental period in SE (prone and ventral) and in NE (prone) mice. For the NE ventral group the light intensity emission decrease in the first minutes after the introduction of the animals in the dark chamber and reaches a plateau after 10 - 15 min. In both of cases (prone and ventral) the light emission for the SE group remains higher than the NE plateau intensity even 30 min after the introduction of the animals in the dark chamber (Figure 3, panel a).
The emission spectra were measured on the entire animal surface in ventral position and in a circular region of interest (ROI) centred on abdominal ROI (Figure 3, panel b). The emission increases with the wavelength from 560 to 660 nm in both the entire animal surface and in the abdominal region for the two experimental groups.
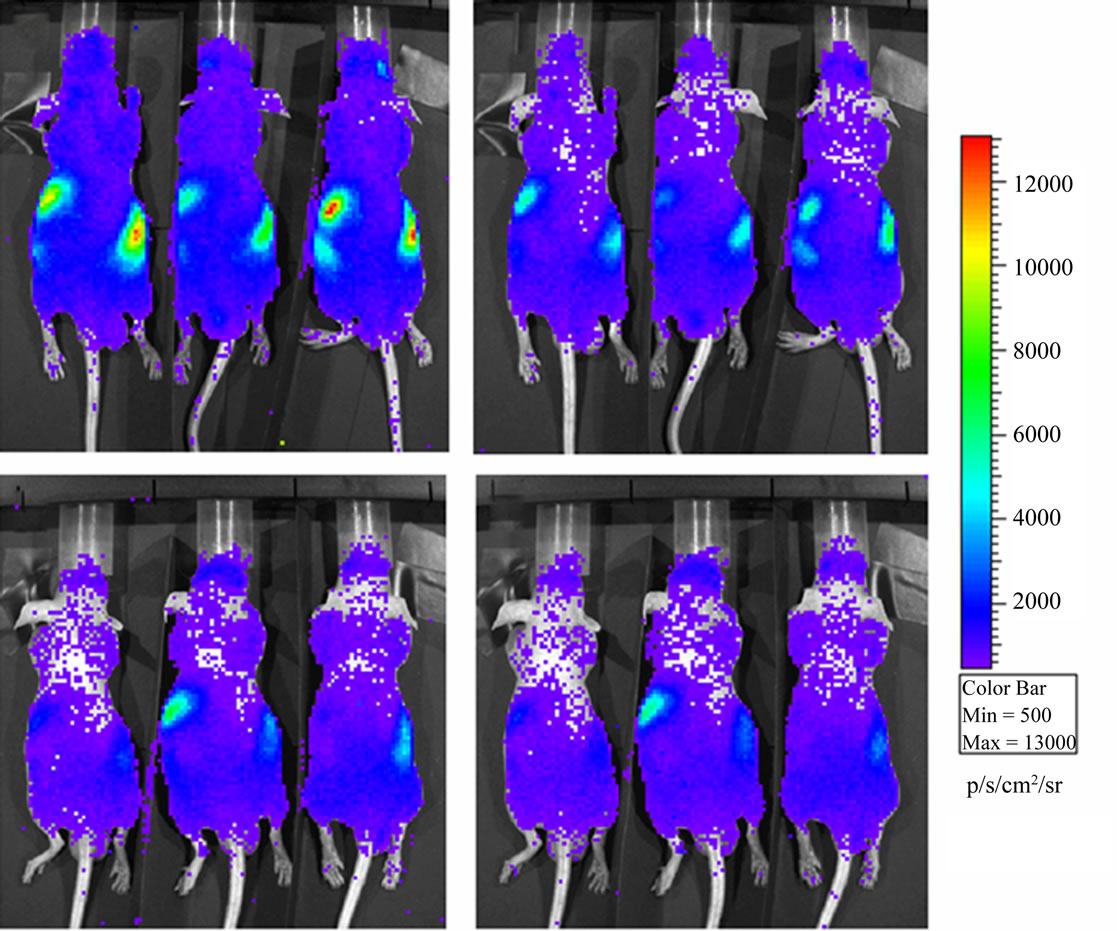
Figure 1. Luminescence background in Nu/Nu mice just after sunshine exposition (panel a) and half an hour later in the dark chamber of the instrument (panel b). Luminescence background in Nu/Nu mice after normal laboratory exposition (panel c) and half an hour later (panel d). Mice are placed in dorsal position.
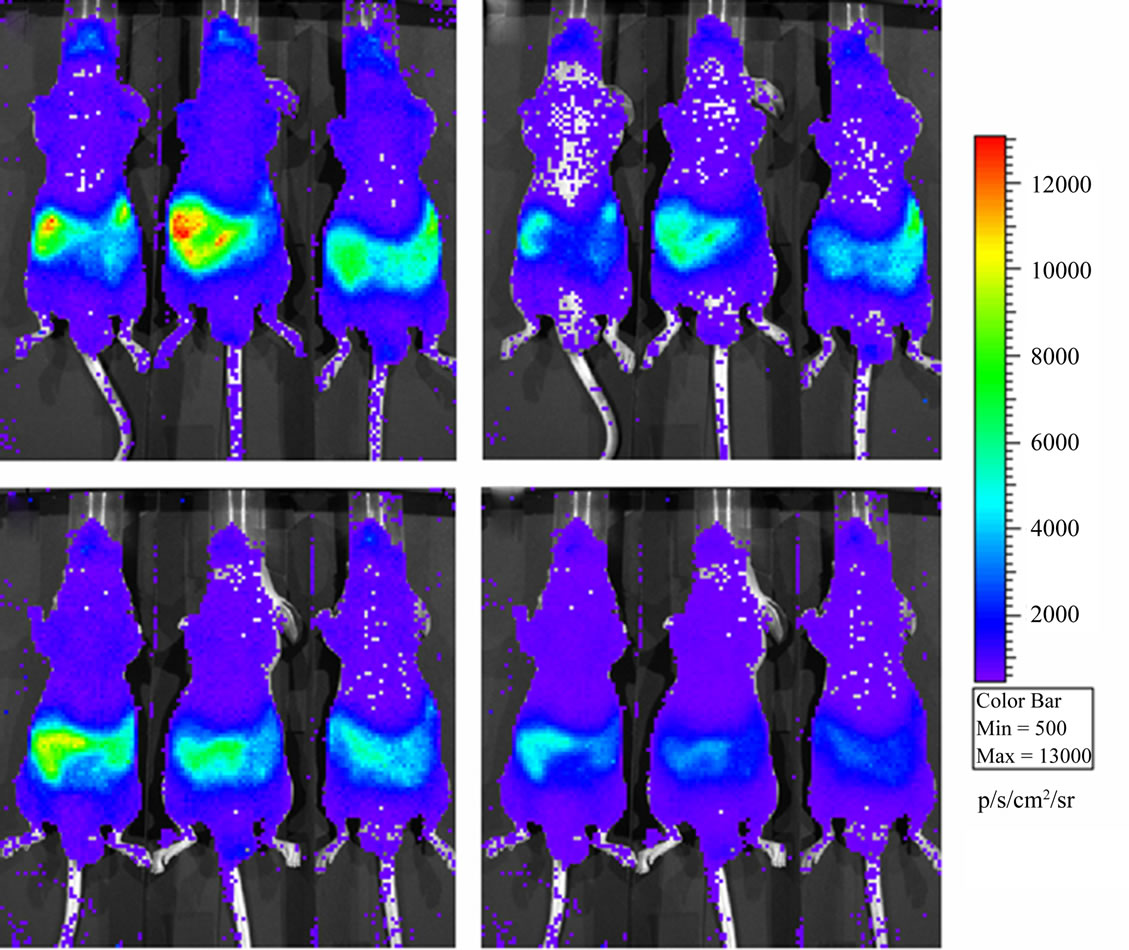
Figure 2. Luminescence background in Nu/Nu mice just after sunshine exposition (panel a) and half an hour later in the dark chamber of the instrument (panel b). Luminescence background in Nu/Nu mice after normal laboratory exposition (panel c) and half an hour later (panel d). Mice are placed in ventral position.
 (a) (b)
Figure 3. Luminescence background time decay (panel a) and spectrum (panel b) in Nu/Nu mice exposed to sunshine and normal laboratory conditions. Total body refers to the entire animal surface except ears, arms and legs. Errorbars represent the Standard Error of the Mean (SEM).
3.2. Imaging of the Pellets of Food
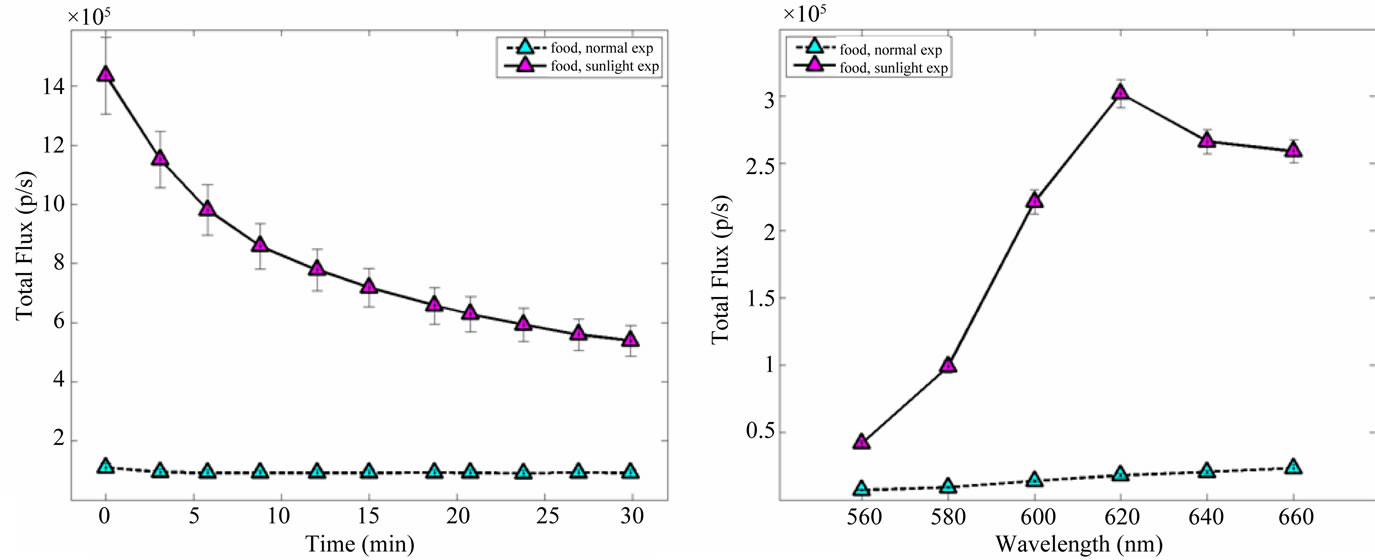
BLI images of the pellets of food shows a generalized emission from the entire surface with some localized spots of light. Moreover BLI images shows an higher light emission from pellets exposed to sunshine with respect to the others (Figure 4). The emissions in both SE and in NE pellets decrease along the time after their introduction in the dark chamber of the instrument. NE pellets’ emission reaches a plateau 5 - 10 minutes after the introduction in the chamber; SE pellets shows a decrease in the emission during all the experimental period and after 30 min the intensity is still higher than the intensity of the NE pellets’ plateau (Figure 5, panel a).
The spectral features of the light emission from pellets are reported in Figure 5, panel b. The emission increases within the wavelength ranging from 560 to 660 nm in both SE and NE pellets.
In order to compare the time decay emission of the light from animals and pellets the measures were normalized to the last time-point at 30 min (Figure 6). Time decay of the light emission from SE mice are comparable to SE pellets; the same occurs to NE mice and NE pellets. The fitting parameters for an exponential decay are reported in Table 1. The half-life for the SE animals and SE pellets luminescence are respectively 25.6 and 22.3 minutes.
Spectral features of the abdominal emission and of pellets of food in SE and NE conditions normalized at 560 nm are reported (Figure 7). The results are compatible with the bluer absorption of the wavelengths travelling in the biological tissues.
4. Discussion
We observed light emission from pellet of food and the abdominal/lumbar region in living animals.
The cause of the light emission in pellets is probably referable to the persistent luminescence. A material shows persistent luminescence when emits—usually in the visible range—for hours after the irradiation (or excitation) source has been switched off. The irradiation source used may be visible light or UV, X-ray, or gamma radiation. Persistent luminescence has been, and still is, unfortunately in a misleading manner, called phosphorescence because of the long emission time. Phosphorescence may be an appropriate term to be used in the context of luminescence from organic compounds involving triplet-tosinglet transitions [18].
The results presented here show a strong correlation between the spontaneous emission in living animals and the food used in the diet. The correlation is supported by the anatomical distribution, the very similar decay time and the spectral features. This suggests that the cause of light emission observed in animals is compatible with food ingested with the diet.
Moreover the persistent emission explains also the higher intensity emission observed both in SE animals and in SE pellets with respect the NE ones. This suggest that the ambient exposure conditions are important before the imaging sessions and this result, to our knowledge, is not reported in literature.
Interestingly we noticed also in other experimental observations (data not reported here) that the animals can present high persistent luminescence after the tail vein incannulation treatment due to the lamps used to illumi-
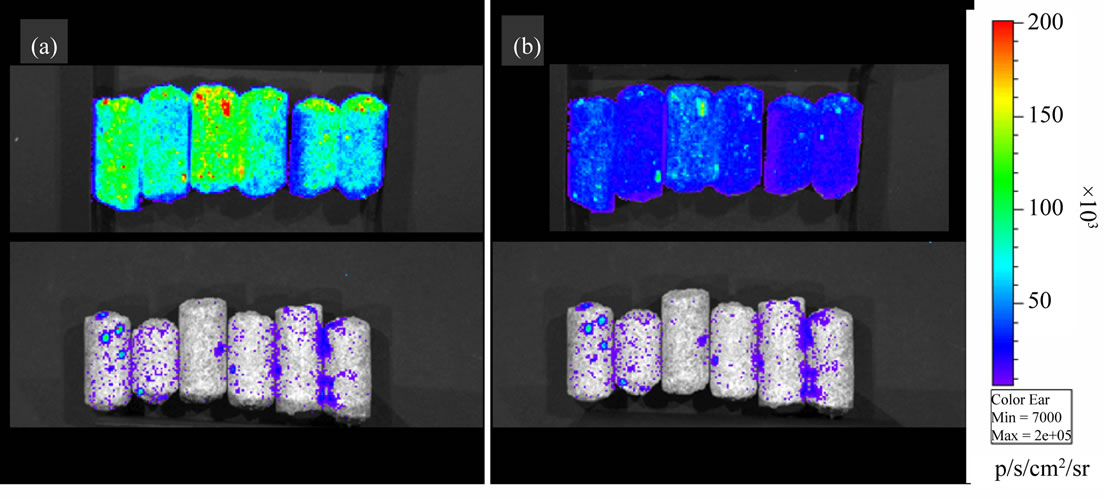
Figure 4. Luminescence emission from pellets of food normally used in animal facilities. Emission after sunshine exposition (panel a, top) and just after normal laboratory exposition (panel a, bottom). Emission from the same pellet half an hour later in the dark chamber of the instrument (panel b).
 (a) (b)
Figure 5. Luminescence background time decay (panel a) and spectrum features (panel b) from pellet of food exposed to sunshine and normal laboratory conditions. Errorbars represent SEM.
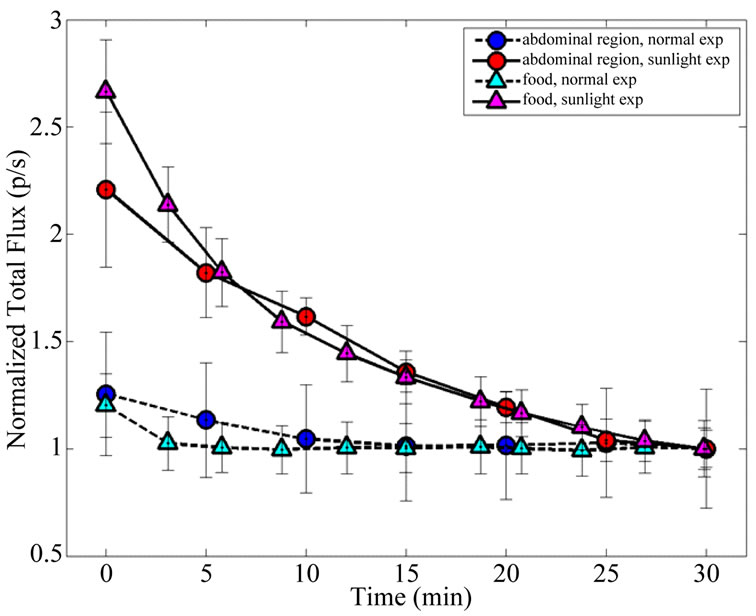
Figure 6. Comparison between animal and pellet emission time decay after sunshine exposure and normal laboratory conditions. Data are normalized at 30 min and the errorbars represent SEM.
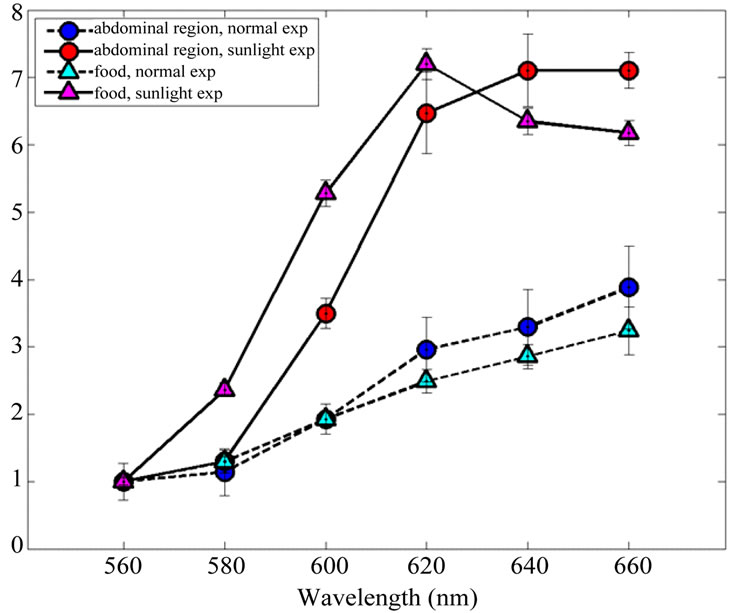
Figure 7. Comparison between animal and pellet emission spectrum after sunshine exposure and normal laboratory conditions. Data are normalized at 560 nm. Errorbars represent SEM.
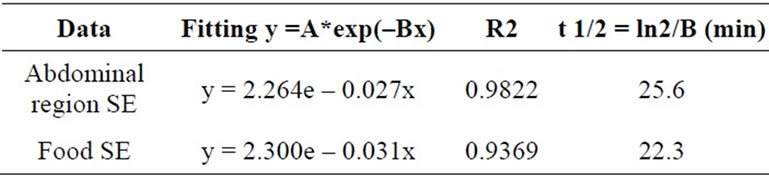
Table 1. Fitting parameters for the luminescence time decay from the abdominal region and pellets of food. Parameters were evaluated at the middle exposure time for each acquisition.
nate the animals. This persistent luminescence is often greater in one side than in the controlateral side accordingly with the position of the lamps during the animal handling.
The light emission from food could vary with the components. We can hypothesize that not only different diets, but also the different percentage of the components of the food, the harvest-time, the time of warehousing can influence the optical properties of the food. At the same time the animal conditions (health, age) and the metabolic activity can alter the background emission. Also chemical reactions in the body can be considered responsible to the light emission [9].
5. Conclusions
In our study we demonstrated the sensitivity of the spontaneous luminescence emission both to the ambient exposure and to the optical properties of food. We demonstrated that the emission is not stable during the time, it is tunable with the external light exposure and it is strongly correlated with the optical properties of the food (persistent emission).
We found that animals exposed to both normal ambient light either sunshine presents a persistent emission ranging from few minutes (in case of normal light) up to half an hour and it persists also after the end of our experimental measures (in case of sunshine exposure).
The background emission in BLI, CLI and RLI images depends on the laboratory exposition and it must be taken into account during the experimental sessions to avoid misleading conclusions.
In summary our results suggest: 1) avoid direct exposure of the animals to sunshine; 2) start the imagine process 10 - 15 min after the positioning of the animals in the dark chamber of the instrument; 3) in any case acquire pre treatment images of the animals; 4) apply an image processing to subtract the “pre treatment” background emission. Moreover we suggest to check the optical properties of the food and administer a diet with minimal persistent emission at least two weeks before the imaging sessions.
6. Acknowledgements
The authors would like to acknowledge the Cariverona Foundation for the financial support.
REFERENCES
- C. H. Contag and B. D. Ross, “It’s Not Just about Anatomy: In Vivo Bioluminescence Imaging as an Eyepiece into Biology,” Journal of Magnetic Resonance Imaging, Vol. 16, No. 4, 2002, pp. 378-387. doi:10.1002/jmri.10178
- H. Song, K. Shahverdi, D. L. Huso, Y. Wang, J. J. Fox, et al., “An Immunotolerant HER-2/neu Transgenic Mouse Model of Metastatic Breast Cancer,” Clinical Cancer Research, Vol. 14, No. 19, 2008, pp. 6116-6124. doi:10.1158/1078-0432.CCR-07-4672
- A. Roda, M. Guardigli, P. Pasini and M. Mirasoli, “Bioluminescence and Chemiluminescence in Drug Screening,” Analytical and Bioanalytical Chemistry, Vol. 377, No. 5, 377, 2003, pp. 826-833. doi:10.1007/s00216-003-2096-6
- E. V. Fomicheva, I. I. Turner, T. G. Edwards, J. Hoff, E. Arden, et al., “Double Oxygen-Sensing Vector System for Robust Hypoxia/Ischemia-Regulated Gene Induction in Cardiac Muscle in Vitro and in Vivo,” Molecular Therapy, Vol. 16, No. 9, 2008, pp. 1594-1601. doi:10.1038/mt.2008.136
- Y. A. Cao, A. J. Wagers, A. Beilhack, J. Dusich, M. H. Bachmann, et al., “Shifting Foci of Hematopoiesis during Reconstitution from Single Stem Cells,” Proceedings of the National Academy of Sciences of USA, Vol. 101, No. 1, 101, 2004, pp. 221-226. doi:10.1073/pnas.2637010100
- S. Ray, R. Paulmurugan, M. R. Patel, B. C. Ahn, L. Wu, et al., “Noninvasive Imaging of Therapeutic Gene Expression Using a Bidirectional Transcriptional Amplification Strategy,” Molecular Therapy, Vol. 16, No. 11, 2008, pp. 1848-1856. doi:10.1038/mt.2008.180
- M. Iyer, F. B. Salazar, X. Lewis, L. Zhang, M. Carey, et al., “Noninvasive Imaging of Enhanced Prostate-Specific Gene Expression Using a Two-Step Transcriptional Amplification-Based Lentivirus Vector,” Molecular Therapy, Vol. 10, No. 3, 2004, pp. 545-552. doi:10.1016/j.ymthe.2004.06.118
- J. B. Kim, K. Urban, E. Cochran, S. Lee, A. Ang, B. Rice, A. Bata, K. Campbell, R. Coffee, A. Gorodinsky, Z. Lu, H. Zhou, T. Kei Kishimoto and P. Lassota, “Non-Invasive Detection of a Small Number of Bioluminescent Cancer Cells in Vivo,” PLoS ONE, Vol. 5, No. 3, 2010, p. e9364. doi:10.1371/journal.pone.0009364
- T. Troy, D. Jekic-McMullen, L. Sambucetti and B. Rice “Quantitative Comparison of the Sensitivity of Detection of Fluorescent and Bioluminescent Reporters in Animal Models”, Molecular Imaging, Vol. 3, No. 1, 2004, pp. 9- 23. doi:10.1162/153535004773861688
- R. Robertson, M. S. Germanos, C. Li, G. S. Mitchell, S. R. Cherry and M. D. Silva, “Optical Imaging of Cerenkov Light Generation from Positron-Emitting Radiotracers,” Physics in Medicine and Biology, Vol. 54, No. 16, 2009, p. N355. doi:10.1088/0031-9155/54/16/N01
- A. E. Spinelli, D. D’Ambrosio, L. Calderan, M. Marengo, A. Sbarbati and F. Boschi, “Cerenkov Radiation Allows in Vivo Optical Imaging of Positron Emitting Radiotracers,” Physics in Medicine and Biology, Vol. 55, No. 2, 2010, pp. 483-495. doi:10.1088/0031-9155/55/2/010
- F. Boschi, L. Calderan, D. D’Ambrosio, M. Marengo, A. Fenzi, R. Calandrino, A. Sbarbati and A. E. Spinelli, “In Vivo 18F-FDG Tumour Uptake Measurements in Small Animals Using Cerenkov Radiation,” European Journal of Nuclear Medicine and Molecular Imaging, Vol. 38, No. 1, 2011, pp. 120-127. doi:10.1007/s00259-010-1630-y
- C. Li, G. S. Mitchell and S. R. Cherry, “Cerenkov Luminescence Tomography for Small-Animal Imaging,” Optics Letters, Vol. 35, No. 7, 35, 2010, pp. 1109-1111. doi:10.1364/OL.35.001109
- Z. Hu, J. Liang, W. Yang, W. Fan, C. Li, X. Ma, X. Chen, X. Ma, X. Li, X. Qu, J. Wang, F. Cao and J. Tian, “Experimental Cerenkov Luminescence Tomography of the Mouse Model with SPECT Imaging Validation,” Optics Express, Vol. 18, No. 24, 2010, pp. 24441-24450. doi:10.1364/OE.18.024441
- A. E. Spinelli, C. Kuo, B. W. Rice, R. Calandrino, P. Marzola, A. Sbarbati and F. Boschi, “Multispectral Cerenkov Luminescence Tomography for Small Animal Optical Imaging,” Optics Express, Vol. 19, No. 13, 2011, pp. 12605-12618. doi:10.1364/OE.19.012605
- F. Boschi, S. Lo Meo, P. L. Rossi, R. Calandrino, A. Sbarbati and A. E. Spinelli, “Optical Imaging of Alpha Emitters: Simulations, Phantom and in Vivo Results,” Journal of Biomedical Optics, Vol. 16, No. 2, 2011, p. 126011. doi:10.1117/1.3663441
- A. E. Spinelli, S. Lo Meo, R. Calandrino, A. Sbarbati and F. Boschi, “Optical Imaging of Tc-99m Based Tracers, in Vitro and in Vivo Results,” Journal of Biomedical Optics, Vol. 16, No. 11, 2011, p. 116023. doi:10.1117/1.3653963
- J. Holsa, “Persisstent Luminescence Beats the Afterglow: 400 Years of Persistent Luminescence,” The Electrochemical Society Interface, 2009. http://www.electrochem.org/dl/interface/wtr/wtr09/wtr09_p042-045.pdf
Appendix A
The feed composition was based on: wheat, maize, wheat middlings, soybean cehulled, extracted toasted mize gluten, soybean oil, calcium carbonate mineral dicalcium phosphate, yeasts, sodium choloride, corn gluten feed, magnesium oxide. Additives (per Kg): E672 Vitamin A 15000 I.U., E671 Vitamin D3 1500 I.U., E1 Fe (ferrous sulphate monohydrate) 50 mg, E5 Mn (manganous sulphate monohydrate) 44 mg, E6 Zn (zinc sulphate monohydrate) 31 mg, E4 Cu (cupric sulphate pentahydrate) 7 mg, E3 Co (basic cobalt carb. monohydrate) 0.5 mg, E2 I (calcium iodate anhydrous) 6.2 mg. Technological additives: E562 Sepiolite 975 mg. Analytical constituents (%): Moisture 12.00, Crude protein 18.50, Crude oils and fats 5.50, Crude fibres 4.50, Crude ash 6.00.
NOTES
*Corresponding author.