Advances in Molecular Imaging
Vol.1 No.3(2011), Article ID:7866,10 pages DOI:10.4236/ami.2011.13005
Molecular Modeling of Chemicals Products Inhibitors of Growth Struvite Crystal
1Laboratory of Naturals Products and Bio Actives, Lasnabio Department of Chemistry, Faculty of Sciences, Aboubakr Belkaid University, Tlemcen, Algeria
2Laboratory of Theoretical Physics Department of Physics, Faculty of Sciences, Aboubakr Belkaid University, Tlemcen, Algeria
3University Center of Relizane, Department of Biology, Relizane, Algeria
E-mail: *s_ghalem2002@yahoo.fr
Received July 25, 2011; revised August 30, 2011; accepted September 7, 2011
Keywords: Inhibitors, struvite, Modeling, interactions, Docking, MM, DM
Abstract
Struvite (MgNH4PO46H2O) crystals were produced by infection associated with urea generating organisms.The aim of this study is to examine the interactions between the enzyme urease and two inhibitors, the first is an inhibitor monoatomic: Aluminum and the second is a polyatomic: Citrate by the methods of molecular modeling: molecular mechanics, molecular dynamics (MM+, AMBER) and molecular docking (FleX). Supersaturated solutions induce crystallization by nucleation and subsequent crystal growth .The mechanisms for the formation of calcium phosphate urinary stones are still not understood. Chemicals product has been studied extensively as inhibitors and has been observed in the attachment of crystals to in vitro study. As a complement we have using an electron microscope Hitachi TM1000, we examined specimens of crystals struvite. The various figures show a set of grains of sizes of the order of 20 µm. The majority of these particles present regular forms. This suggests the crystal growing. This result to an alteration in the expression of these faces and the development of a characteristic architectural struvite morphology. Similar changes were observed in the presence of identical concentrations of citrate acid, and Alluminuium, emphasizing the unique interaction of phosphocitrate with the struvite crystal.
1. Introduction
Infection lithiasis are composed primarily of magnesium ammonium phosphate hexahydrate (MgNH4PO46H2O) but may, in addition, contain calcium phosphate in the form of carbonate apatite (Ca10[PO4]6CO3) [1,2]. Infection of the urinary tract with urease-producing organisms is required for the formation of infection stones in humans. Although the species Enterobacteriaceae comprises the majority of urease-producing pathogens, a variety of grampositive and gramnegative bacteria and some yeasts and mycoplasma species have the capacity to synthesize urease [3]. An elevated urinary pH reduces the solubility of magnesium ammonium phosphate and favors precipitation of Struvite crystals. Higher intake of phosphate (from Proteins) and magnesium based food and lower intake of water gives rise to the PO4 3-and Mg2+ ions in the supersaturated urine, which leads to the conditions of formation of Struvite [4]. Probably, the negative charged points of the external side of the cellular structures could reduce the metastability field of struvite and calcite, acting as heterogeneous nuclei of crystallization [5]. For example, during digestion, are enzymes that accelerate the decomposition and food processing. An enzyme catalyzes only one reaction in general, because it is able to bind efficiently than a single substrate. This specificity results from the fact that when two molecules meet, their association may be stabilized by the establishment of a large number of weak bonds (hydrogen bonding, ionic bonding, Van Der Waals forces) these bonds are about 100 times weaker than a covalent bond. Modeling and simulation of struvite growth, incorporating solution chemistry and thermodynamics, growth kinetic and process description of the recovery system. An ensemble of experimental data is combined with the dynamic model to estimate struvite growth kinetics [6].
The active site in catalysis refers to the portion of the catalyst that will interact with (s) substrate (s) to form (s) product (s). The function of enzymes is related to the presence within their structure of a specific site called the active site which has the shape of a cavity or a groove. The molecules on which an enzyme acts are defined as substrates of the enzymatic reaction. Each enzyme “recognizes” one or more specific substrate molecules as a principle of complementarily-type lock and key.
An inhibitor is a compound (usually a molecule) whose action is to inhibit (that is to say slow down or stop) a chemical reaction, that is to say that he acts more or less on the speed of reaction (kinetic factor). Can be described as opposite of a catalyst. The study of the effect of inhibitor can:
• To refine the catalytic mechanism of an enzymatic reaction• To learn more about the specificity of the enzyme• To obtain physical and chemical data about the activew site.
Urease (discovered in 1876 by Musculus) is an enzyme that catalyzes the conversion of urea into carbon dioxide and ammonia according to the following: Scheme 1.
The enzymatic reaction of urea hydrolysis Heat CO(NH2)2 + H2O → 2NH3 + CO2
Urea Water Ammonia Carbon dioxide
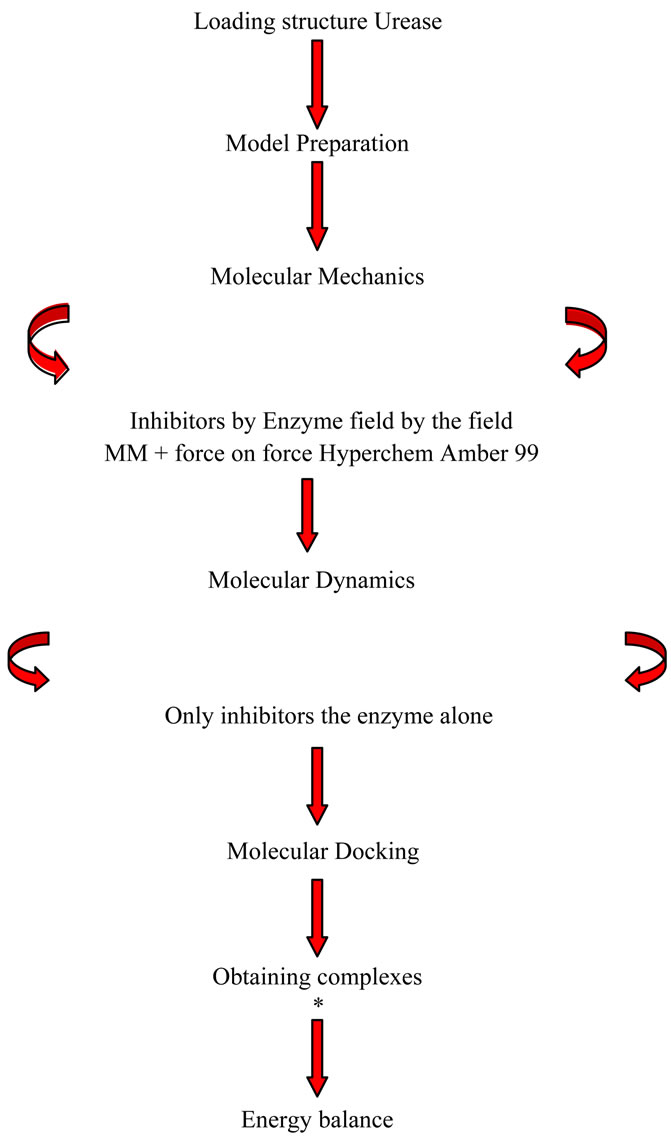
1.1. Approach
1) Download the structure of Urease from a database 2) Preparing the model 3) Molecular Mechanics
• inhibitors by the force field MM+
• the enzyme by the Amber force field 99 4) Molecular Dynamics
Scheme 1. Structure of Urease.
• single enzyme
• inhibitors alone 5) Molecular Docking
• obtaining complexes
• energy balance
1.2. Results and Discussion
1) Preparing the model Downloading urease was made from the database Brookhaven Protein Data Bank-PDB-(passcode 1UBP) is co-crystallized with the inhibitor beta-mercaptoethanol. The three dimensional structure of urease was obtained by X-ray diffraction with a resolution 1.65 Å.
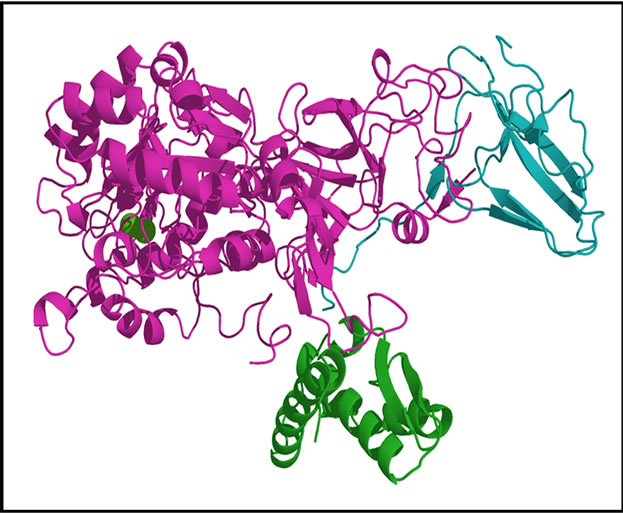
Note that urease crystallized as a trimer (Figure 1), each monomer consists of 6041 atoms and more than 25 heteroatoms inhibitor. Is formed of three chains A, B and C.
2) Classification: Hydrolase Weight of the structure: 86,655.36 It has simplified model of the enzyme by removing water molecules and the two chains B and C that is to
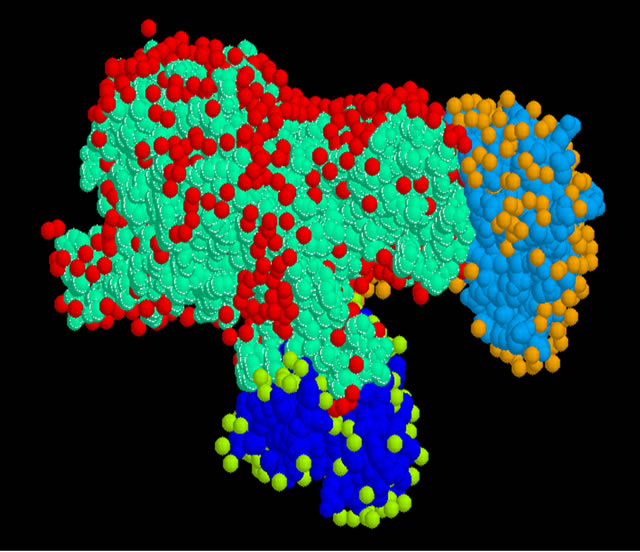
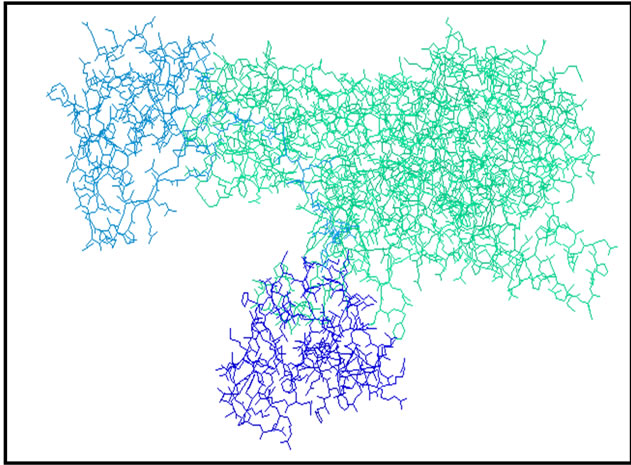
Figure 1. The shape of the trimer Urease.
say we caught a monomer (Figure 2), this chain has the amino acids forming the active site.
3) Note: When the hydrolysis is complete, a molecule of urea (i.e. 60 g) generates two molecules of ammonia (i.e. 34 g). 5 kg of urea can then produce 2.83 kg of ammonia a) The hydrolysis of urea by urease liberates ammonia which alkalinized the middle and turned the red indicator from yellow to red.
b) Urease is an enzyme that is present in many plants and soil. It catalyzes the hydrolysis of urea into ammonium ion and carbamate, which decomposes into carbon dioxide and ammonia.
c) The active site (Scheme 2) contains two atoms of nickel (II) are linked by a carbamate bridge, in addition, two imidazole nitrogen atoms are bound to each nickel atom and a carboxylate group and a water molecule.
d) Urea is a colorless crystalline compound, the product of excretion of ammonia from the degradation of proteins in living things. Urea, also known as carbonic diamide, has the formula H2N-CO-NH2 (Scheme 3, Figure 2).
1.3. Purpose
This work is to study the interactions between the enzyme urease and two inhibitors, the first is an inhibitor monoatomic: Aluminum and the second inhibitor is a polyatomic: Citrate by the methods of molecular modeling:
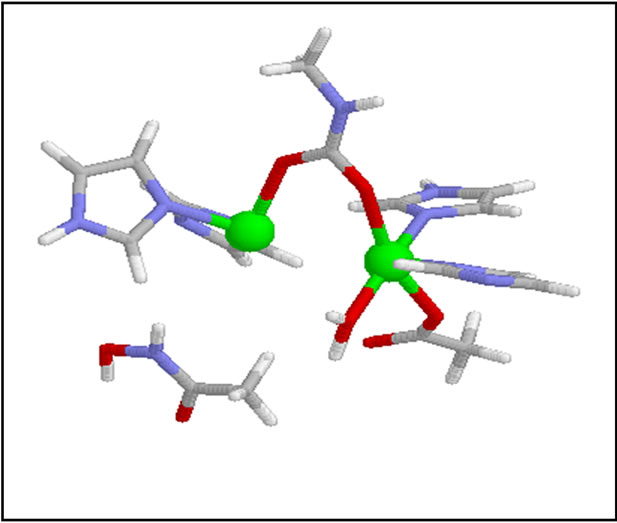
Scheme 2. Active site of Urease.

Scheme 3. Structure of Urea.
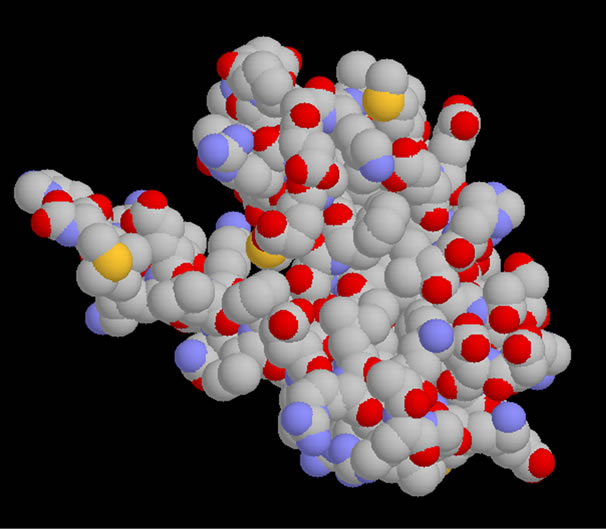
Figure 2. The simplified model of Urease.
molecular mechanics, molecular dynamics and molecular docking.
2. The Approach
3. Results and Discussion
3.1. Preparing the Model
• Downloading urease was made from the database Brookhaven Protein Data Bank-PDB-(passcode 1UBP) is co-crystallized with the inhibitor beta-mercaptoethanol. The three dimensional structure of urease was obtained by X-ray diffraction with a resolution 1.65 Å.
• Note that urease crystallized as a trimer (Figure 1), each monomer consists of 6041 atoms and more than 25 heteroatoms inhibitor is formed of three chains A, B and C Classification: Hydrolase Weight of the structure: 86,655.36.
• It has simplified model of the enzyme by removing water molecules and the two chains B and C that is to say we caught a monomer (Figure 2), this chain has the amino acids forming the active site.
3.2. Preparation of Inhibitors
Inhibitors used in this work are:
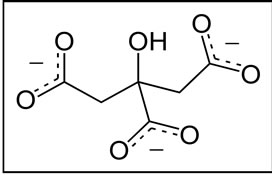
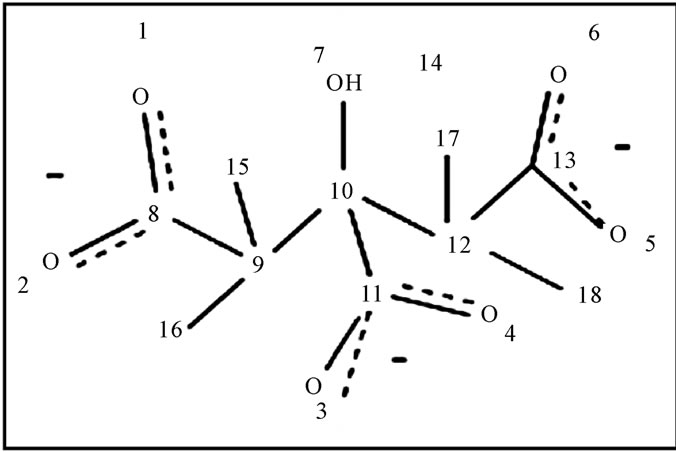
A: An inhibitor monoatomic: Aluminum Scheme 4 B: An inhibitor polyatomic: Citrate Scheme 5 We note that the structures of inhibitors have your donor groups as free electron pairs which will foster interactions with active site amino acids (Aluminium door and a lone pair of electron pairs Citrate is free.
3.3. Minimization of Energy
The energy minimization is done in order to optimize a structure, that is to say, to eliminate all unfavourable steric interactions (remove bad contacts) and thus we obtain a starting model close to the structure real.
3.3.1. Optimization of Urease
The geometry optimization of urease was carried out
Scheme 4. Monoatomic inhibitor: Aluminum.
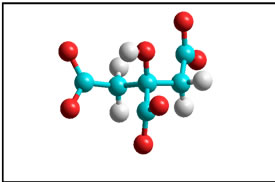
Scheme 5. Polyatomic inhibitor: Citrate.
using the Amber force field 99 implemented in software Hyperchem 7.5.
First we use the steepest descent method with a gradient of 0.01 and a maximum of 23,655 cycles, with this method the convergence is not reached then we spent the gradient Fleetcher Reeves with the same options, even with this gradient is no has no convergence Revenue Is So we go to the gradient Polak Ribiere Optimizer and after 1093 cycles are reached convergence.
The value of energy optimization is: EOPT = –4749.05 kcal/mol.
3.3.2. Leveraging Inhibitors
Using the force field MM + 7.5 is made on Hyperchem optimization polyatomic inhibitor (citrate).
Note: The inhibitor monoatomic (Al) does not need an optimization since it is an atom (there is no connection so there is no energy).
In Table 1 classify the different results for the optimization of Citrate.
3.3.3. Calculation of Charges of Polyatomic Inhibitor
For further analysis we did a load calculation for citrate to give each atom a partial charge-mail, for that and after optimization using the AM1 method to calculate Hyperchem on various charges on each atom, the results are shown in Table 2.
3.4. Molecular Dynamics
Molecular dynamics attempts to simulate the motion of atoms and molecules over time to a temperature above 0 K. It is to study the trajectory of a molecule by applying the laws of classical Newtonian mechanics and simulates the intramolecular motions that can then view real-time.
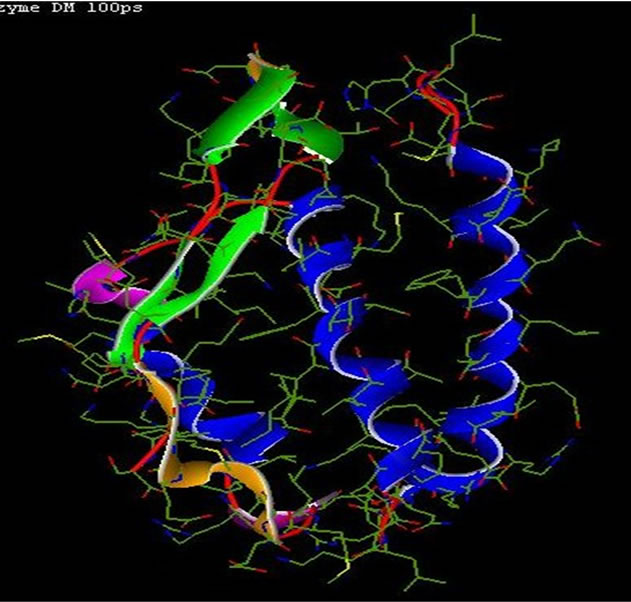
3.4.1. Dynamics of Urease
From the optimized enzyme as starting model we will make a two-step molecular dynamics:
1) Heating: Heated system (enzyme) with a starting temperature 0 K to 300 K for 10 ps with a 1 fs integration step for 100 steps.
2) Production or DM: At 300 K there is an equilibration, the velocities are adjusted to keep the temperature constant (there is an exchange between kinetic energy and potential energy). Then there is production of conformation. The simulation time is 80 ps of MD (Figure 3).
3.4.2. Molecular Dynamics Inhibitors
The molecular dynamics inhibitors are showing in the following figures: Figure 4, Figure 5 and Figure 6" target="_self"> Figure 6.

Table 1. Results USING force field MM + 7.5 on Hyperchem.
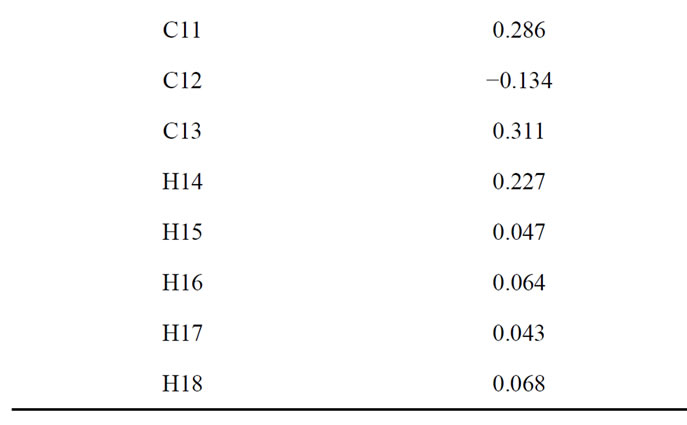
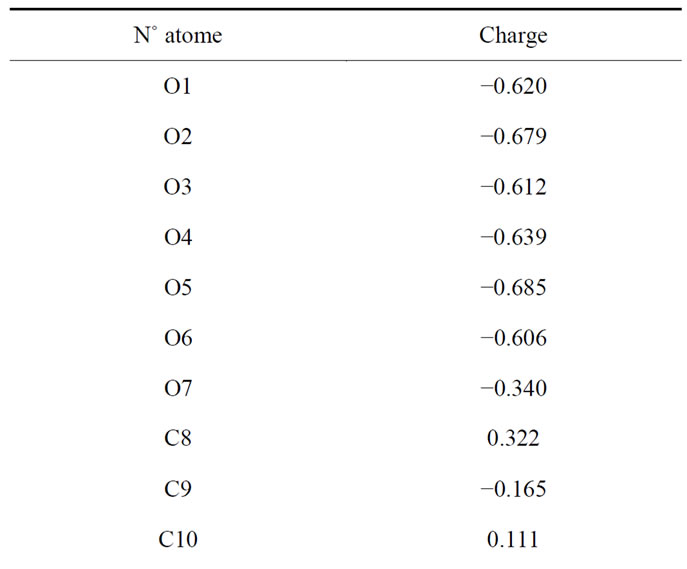
Table 2. Atomic charges citrate.
Note: The aluminum does not load.
3.5. Molecular Docking
The docking is to predict the structure of a complex formed by two molecules, the formation of these com-
1 UBP
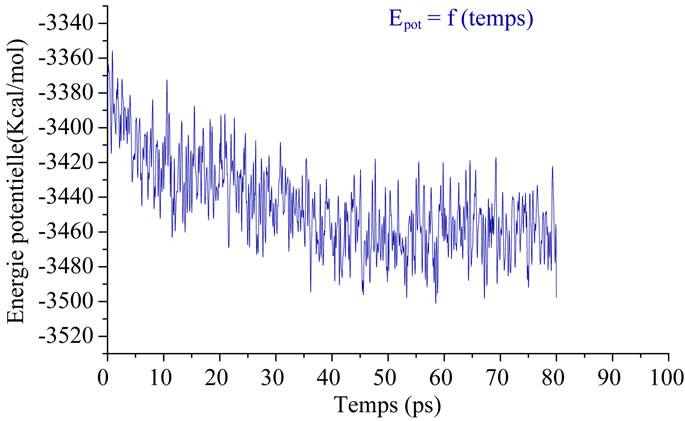
Figure 3. Change in potential energy only 1UBP Function of time.
plexes is based on the recognition of three-dimensional structure of a ligand by a receptor site and controls the activity of many molecules.
The docking is to determine the mode of interaction of a complex of two or more molecules, seeking directions in space and conformations favorable for ligand binding to a receptor .
The next step is the positioning of the inhibitors into the active site of urease (training complex). And to realize the molecular docking software was used Hex 6.1.
3.6. Molecular Dynamics of Complex
There is formation of two complexes, figures 7 and 8
Figure 4. Structure of Inhib .1 (Aluminum).
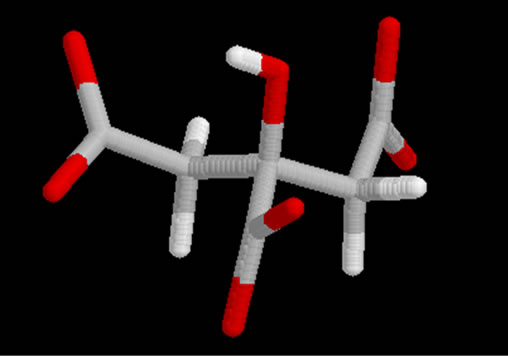
Figure 5. Structure Inhib .2 (Citrate).
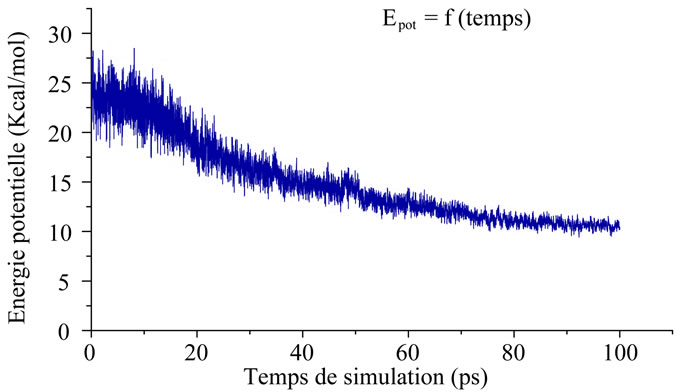
Figure 6. Variation of potential energy of the inhibited citrate only with time.
represent the two complexes.
For both complexes were found following energies:
Complex 1UBP-Al: ET = −74.5 kcal/mol Al Complex 1UBP: ET = −74.5 kcal/mol
4. Experimental
We chose the classical model for the study of phosphate crystallization because of its simplicity and satisfactory reproducibility. This model includes the study of crystallization without inhibitor and with it, in order to assess
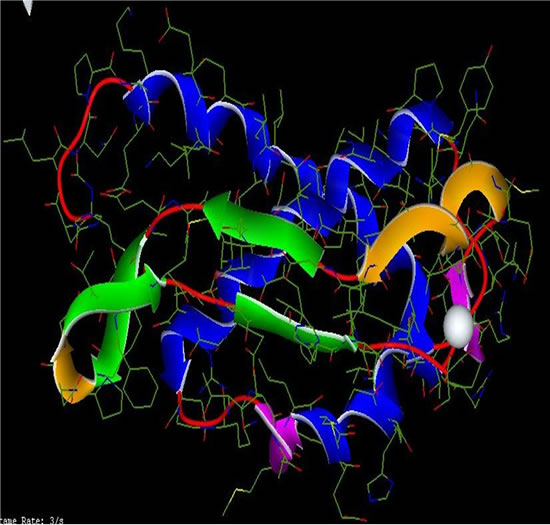
Figure 7. Complex 1UBP-Aluminum.
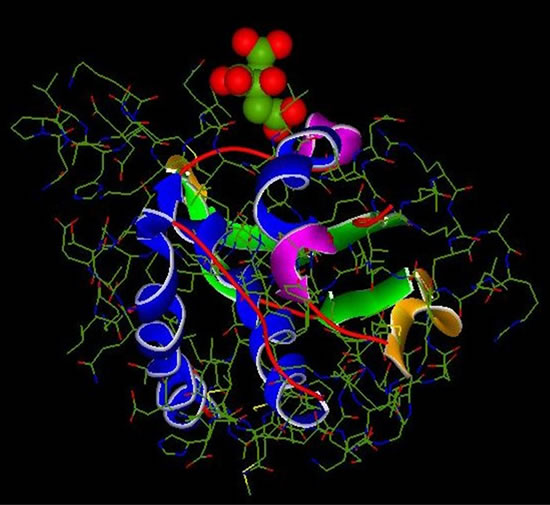
Figure 8. Complex 1UBP-Citrate.
the inhibiting capacity of any chemical species used. Two solutions of following composition were mixed: A: 11.02 g/l Na2SO4·10H2O, 1.46 g/l MgSO4·7H2O, 4.64 g/l NH4Cl, 12.13 g/l KCl et 0.24 g/l Ca2+ and B: 2.65 g/l NaH2PO4·2H2O, 18.82 g/l Na2HPO4·12H2O, 13.05 g/l NaCl, 1 g/l Na3C6H5O7.2H2O et 0.05 g/l . The solution in
  is prepared from oxalic acid 0.05 g. The precipitation of the solid phase of phosphates from artificial urine at different initial pH values (pH = 6.5; 7 and 8) was the object of our investigation. Artificial urine is prepared by mixing and stirring two equal volumes of 50 ml of solutions A and B at constant temperature (37˚C) in capped vessels to give final artificial urine at pH = 7. The pH of solution B was adjusted to required value by adding either HCl or NaOH as appropriate. Mixture agitation was maintained to prevent sedimentation. The crystal size development was monitored by polarized microscopy at different time intervals by proceeding as follows: Sample drops were examined every five minutes by polarising optical microscopy. Crystals were identified with ×40 magnifying lens. After crystallization time, the mixture was filtered, the recovered dried precipitates were analysed by FTIR spectroscopy. Calculation of the percentage of Inhibition (1%) was based on the formula: (Hennquine, 1993).
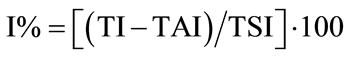
TI—represents the number of crystal phosphate crystals without inhibitor.
TAI—represents the number of crystal phosphate after addition of inhibitor. We applied the previous protocol, which was to study the inhibition of phosphate by products chemicals such as citric acid, Alluminium at different pH.
Citric acid is a tricarboxylic acid of molecular weight of 192 Da. Multiple studies have shown that citrate reduces the crystallization of calcium salts in vitro [7,8]. This effect is mainly due to the complication of calcium citrate, which lowers the amount of calcium available to react with ions or oxalates phosphates. This results in a decrease in urinary supersaturation of calcium oxalate. Furthermore, recent studies have shown that citrate acts as an inhibitor also the calcium oxalate, as it is capable, at least in vitro, to bind to the crystal surface, d 'reduce the size and shape change [9,10].
The isocitrate is an isomer of citrate, in small amounts excreted in urine. In a model of crystallization of calcium oxalate in vitro at 37˚C with no seeding, and Daudon M. Hennequin C. [10] found that isocitrate, 10 - 3 Mol/L, is able to inhibit 42% of the crystal growth ´ concentration 0.25 of calcium oxalate. Such as citrate, isocitrate acts through its ability to complex the calcium ion and also by interaction with the surface of calcium crystals. This effect is proportionally greater than that observed with citrate.
4.1. Inhibition in the Presence of Citrate Ion
4.1.1. Study of the Inhibitor Citrate Ion at pH = 6.5
The results of monitoring changes in the size of brushite crystals by polarized light optical microscope, at pH 6.5 and in the presence of citrate as an inhibitor, are presented as following Figure 9.
We find that inhibition of brushite is the total concentration of 6 mmol/l citrate. The FTIR spectrum confirms this inhibition in the presence of citrate solution at pH = 6.5 (Figure 10).
4.1.2. Study of the Inhibitor Citrate Ion at pH = 8
The results of monitoring changes in the size of struvite crystals by optical microscope, at pH 8 and in the presence of citrate as an inhibitor, are mentioned in the following graph: Figure 11.
Citrate appears to be a good inhibitor of low molecular
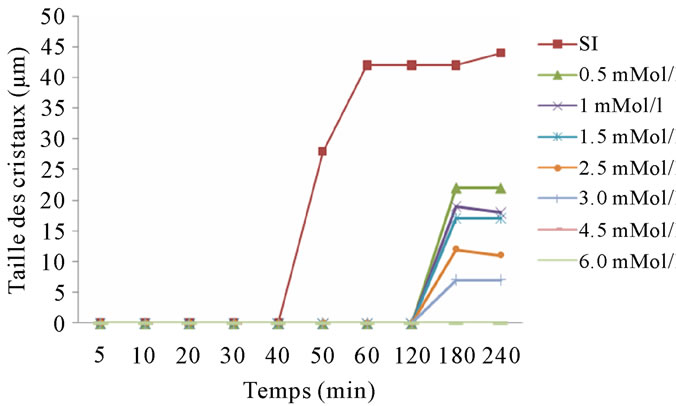
Figure 9. Evolution of the brushite crystal size over time and in the presence of citrate at pH 6.5.
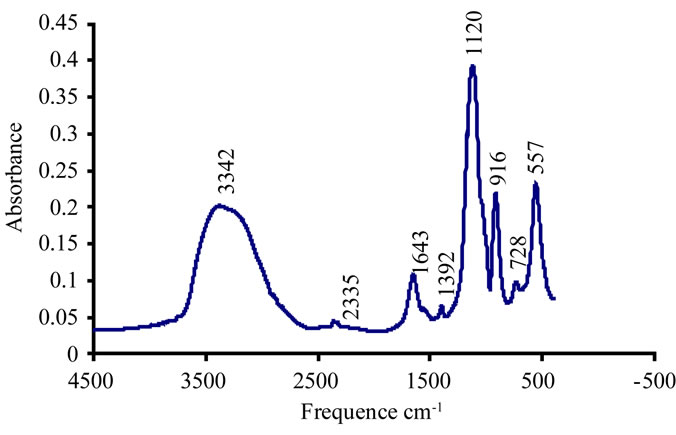
Figure 10. Citrate solution (4.5 mmol/l) at pH 6.5.
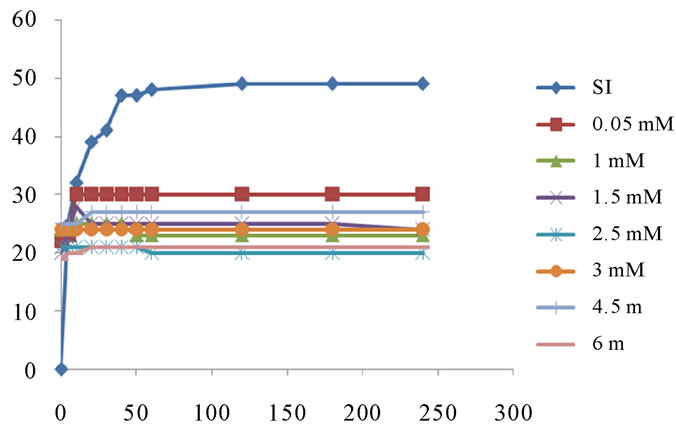
Figure 11. Evolution of crystal size versus time in the presence of citrate, pH = 8.
weight. Its effect is enhanced with increasing pH. It is more effective than acid in the urine alkaline urine and exerts an inhibitory effect on the most important calcium phosphates as calcium oxalate. Citrate ions are able to significantly reduce struvite crystallization in vitro.
4.2. Inhibition in the Presence of Aluminium Ion
We tested the inhibitory effect of aluminum (III) in the same conditions as the previous experiments. The experiments were conducted at 37˚C in solutions with a range of concentrations ranging from 0.01 mmol/l to 0.1 mmol/l.
4.2.1. Study of the Inhibitor Al (III) at pH = 6.5
The results of monitoring changes in the size of brushite crystals by optical microscope in the presence of aluminium as an inhibitor and pH = 6.5 are presented in following graph: Figure 12.
Inhibition of growth and aggregation of brushite in the presence of aluminium is remarkable. It is significant even for lower concentrations. This reflects the strong effect of aluminium on the phases of the formation of brushite at pH 6.5, which is in perfect agreement with historical data. Indeed, the latter show that Al (III) acts much more on calcium phosphates, especially on the nucleation and crystal growth [11].
The FTIR spectrum confirm the total inhibition of the brushite at a concentration of 0.01 aluminium mMmol / l. Figure 13.
4.2.2. Study of the Inhibitor Al (III) at pH = 8
Monitoring the changes in the size of struvite crystals by optical microscope in the presence of alluminum at pH = 8, the following results: Figure 14.
The FTIR spectrum shows that after the addition of an aluminum concentration of 0.05 mmol/l and pH= 8, the frequency bands confirm the presence of struvite and disappearance of those characterizing the carbapatite Figure 15.
Inhibition of the crystallization of brushite is remarkable in the presence of alluminum for all concentrations, or for growth and for crystal aggregation at different pH. The results are in perfect agreement with those in the literature that mentions the formation of complexes between metal ions Al (III) and citrate ions present in the crystallization solution. The metal complexes resulting from this association strongly inhibit the growth of crys-
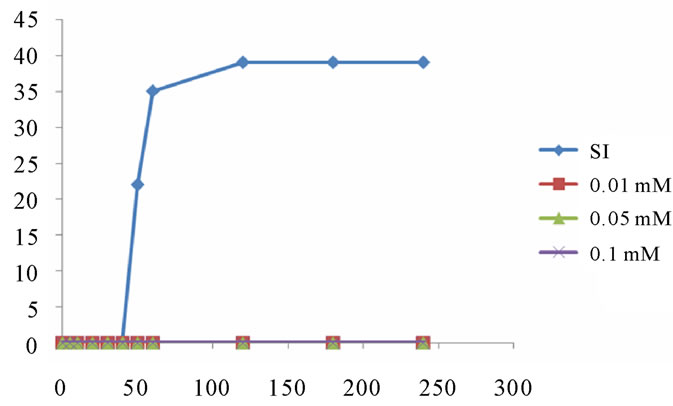
Figure 12. Evolution of the brushite crystal size versus time and in the presence of Al (III) at pH 6.5.
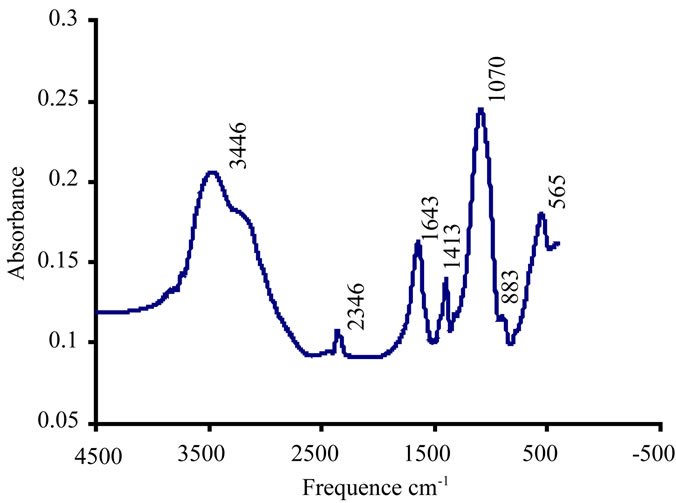
Figure 13. Aluminium (III) to 0.01 mmol/l at pH 6.5.
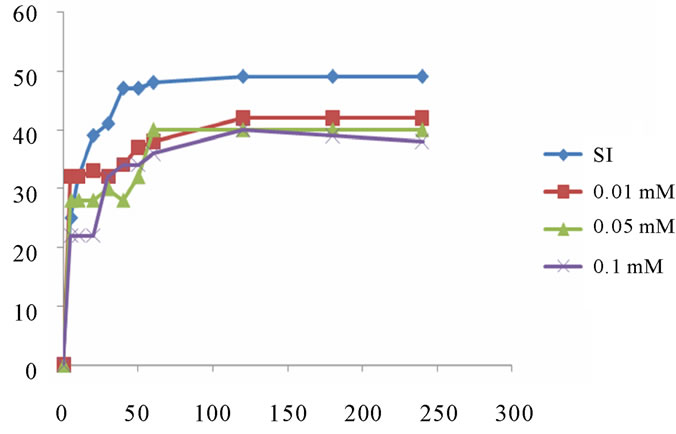
Figure 14. Evolution of the size of struvite crystals over time at pH = 8.
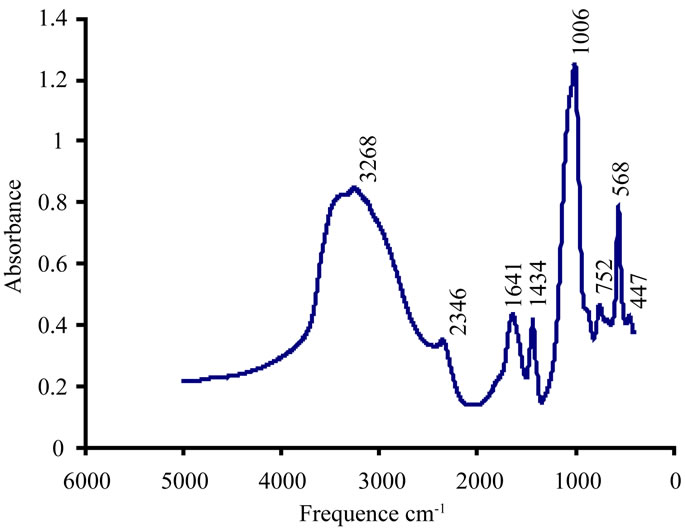
Figure 15. Solution of Al (III) 0.7 mmol/l at pH = 8.
tals of calcium phosphate in vitro [11].
5. Conclusions
The inhibition obtained with aluminium is complete at low concentrations (Scheme 6). This result, proved by the absence of crystals detected by optical microscope in polarized light, is important. It confirms the inhibitory effect of the solution of aluminum at a concentration of 0.1 mmol/l on the brushite nucleation, in agreement with the results of the bibliography. Ions Al (III) exert their action directly on the crystals blocking the growth sites located on their surface and prevent their dissolution process, when present in low concentrations Scheme 7.
The effect of citrate on the brushite is important to pH
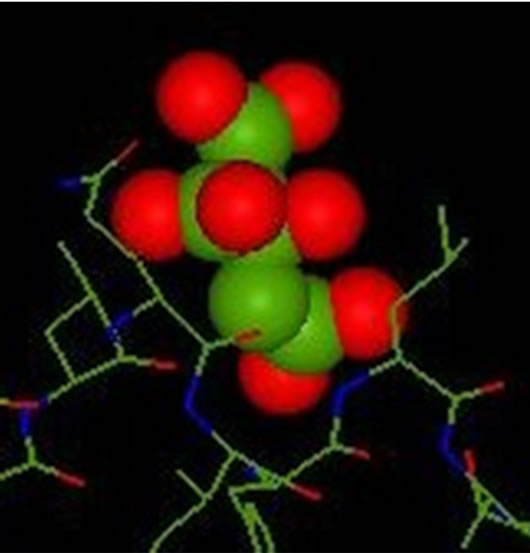
Scheme 6. The inhibitor is found in the receiver of the enzyme after complex formation 1UBP-Citrate.

Scheme 7. The inhibitor is found in the receiver of the enzyme after formation of complex Al-1UBP.
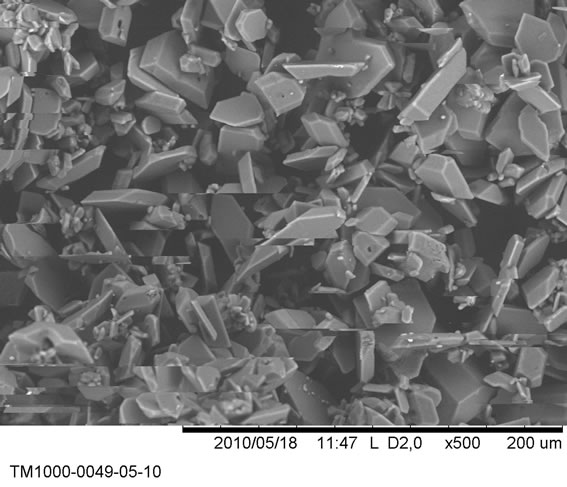
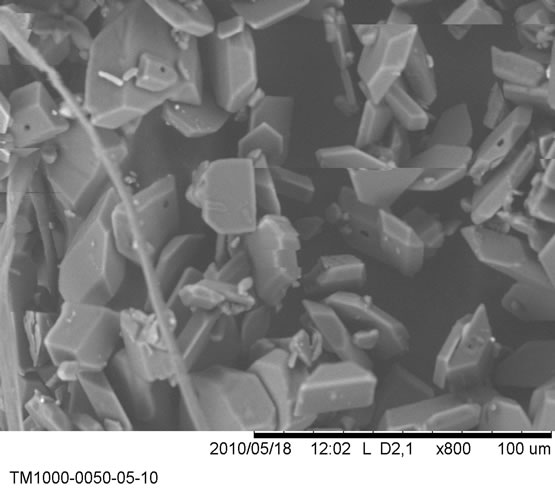
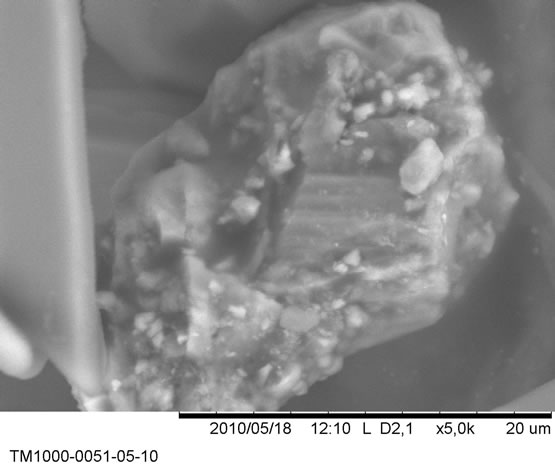
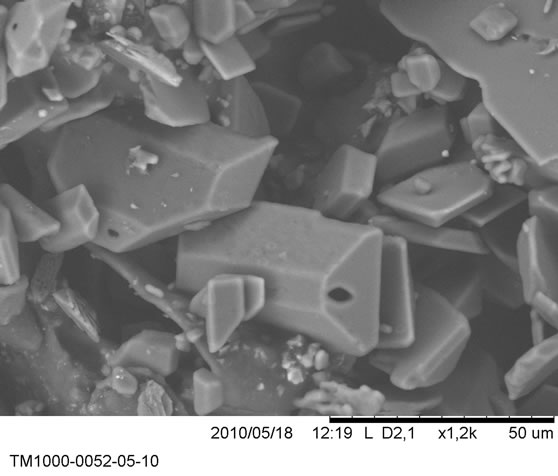
Figure 16. The various figures show a set of grains of sizes of the order of 20 µm.
6.5. We obtain the complete disappearance of the brushite crystals in a solution of citrate 3 mmol/l. but, its effect on struvite is lower at pH 8.
Comparing the two complexes formed (their energy), we can say that the complex polyatomic inhibitor is more stable than the complex of the inhibitor because the interactions between the inhibitor polyatomic (Citrate) which comprises several pairs donors (electron pairs) and receiver (active site) of the enzyme is much more than the monatomic inhibitor (Al) which is one lone pair.
Using an electron microscope Hitachi TM1000, we examined specimens of a renal lithiasis. The various figures show a set of grains of sizes of the order of 20 µm.
The majority of these particles present regular forms. This suggests the crystal growing.
Frequently a certain number of differently directed crystalline grains from to each other and joined to the interface by grain boundaries.
Qualitatively, we can say that the crystals present an axis of rotation of order 2, from where the possibility that crystals belong to the monoclinic system.
Certain crystals of size 20 µm are in the center of a concretion which seems of amorphous structure on all the scales and the crucial role of which is to stop the growth of the initial crystal (Figure 16).
6. References
[1] D. P. Griffith, “Struvite Stones,” Kidney International, Vol. 13, 1978, p. 372. doi:10.1038/ki.1978.55
[2] D. P. Griffith and C. A. Osborne, “Infection (Urease) Stones,” Mineral and Electrolyte Metabolism, Vol. 13, No. 4, 1987, pp. 278-285.
[3] M. J. Gleeson, K. Kobashi and D. P. Griffith, “Noncalcium Nephrolithiasis. Disorders of Bone and Mineral Metabolism,” F. I. Coe and M. J. Favus, Eds., Raven, New York, 1992, p. 801.
[4] C. K. Chauhan, M. J. Joshi and A. D. B. Vaidya, 2008. “Growth Inhibition of Struvite Crystals in the Presence of Herbal Extract Commiphora Wightii,” Journal of Materials Science: Materials in Medicine, Vol. 20, Supplement 1, pp. 85-92. doi:10.1007/s10856-008-3489-z
[5] M. T. González-Muñoz, N. B. Omar, M. MartínezCañamero, M. Rodríguez-Gallego, A. L. Galindo and J. Arias, “Struvite and Calcite Crystallization Induced by Cellular Membranes of Myxococcus Xanthus,” Journal of Crystal Growth, Vol. 163, No. 4, 1996, pp. 434-439. doi:10.1016/0022-0248(95)01011-4
[6] Md. I. Ali and P. A. Schneider, “An Approach of Estimating Struvite Growth Kinetic Incorporating Thermodynamic and Solution Chemistry, Kinetic and Process Description,” Chemical Engineering Science, Vol. 63, No. 13, 2008, pp. 3514-3525. doi:10.1016/j.ces.2008.04.023
[7] H. G. Rushton and M. Spector, “Effect of Magnesium Deficiency on Intrabular Calcium Oxalate Formation and Cristalluria in Hyperoxaluric Rats,” Journal of Urology, Vol. 127, No. 3, 1982, pp. 598-604.
[8] S. Bisaz, R. Felix and W. F. Nelman, “Fleesch Quantitative Determination of Inhibitors of Calcium Phosphate Precipitation in Whole Urine,” Néphrologie, Vol. 5, No. 2, 1984, pp. 175-179.
[9] F. Grases, O. Sôhnel, A. I. Vilacamp and J. G. March, “Phosphates Precipitating from Artificial Urine and Fine Structure of Phosphate Renal Calculi,” International Journal of Clinical Chimistry, Vol. 244, No. 1, 1996, pp. 45-67. doi:10.1016/0009-8981(95)06179-7
[10] A. Bigi, G. Falini, E. Foresti, M. Gazzano, A. Ripamonti and N. Roveri, “Magnesium Influence on Hydroxy-Apatite Crystallization,” Journal of Inorganic Biochemistry, Vol. 49, No. 1, 1993, pp. 69-78. doi:10.1016/0162-0134(93)80049-F
[11] J. L. Meyer and W. C. Thomas Jr., “Trace Metal-Citric Acid Complexe as Inhibitors of Calcification and Crystal Growth. I-Effects of Fe(III), Cr(III) and Al(III) Complexes on Calcium Phosphate Crystal Growth,” Journal of Urology, Vol. 128, No. 6, 1982, pp. 1376-1378.