Journal of Behavioral and Brain Science
Vol.3 No.5(2013), Article ID:36383,8 pages DOI:10.4236/jbbs.2013.35039
The Neuroprotective Effect of Picroside II and Its Best Therapeutic Dose and Time Window in Cerebral Ischemic Injury in Rats
Institute of Cerebrovascular Diseases, Affiliated Hospital of Qingdao University Medical College, Qingdao, China
Email: zhaoliqd2012@163.com, lixiaodanqd@163.com, *guoqdsd@163.com, cccqy1@163.com, pff0824@163.com
Copyright © 2013 Li Zhao et al. This is an open access article distributed under the Creative Commons Attribution License, which permits unrestricted use, distribution, and reproduction in any medium, provided the original work is properly cited.
Received June 26, 2013; revised July 27, 2013; accepted August 6, 2013
Keywords: Picroside II; Therapeutic Dose; Time Window; Cerebral Ischemia; NSE; S100B; MBP; Rats
ABSTRACT
Objective: To study the neuroprotective effect of picrosede II and explore the best therapeutic dose and time window according to orthogonal design in cerebral ischemic injury in rats. Methods: The forebrain ischemia rat models were established by bilateral common carotid artery occlusion (BCCAO) method. The successful models were randomly grouped according to orthogonal experimental design and treated by injecting picroside II intraperitoneally at different ischemic time with different doses. The contents of neuron-specific enolase (NSE), neuroglial marker protein S100B and myelin basic protein (MBP) in serum and brain tissue were determined by enzyme linked immunosorbent assay (ELISA) to evaluate the therapeutic effect of picroside II in cerebral ischemic injury. Results: The best therapeutic time window and dose of picroside II in cerebral ischemic injury may be 1) ischemia 1.5 h with 20 mg/kg and ischemia 1.5 h with 10 mg/kg body weight according to the content of NSE in serum and brain tissue respectively, 2) ischemia 1.5 h with 20 mg/kg according to the content of S100B in both serum and brain tissue, and 3) ischemia 1.5 h with 20 mg/kg and ischemia 1.5 h with 10 mg/kg according to the content of MBP in serum and brain tissue respectively. Conclusion: Based on the principle of the minimization of therapeutic drug dose and maximization of therapeutic time window, the optimal composition of the therapeutic dose and time window of picroside II in treating cerebral ischemic injury should be achieved by injecting picroside II intraperitoneally with 10 - 20 mg/kg body weight at ischemia 1.5 h in cerebral ischemic injury in rats.
1. Introduction
Neuronspecific enolase (NSE) occupies 40% - 65% of enolase in the cortex [1] and exists specifically in neurons and neural endocrine cells to form the membrane structure and repair nerve cell [2]. Recent studies proved that the concentration of NSE in cerebrospinal fluid reached a peak at cerebral ischemia 3 days and related positively to the cerebral infarct volume in rats [3]. The content of NSE in brain tissue increased significantly after cerebral ischemia 2 h/reperfusion 3 h, while increased at ischemic reperfusion 5 h (2 h later than that in brain tissue) in serum [4,5]. Clinical trials indicated that Shuxuetong injection, a kind of traditional Chinese medicine, could significantly reduce the serum NSE level and protect effectively the brain injury [6]. All of those proved that NSE could be used as an objective index to judge the extent of cerebral ischemic damage and prognosis [7-9]. Neuroglial marker protein S100B, a kind of acid Ca2+-binding protein, participates in cell proliferation, cell skeleton regulation and other biological activeties. However, vast amount of S100B existed in intercellular tissue could trigger inflammation to cause neuronal apoptosis [10]. Animal experimental studies indicated that the expression of S100B increased significantly after cerebral ischemia 1 h [11]. Clinical trials showed that the concentration of serum S100B increased significantly in ischemic stroke patients [12], and related closely to the classification, serious degree, infarct volume and mortality of ischemic stroke [13]. Myelin basic protein (MBP) locates in the serous membrane surface of myelin sheath and combines closely to myelin sheath lipid, which is beneficial to steady the structure and function of myelin in central nervous system [14]. The lack of MBP could lead myelinization obstacle and the MBP level could reflect the severity of central nervous system damage and myelin sheath injury [15], so plenty MBP is very important for the function recovery of central nervous system [16]. In animal experiments, Chen et al. [17] reported that MBP mRNA expressed with a small amount in normal adult rat brain and reduced significantly after cerebral ischemic injury. Our previous studies showed that picroside II could inhibit the neuronal apoptosis induced by the expression of inflammatory cytokine in cerebral ischemic injury in rats [18,19]. According to the neurobehavioral and immunohistochemical experiments, we considered that the optimal composition of the therapeutic dose and time window of picroside II in treating cerebral ischemic injury should be achieved by injecting picroside II intraperitoneally with 20 mg/kg body weight at ischemia 1.5 h [20], while those results were inevitablely limited or inexact because the neurobehavioral evaluation was easily influenced by subjective factors and the immunohistochemical staining was semi-quantitatively only. In this study, the authors aimed to explore the optimal therapeutic dose and time window of picroside II in treating cerebral ischemic injury in rats according to orthogonal design test from three aspects of neurons, glial cells, and myelinization by determining the contents of NSE, S100B and MBP quantitatively in the serum and brain tissue.
2. Materials and Methods
2.1. Animal Models
Total of 70 adult healthy male Wistar rats, SPF grade, weight 230 - 250 g, supplied by the Experiment Animal Center of Qingdao Drug Inspection Institute (SCXK (LU) 20100100). This experiment was approved by the Ethics Committee of Qingdao University Medical College (QUMC 201109). The local legislation for ethics of experiment on animals and guidelines for the care and use of laboratory animals were followed in all animal procedures. All animals were acclimatized for 7 days and allowed free access to food and water in a room temperature (23˚C ± 2˚C) and humidity-controlled housing with natural illumination and absolute diet 12 h before operation. Firstly, five rats were randomly selected as sham group, and the rest 65 rats were anesthetized by injecting intraperitoneally 10% chloral hydrate (300 mg/kg) and fixed in supine position to conduct aseptic operation to establish forebrain ischemia models by bilateral common carotid artery occlusion (BCCAO) [21]. Core body temperature was keeping with a rectal probe and maintained at 36˚C - 37˚C using a homeothermic blanket control unit (Qingdao Apparatus, China) during and after the surgery operation. 12 animals that died or didn’t wake 2 h after surgical operation were rejected out of the experiment, while the rest 53 cases of successful models were brought into statistical ranges. The 5 rats of sham group were experimented the same surgical procedure except of BCCAO.
2.2. Orthogonal Experimental Design
Total of 53 cases of successful BCCAO rat models were randomly divided into model group (n = 5) and treatment group (n = 16 × 3) which were subgrouped according to the principle of orthogonal experimental design of [L16(45)] consisting of two impact factors with four impact levels (Table 1). The impact factor A is the therapeutic time widow designed four levels as ischemia 1.0 h, 1.5 h, 2.0 h and 2.5 h. The impact factor B is the therapeutic drug dose designed four levels as following 5 mg/kg, 10 mg/kg, 20 mg/kg and 40 mg/kg body weight (Table 1). Every test repeated three times.
2.3. Treatment Methods
Picroside II (molecular formula: C23H28O13, molecular weight: 512.48, CAS No: 39012-20-9, purity > 98%) was provided by Tianjin Kuiqing Medical Technology Co. Ltd. and diluted into 1% solution with normal solution and injected intraperitoneally with corresponding drug dose at designed time according to the orthogonal layout of [L16(45)]. Rats in the sham group and model group were intraperitoneally injected same amount of normal saline 2 h after cerebral ischemia.
2.4. Specimen Collection
The rats were anesthetized by injecting intraperitoneally 10% chloral hydrate (300 mg/kg) at 24 h after treatment. Total of 2 ml blood was collected from heart and centrifuged with 4000 r/m for 10 min to separated serum and stored at −20˚C. Then the rats were immediately perfused normal saline 200 ml from heart after craniotomy. Taking the whole brain and removing the olfactory bulb and prefrontal brain tissue, cutting 500 mg ischemic brain tissue from optic chiasma(Bregma 0.00 mm)backwards
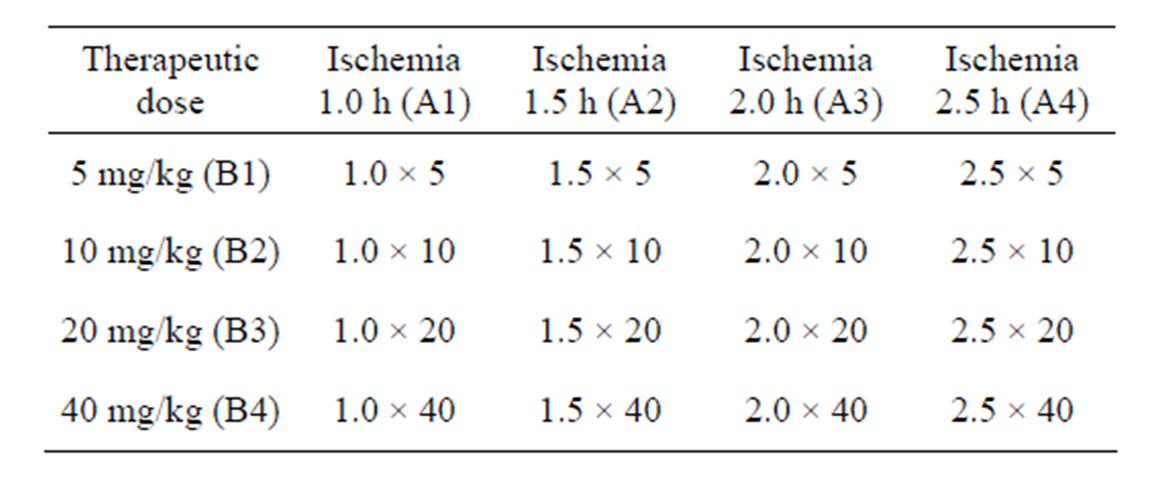
Table 1. Orthogonal experimental design of [L16(45)].
to grind into powder in the pre-cooling mortar, and then adding cell lysis solution according to 1:3 proportion (500 μl cell lysis solution + 5 μl PMSF, No. P0013, Biyuntian Biotechnology Co. Ltd.). After ultrasonic slurry, the brain sample mixture was centrifuged with 12,000 r/min for 10 min at 4˚C condition (Eppendorf 5801, Germany), then the supernatant was collected to determine the protein concentration by BCA assay (Wuhan Boster Biological Engineering Co. Ltd.) and stored at −20˚C.
2.5. Enzyme-Linked Immunosorbent Assay (ELISA)
The ELISA kits of NSE (E02N0025), S100B (E02S0042) and MBP (E02M0034) purchased from Blue Gene Biotech. Co. Ltd. were applied to determine the contents of NSE, S100B and MBP in serum and brain tissue. Before ELISA determination, the samples of serum and brain tissue were re-melted at room temperature and centrifuged again to collect supernatant 100 μl. The procedures: 1) Secure the desired numbers of coated wells in the holder and then add 100 μl of standards or samples to the appropriate well in the antibody pre-coated microtiter plate. Add 100 μl of PBS (pH 7.0 - 7.2) in the blank control well. 2) Dispense 10 μl of balance solution into 100 μl specimens, mix well. 3) Add 50 μl of conjugate to each well (Not blank control well). Mix well. Cover and incubate the plate for 1 h at 37˚C. 4) Wash the microtiter plate using one of the specified methods indicated below: a) Manual washing: Remove incubation mixture by aspirating contents of the plate into a sink or proper waste container. Fill in each well completely with 1× wash solution, and then aspirate contents of the plate into a sink or proper waste container. Repeat this procedure five times for a total of FIVE washes. After washing, invert plate, and blot dry by hitting the plate onto absorbent paper or paper towels until no moisture appears. b) Automated washing: Wash plate five times with diluted wash solution (350 - 400 μl/well/wash) using an auto washer. After washing, dry the plate as above. 5) Add 50 μl substrate A and 50 μl substrate B to each well including blank control well, subsequently. Cover and incubate for 10 - 15 minutes at 20˚C - 25˚C (Avoid sunlight). 6) Add 50 μl of stop solution to each well including blank control well. Mix well. 7) Determine the optical density (OD) at 450 nm using a microplate reader immediately. 8) Calculating results: a) The standard curve is used to determine the amount of samples. b) First, average the duplicate readings for each standard and sample. All OD values are subtracted by the mean value of blank control before result interpretation. DO NOT subtract the OD of standard zero. c) Construct a standard curve by plotting the average OD for each standard on the vertical (Y) axis against the concentration on the horizontal (X) axis, and draw a best fit curve using graph paper or statistical software to generate a four parameter logistic (4-PL) curve-fit or logit-log linear regression curve. An X-axis for the optical density and a Y-axis for the concentration is also a choice. The data may be linearized by plotting the log of the concentrations versus the log of the OD and the best fit line can be determined by regression analysis. d) Calculate the concentration of samples corresponding to the mean absorbance from the standard curve. e) The sensitivity in this assay is 0.1 ng/ml.
2.6. Statistical Analysis
SPSS 17.0 software was used for data statistical analysis. According to the result, multi-group comparison was made by analysis of orthogonal test whether different level of administrating time and therapeutic dose had significant deviation or not, and whether their interaction on each detected index had significant deviation or not, meanwhile to explore the best therapeutic drug dose and the therapeutic time window. Determination of statistical significance was carried out with Student’s t-test between two groups. One-way analysis of variance (one-way ANOVA) was used for the comparison of multiple sets of data, then further study was made by the method of Least significant differences (LSD) to compared between multiple data.
3. Results
3.1. The Results of ELISA (Tables 2 and 3)
In sham group, the concentrations of NSE, S100B and MBP in serum were significantly lower than those in brain tissue (t = 15.72 - 32.48, P < 0.01). In model group, the concentrations of NSE and S100B both in serum and brain tissue were significantly higher than those in
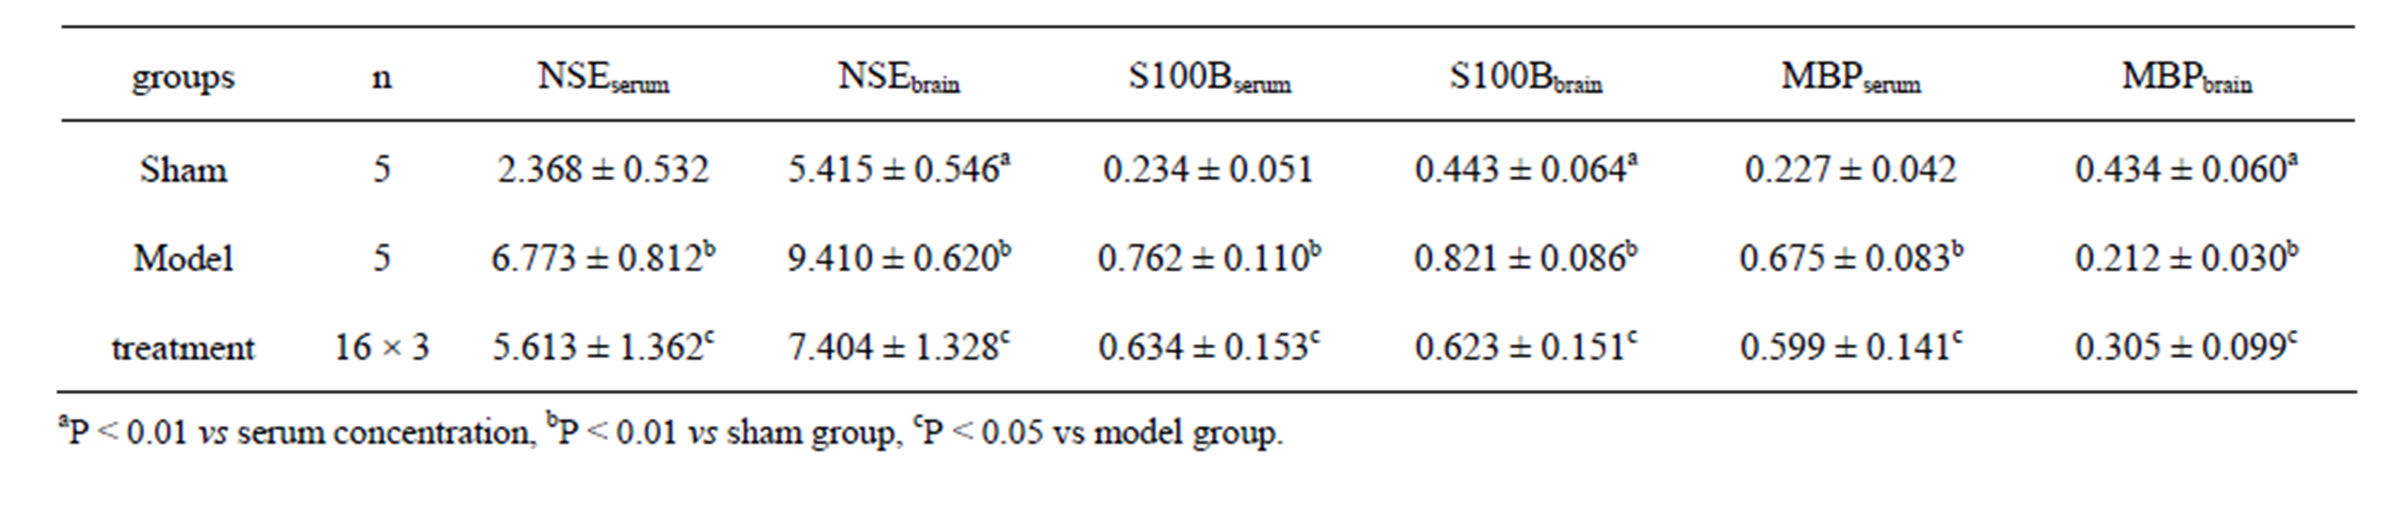
Table 2. The results of NSE, S100B and MBP (ng/ml) (mean ± SD).
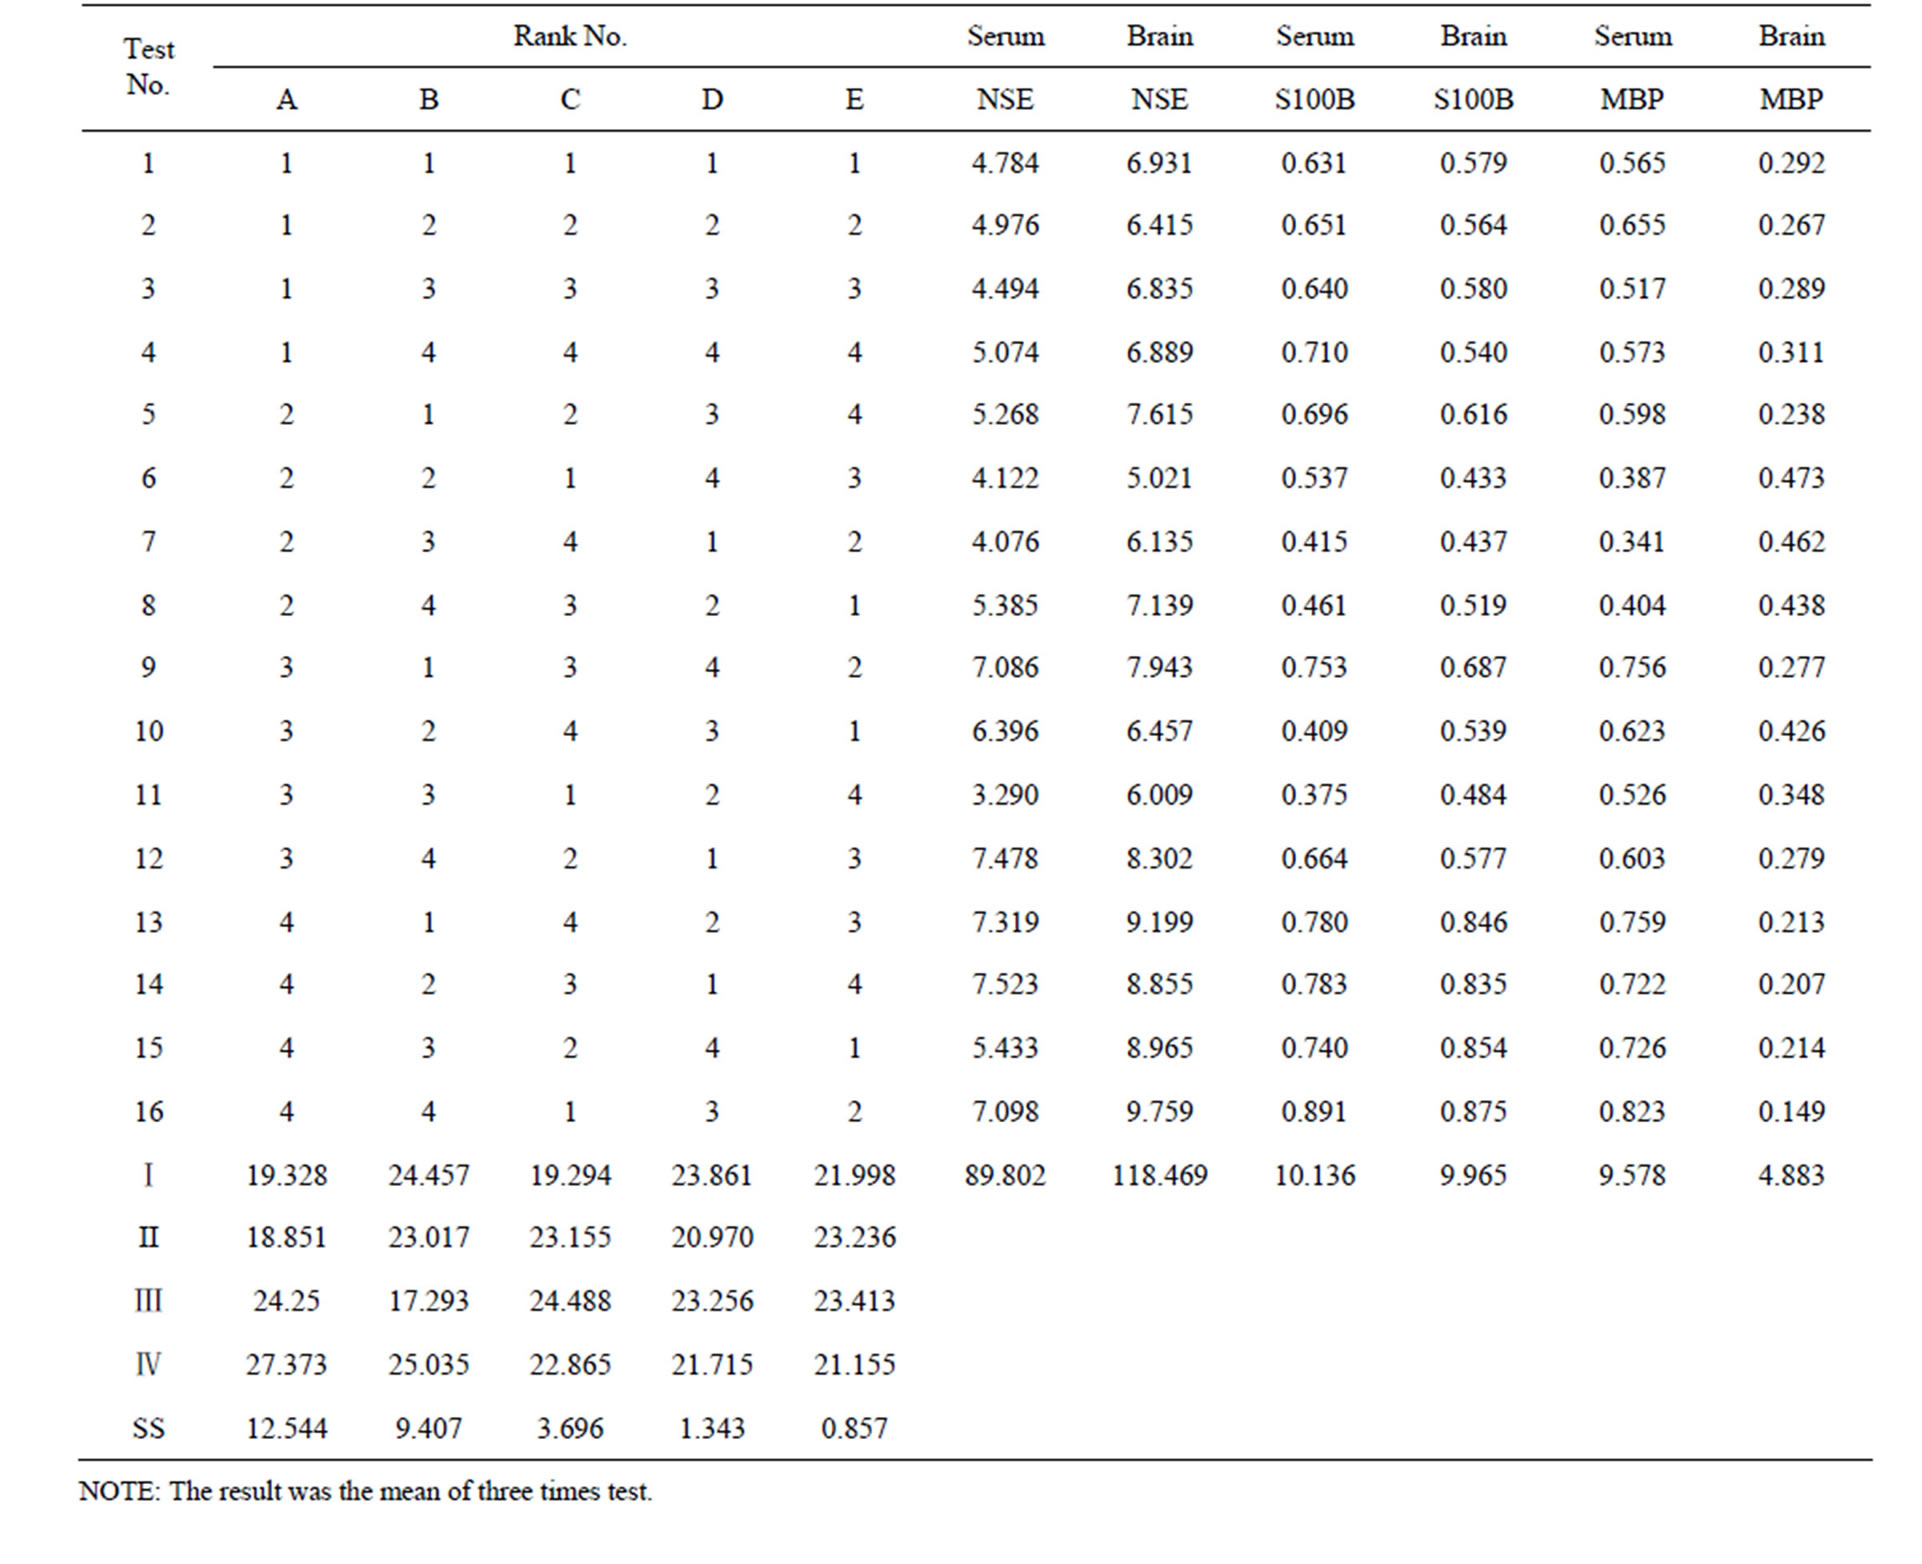
Table 3. [L16 (45)] orthogonal table and test results.
sham group (t = 23.72 - 37.04, P < 0.01), while in treatment group those indexes were significantly lower than those in model group (t = 2.98 - 5.97, P < 0.05). In model group, the MBP concentration in serum was significantly higher, while it in brain tissue lower than that in sham group (t = 22.38 - 29.15, P < 0.01). In treatment group, the MBP concentration in serum is significantly lower, but in brain tissue higher than that in model group (t = 1.42 - 3.78, P < 0.05) (Table 2).
3.2. Analysis of NSE (Table 4)
3.2.1. NSE in Serum
There was significant probability between the different levels of impact factors A (therapeutic time window) and B (drug dose) on the concentration of NSE in serum (P < 0.05), but no significant probability (P > 0.05) found in the impact factor C (time-dose interaction). This indicated that both the therapeutic time window (or cerebral ischemia time) and the picroside II drug dose (or therapeutic dose) influenced significantly the concentration of NSE in serum after cerebral ischemia injury, while no significant influences existed in the interactions of therapeutic time window and drug dose. All data were compared in pairs by the way of least significant difference (LSD) and the statistical analysis results indicated that no significant deviations (P > 0.05) between 1.0 h (A1) and 1.5 h (A2), 2.0 h (A3) and 2.5 h (A4), and there were significant deviations between the rest therapeutic time levels (P < 0.05). There was no significant differences (P > 0.05) in drug dose between 5 mg/kg (B1) and 10 mg/kg (B2), 10 mg/kg (B2) and 40 mg/kg (B4), 5 mg/kg (B1) and 40 mg/kg (B4), while significant differences found in the rest therapeutic dose levels (P < 0.05). So the better combination of therapeutic time window and drug dose was A1B3 or A1B4. According to the principle of minimization of medication dose and maxi-
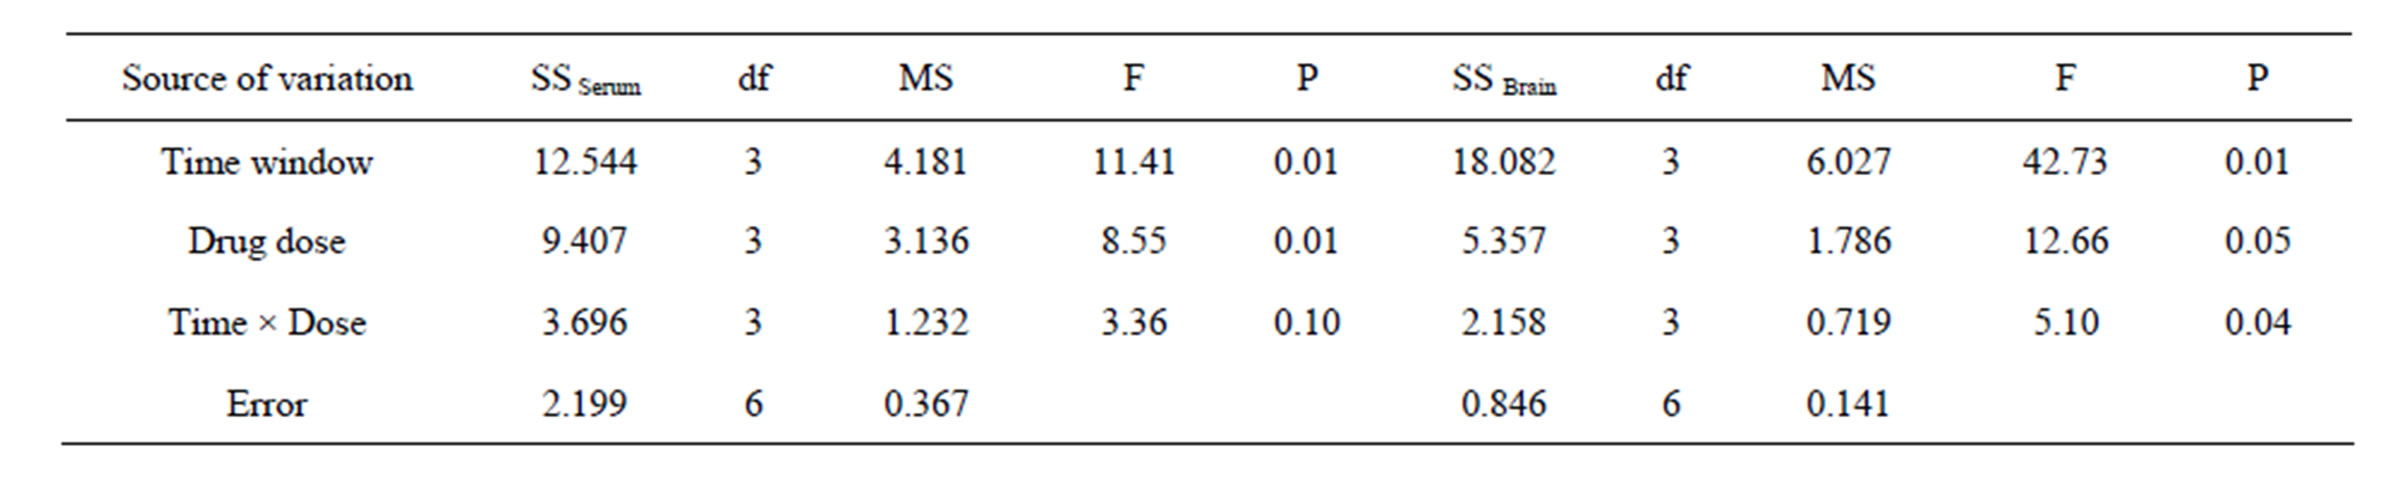
Table 4. ANOVA of NSE.
mization of therapeutic time window, the best combination is A2B3 (1.5 h/20mg), i.e. the best therapeutic time window and dose of picroside II should be injecting intraperitoneally with 20 mg/kg body weight at cerebral ischemia 1.5 h.
3.2.2. NSE in Brain Tissue
There were significant differences among the different levels of impact factors A (therapeutic time window), B (drug dose) and C (time-dose interaction) on the content of NSE in brain tissue (P < 0.05). It is proved that both therapeutic time window, drug dose and the time-dose interactions influenced significantly the concentrations of NSE in brain tissue after cerebral ischemia injury. All data were compared in pairs by the way of LSD and the results indicated that no significant deviations (P > 0.05) between 1.0 h (A1) and 1.5 h (A2), 1.0 h (A1) and 2.0 h (A3), but there were significant deviations between the rest ischemia time levels (P < 0.05). There were no significant differences (P > 0.05) in dose between 5 mg/kg (B1) and 40 mg/kg (B4), 10 mg/kg (B2) and 20 mg/kg (B3), while significant differences existed between the rest dose levels (P < 0.05). Considering the minimization of medication dose and maximization of therapeutic time, it was presumed that A2B2 (1.5 h/10 mg) should be the best combination, i.e. the best therapeutic t ime window and dose of picroside II be injecting intraperitoneally with 10mg/kg body weight at cerebral ischemia 1.5 h.
3.3. Analysis of S100B (Table 5)
3.3.1. S100B in Serum
The different levels of impact factor A had a significant probability to influence the concentration of S100B (P< 0.05), while no significant probability among the different levels of impact factor B and the time-dose interacttion (P > 0.05). The LSD results showed that there were significant deviations (P < 0.05) between 1.5 h (A2) and 2.5 h (A4), 2.0 h (A3) and 2.5 h (A4), but no significant deviations between the rest ischemia time levels (P > 0.05). There were significant differences (P < 0.05) between 5 mg/kg (B1) and 20 mg/kg (B3), but no signifycant differences between the rest drug dose levels (P > 0.05). Given the minimum drug dose and maximized therapeutic time window, the best combinations should be A2B3, i.e. the best therapeutic time window and dose of picroside II be injecting intraperitoneally with 20 mg/kg body weight at cerebral ischemia 1.5 h.
3.3.2. S100B in Brain Tissue
A significant difference (P < 0.05) existed among each level of impact factor A and B, but no significant probability found in impact C (P > 0.05). LSD results showed that no significant deviation (P > 0.05) between 1.0 h (A1) and 2.0 h (A3), but there were significant deviations between the rest ischemia time levels (P < 0.05). There were significant differences (P < 0.05) between 5 mg/kg (B1) and 10 mg/kg (B2), 5 mg/kg (B1) and 20 mg/kg (B3), but no significant differences among the rest dose levels (P > 0.05). On the basis of the minimum drug dose and maximized therapeutic time window, the A2B3 should be the best combinations, i.e. the best therapeutic time window and dose of picroside II be injecting intraperitoneally with 20 mg/kg at cerebral ischemia 1.5 h.
3.4. Analysis of MBP (Table 6)
3.4.1. MBP in Serum
The significant difference was found among different levels of impact factor A (P < 0.05), but no significant differences among the different levels of impact factor B and C (P > 0.05). LSD results showed that no significant deviations (P > 0.05) between 1.0 h (A1) and 2.0 h (A3), but significant deviations existed among the rest ischemia time levels (P < 0.05). There was a significant difference (P < 0.05) between 5 mg/kg (B1) and 20 mg/kg (B3), while no significant differences among the rest dose levels (P > 0.05). Given the minimum drug dose and maximized time window, the A2B3 should be the combination, i.e. the best therapeutic time window and dose of picroside II be ischemia 1.5 h and 20 mg/kg body weight respectively.
3.4.2. MBP in Brain Tissue
There were significant differences among different levels of impact factor A (P < 0.05), while no significant differences found among the different levels of impact factors B and C (P > 0.05). LSD results indicated that no significant deviations (P > 0.05) between 1.0 h (A1) and 2.0 h (A3), 1.5 h (A2) and 2.0 h (A3), but there were sig-
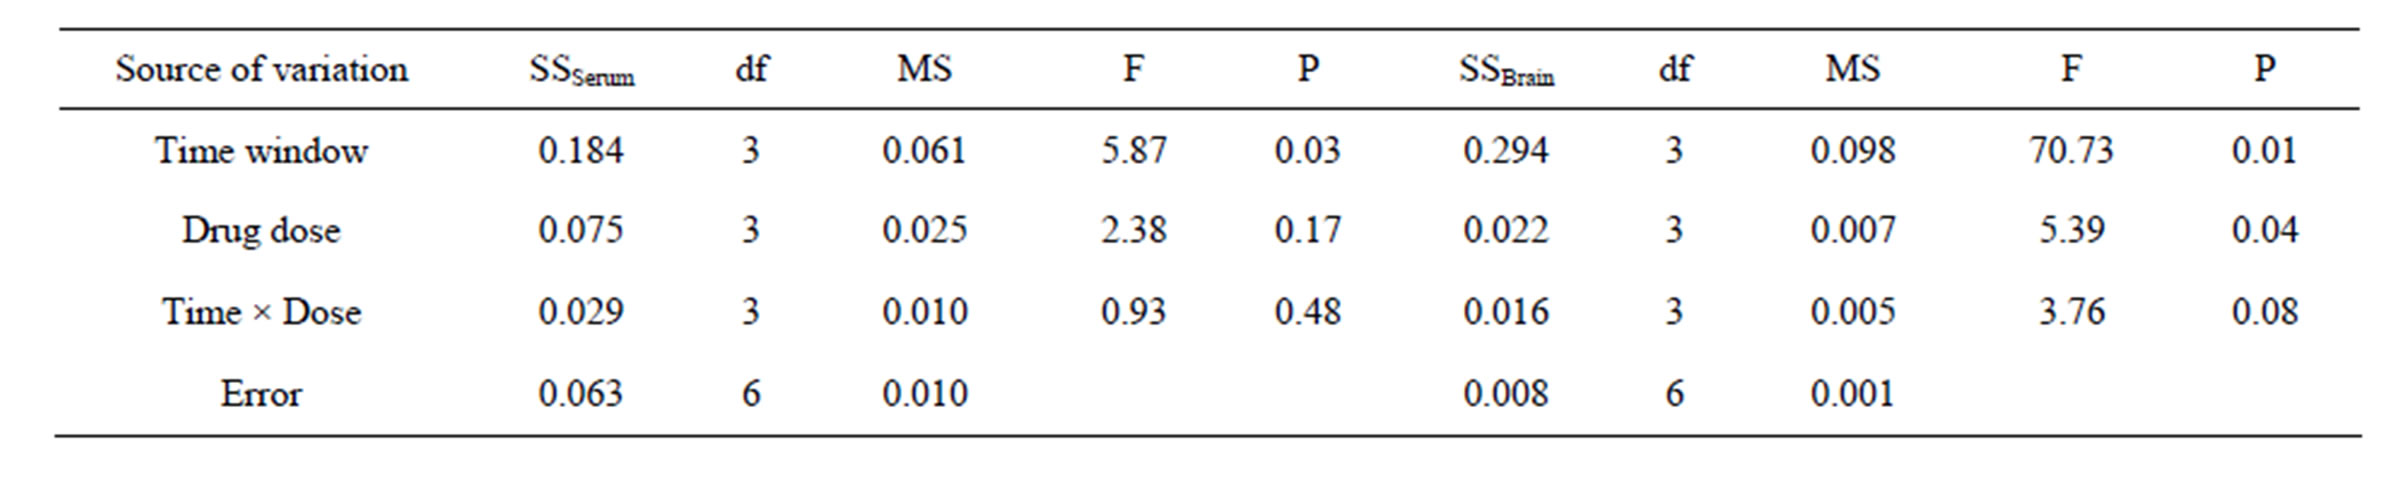
Table 5. ANOVA of S100B.
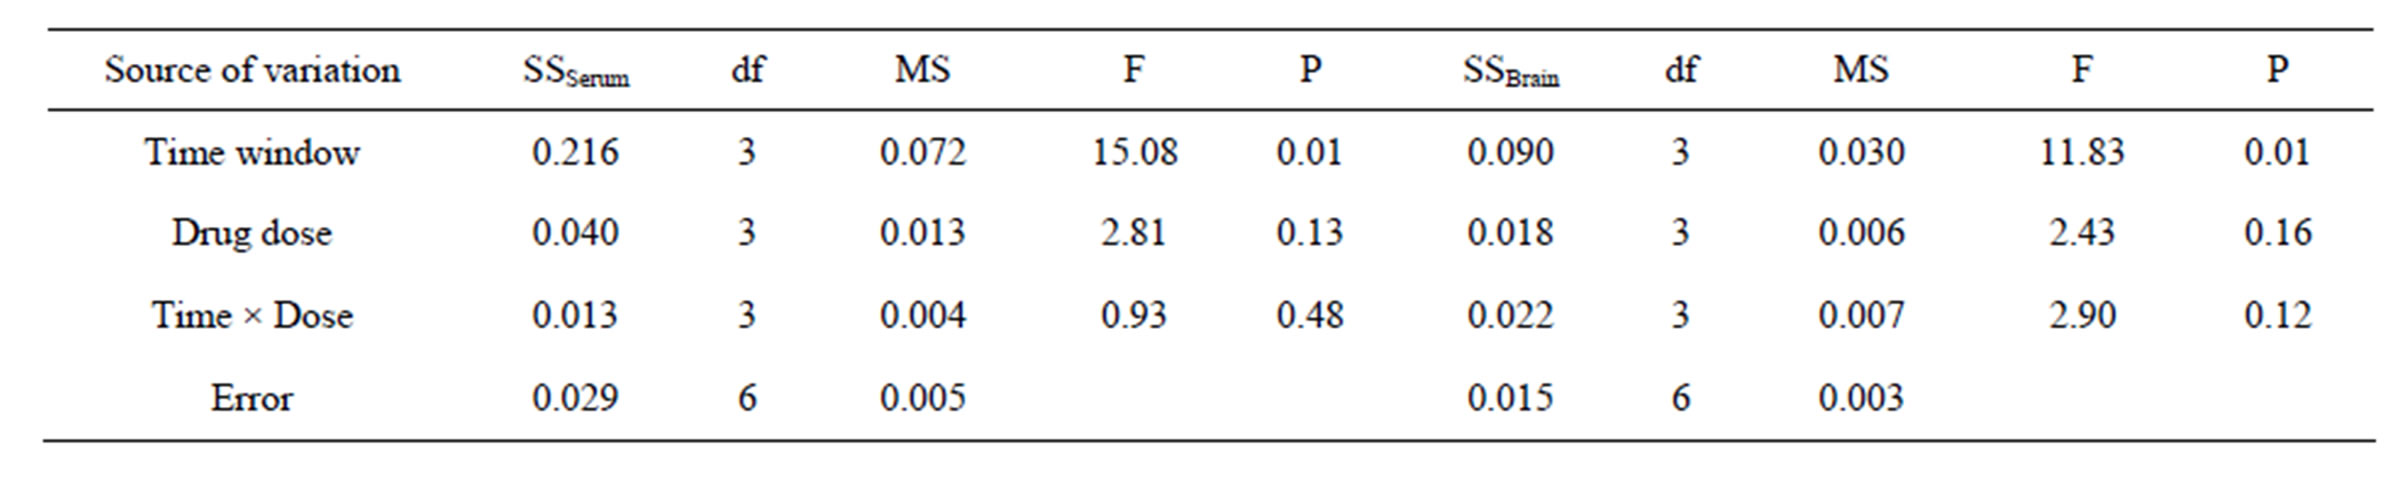
Table 6. ANOVA of MBP.
nificant deviations among the rest ischemia time levels (P < 0.05). There was a significant difference (P < 0.05) between 5 mg/kg (B1) and 10 mg/kg (B2), while no significant differences among the rest dose levels (P > 0.05). According to the principle of minimization of medication dose and maximization of therapeutic time, the best therapeutic time window and drug dose of picroside II (A2B2) should be injecting intraperitoneally with 10 mg/kg body weight at cerebral ischemia 1.5 h.
4. Discussion
Enolase consists of five isozymes such as αα, ββ, γγ, αβ, αγ, and the type γγ is called neuron-specific enolase (NSE). The molecular weight of NSE is 78kD and its active site located in the three-dimensional structure of γ subunit [22]. Normally, the content of NSE in brain tissue and cerebrospinal fluid (CSF) or blood is lowly, but its mRNA expressed highly after cerebral ischemic or anoxic injury. Since NSE did not combine with actin in neurons, it will be released into CSF from ischemic or necrotic cells when neurons died or nerve myelin disintegrated, and then penetrated through blood brain barrier (BBB) into blood. The more serious of the nerve cell damage the more NSE release into the blood, so NSE might be a marker enzyme to diagnose ischemic brain injury and injury degree by detecting the concentration of NSE in CSF or serum [23]. Our experiment results indicated that the concentration of NSE in serum was significantly lower than that in brain tissue in the sham group and increased significantly both in the serum and brain tissue after ischemic injury, which suggested that a large amount of NSE expressed in brain tissue and then passed into blood through the damaged BBB in model group. The concentrations of NSE both in serum and brain tissue reduced significantly after treatment with picroside II, which prompted the picroside II could play a neuroprotective effect for nerve cells and BBB.
S100 protein has α and β subunits. S100B is composed of β homologous dimmers and mainly exists in astrocytes and Schwann cells in nervous system [24]. A little amount of S100B could promote the neuronal axon extension and neuron survival, while a large amount of S100B might cause toxic and side effects [10]. After cerebral ischemic injury, glial cells would produce a lot of activated S100B and release into the extracellular tissue [25], and then penetrate into the CSF and blood through the damage BBB, so the concentration of S100B in serum was positively correlated with the severity of cerebral ischemia injury [26]. In the experiment of cell culture, adding high concentration of S100B in nutrient solution could activate astrocytes and microglia to inhibit the expression of glial-derived nerve growth factor (GDNF) and reduce the neuroprotective effect of astrocytes, at the same time, promote inflammation factors releasing and exacerbate nerve cell damage [27]. Animal experiments showed that excessive expression of S100B could exacerbate brain ischemia injury in transgenic mice [28]. Clinical studies indicated that the concentration of S100B in CSF was highly correlated to the severity and prognosis of patients with acute ischemic stroke, the higher the concentration of S100B the worse the prognosis [29]. Our study showed that the concentration of S100B in serum was significantly lower than that in brain tissue in sham group, while increased significantly both in serum or brain in model group. After treatment with picroside II, the concentration of S100B decreased significantly than that in model group, which suggested the picroside II has an exact neuroprotective effect for cerebral ischemic injury.
In central nervous system, MBP is synthesized in oligodendrocytes and exists the highest level in the white matter. Only through myelinization, the nerve fibers could play a conducting function. MBP is a very important structural protein to participate in myelinization. Generaly, the concentration of MBP in CSF is less than 6.95 mg/L. On the one hand, when cerebral ischemic injury happened, MBP leaked from necrotic oligodendrocytes into CSF through the damage BBB. On the other hand, ischemia/hypoxia stress itself also could stimulate MBP synthesis [30]. Therefore, MBP was considered as a kind of specific protein markers to determine whether nerve demyelinated or not, and the concentration of MBP in serum could reflect in certain extent whether brain injury occurred or not [31]. Our study showed the concentration of MBP in serum was significantly lower than that in brain tissue in sham group. No matter in serum or brain tissue, they increased significantly in model group which proved that the BBB was damage after cerebral ischemia, and a large amount of MBP released into blood stream. After treated by picroside II, the concentration of MBP decreased in serum while increased in brain tissue significantly than that in model group, which suggested that picroside II might play an important role for repairing BBB and protecting cerebral ischemia in rats.
In this experiment, the authors designed four time points at ischemia 1.0 h, 1.5 h, 2.0 h and 2.5 h, and injected picroside II intraperitoneally with four therapeutic doses of 5 mg/kg, 10 mg/kg, 20 mg/kg and 40 mg/kg. The experiment was carried out according to orthogonal table of [L16(45)] to a better therapeutic schedule to get the best treatment effectiveness with a small number of tests. Through the concentrations of NSE, S100B and MBP in serum and brain tissue, the results showed the treatment effect of picroside II was significantly difference between the different therapeutic time window and different drug dose. Considering minimization of medication dose and maximization of therapeutic time window, it is suggested the best choose is A2B2 or A2B3 composition, i.e. the best therapeutic time window should be at 1.5 h after ischemia and the best therapeutic dose of picroside II be 10 - 20 mg/kg body weight. Because the mechanism of cerebral ischemic injury is very complicated and only 3 indexes was observed in this experiment, the results could not possibly all be right. So the golden evaluating indexes need to be studied in further experiments.
5. Conclusion
This study suggested that the optimal composition of the therapeutic dose and time window of picroside II in treating cerebral ischemic injury should be injected picroside II intraperitoneally with 10 - 20 mg/kg body weight at ischemia 1.5 h according to the principle of minimization of medication dose and maximization of therapeutic time.
6. Acknowledgements
This study was supported by grant-in-aids for the Natural Science Fund of China (81041092, 81274116).
REFERENCES
- J. Joseph, F. F. Cruz-Sánchez and J. Carreras, “Enolase Activity and Isoenzyme Distribution in Human Brain Regions and Tumors,” Journal of Neurochemistry, Vol. 66, No. 6, 1996, pp. 2484-2490. doi:10.1046/j.1471-4159.1996.66062484.x
- V. Selakovic, R. Raicevic and L. Radenovic, “The Increase of Neuron-Specific Enolase in Cerebrospinal Fluid and Plasma as a Marker of Neuronal Damage in Patients with Acute Brain Infarction,” Journal of Clinical Neuroscience, Vol. 12, No. 5, 2005, pp. 542-547. doi:10.1016/j.jocn.2004.07.019
- R. H. Hatfield and R. M. McKernan, “CSF Neuron-Specific Enolase as a Quantitative Marker of Neuronal Damage in a Rat Stroke Model,” Brain Research, Vol. 577, No. 2, 1992, pp. 249-252. doi:10.1016/0006-8993(92)90280-M
- L. Y. Jin, Z. Y. Liu, X. W. Yang, Q. L. Sui and Y. L. Guo, “The Expression and Serum Level of NSE and S-100β after Cerebral Ischemia Reperfusion in Rabbits,” Chinese Journal of Rehabilitation Medicine, Vol. 22, No. 11, 2007, pp. 964-967.
- T. X. Niu, Z. Y. Shi, J. J. Luo and X. D. Meng, “Determination and Clinical Significance of NSE and S-100β Protein in Hypoxia-Ischemia Brain Injured Rats (in Chinese),” Chinese Journal of Comparative Medicine, Vol. 19, No. 9, 2009, pp. 34-37.
- J. Zhen, T. Chen, M. Kong, Z. D. Li, L. Kou, H. W. Liu, et al., “The Influence of Shuxuetong Injection to Serum NSE Levels and Functional Recovery in Patients with Acute Cerebral Infarction,” China Journal of Chinese Maternal Medicine, Vol. 36, No. 18, 2011, pp. 2584-2587.
- E. C. Jauch, C. Lindsell, J. Broderick, S. C. Fagan, B. C. Tilley and S. R. Levine, “NINDS rt-PA Stroke Study Group. Association of Serial Biochemical Markers with Acute Ischemic Stroke: The National Institute of Neurological Disorders and Stroke Recombinant Tissue Plasminogen Activator Stroke Study,” Stroke, Vol. 37, No. 10, 2006, pp. 2508-2513. doi:10.1161/01.STR.0000242290.01174.9e
- C. Foerch, M. T. Wunderlich, F. Dvorak, M. Humpich, T. Kahles, M. Goertler, et al., “Elevated Serum S100B Levels Indicate a Higher Risk of Hemorrhagic Transformation after Thrombolytic Therapy in Acute Stroke,” Stroke, Vol. 38, No. 9, 2007, pp. 2491-2495. doi:10.1161/STROKEAHA.106.480111
- H. Sienkiewicz-Jarosz, M. Gałecka-Wolska, A. Bidziński, D. Turzyńska, A. Sobolewska, B. Lipska, et al., “Predictive Value of Selected Biochemical Markers of Brain Damage for Functional Outcome in Ischaemic Stroke Patients,” Neurologia i Neurochirurgia Polska, Vol. 43, No. 2, 2009, pp. 126-133.
- T. Yardan, A. K. Erenler, A. Baydin, K. Aydin and C. Cokluk, “Usefulness of S100B Protein in Neurological Disorders,” Journal of Pakistan Medical Association, Vol. 61, No. 3, 2011, pp. 276-281.
- R. L. Büyükuysal, “Protein S100B Release from Rat Brain Slices during and after Ischemia: Comparison with Lactate Dehydrogenase Leakage,” Neurochemistry International, Vol. 47, No. 8, 2005, pp. 580-588. doi:10.1016/j.neuint.2005.06.009
- M. Üstündağ, M. Orak, C. Güloğlu, Y. Tamam, M. B. Sayhan and E. Kale, “The Role of Serum Osteoprotegerin and S-100 Protein Levels in Patients with Acute Ischaemic Stroke: Determination of Stroke Subtype, Severity and Mortality,” Journal of International Medical Research, Vol. 39, No. 3, 2011, pp. 780-789. doi:10.1177/147323001103900310
- R. Kazmierski, S. Michalak, A. Wencel-Warot and W. L. Nowinski, “Serum Tight-Junction Proteins Predict Hemorrhagic Transformation in Ischemic Stroke Patients,” Neurology, Vol. 79, No. 16, 2012, pp. 1677-1685. doi:10.1212/WNL.0b013e31826e9a83
- M. T. Wunderlich, C. W. Wallesch and M. Goertler, “Release of Neurobiochemical Markers of Brain Damage Is Related to the Neurovascular Status on Admission and the Site of Arterial Occlusion in Acute Ischemic Stroke,” Journal of the Neurological Sciences, Vol. 227, No. 1, 2004, pp. 49-53. doi:10.1016/j.jns.2004.08.005
- K. J. Lamers, P. Vos, M. M. Verbeek, F. Rosmalen, W. J. van Geel and B. G. van Engelen, “Protein S-100B, Neuron-Specific Enolase (NSE), Myelin Basic Protein (MBP) and Glial Fibrillary Acidic Protein (GFAP) in Cerebrospinal Fluid (CSF) and Blood of Neurological Patients,” Brain Research Bulletin, Vol. 61, No. 3, 2003, pp. 261- 264. doi:10.1016/S0361-9230(03)00089-3
- M. A. Bedell, N. A. Jenkins and N. G. Copeland, “Good Genes in Bad Neighbourhoods,” Nature Genetics, Vol. 12, No. 3, 1996, pp. 229-232. doi:10.1038/ng0396-229
- Y. Z. Chen, Q. Yi, G. Liu, X. Shen, L. H. Xuan and Y. Tian, “Cerebral White Matter Injury and Damage to Myelin Sheath Following Whole-Brain Ischemia,” Brain Research, Vol. 1495, No. 1, 2013, pp. 11-17. doi:10.1016/j.brainres.2012.12.006
- Y. L. Guo, X. Y. Xu, Q. Li, Z. Li and F. Du, “Anti-Inflammation Effects of Picroside II in Cerebral Ischemic Injury Rats,” Behavioral Brain Function, Vol. 6, No. 1, 2010, pp. 43-53. doi:10.1186/1744-9081-6-43
- Z. Li, Q. Li, W. Shen and Y. L. Guo, “The Interferring Effects of Picroside II on the Expressions of NF-κB and I-κB Following Cerebral Ischemia Reperfusion Injury in Rats,” Chinese Pharmacological Bulletin, Vol. 26, No. 1, 2010, pp. 52-55.
- H. T. Pei, X. Su, L. Zhao, H. Y. Li, Y. L. Guo, M. Z. Zhang, et al., “Primary Study for the Therapeutic Dose and Time Window of Picroside II in Treating Cerebral Ischemic Injury in Rats,” International Journal of Molecular Sciences, Vol. 13, No. 3, 2012, pp. 2551-2562.
- A. Márquez-Martín, F. Jiménez-Altayó, A. P. Dantas, L. Caracuel, A. M. Planas and E. Vila, “Middle Cerebral Artery Alterations in a Rat Chronic Hypoperfusion Model,” Journal of Applied Physiology, Vol. 112, No. 3, 2012, pp. 511-518. doi:10.1152/japplphysiol.00998.2011
- G. B. Uinn, I. G. Reeves and I. N. Day, “Mapping of Antigenic Sites in Human Neuron Specific Enolase by Expression Subcloning,” Clinical Chemistry, Vol. 40, No. 5, 1994, pp. 790-795.
- M. T. Wunderlich, H. Lins, M. Skalej, C. W. Wallesch and M. Goertler, “Neuron-Specific Enolase and Tau Protein as Neurobiochemical Markers of Neuronal Damage Are Related to Early Clinical Course and Long-Term Outcome in Acute Ischemic Stroke,” Clinical Neurology and Neurosurgery, Vol. 108, No. 6, 2006, pp. 558-563. doi:10.1016/j.clineuro.2005.12.006
- M. Murabayashi, M. Minato, Y. Okuhata, M. Makimoto, S. Hosono, N. Masaoka, et al., “Kinetics of Serum S100B in Newborns with Intracranial Lesions,” Pediatrics International, Vol. 50, No. 1, 2008, pp. 17-22. doi:10.1111/j.1442-200X.2007.02506.x
- R. Gerlach, G. Demel, H. G. König, U. Gross, J. H. Prehn, A. Raabe, et al., “Active Secretion of S100B from Astrocytes during Metabolic Stress,” Neuroscience, Vol. 141, No. 4, 2006, pp. 1697-1701. doi:10.1016/j.neuroscience.2006.05.008
- D. T. Laskowitz, S. E. Kasner, J. Saver, K. S. Remmel, E. C. Jauch and BRAIN Study Group, “Clinical Usefulness of a Biomarker-Based Diagnostic Test for Acute Stroke: The Biomarker Rapid Assessment in Ischemic Injury (BRAIN) Study,” Stroke, Vol. 40, No. 1, 2009, pp. 77-85. doi:10.1161/STROKEAHA.108.516377
- C. Reali, R. Pillai, F. Saba, S. Cabras, F. Michetti and V. Sogos, “S100B Modulates Growth Factors and Costimulatory Molecules Expression in Cultured Human Astrocytes,” Journal of Neuroimmunology, Vol. 243, No. 1-2, 2012, pp. 95-99. doi:10.1016/j.jneuroim.2011.11.011
- T. Mori, J. Tan, G. W. Arendash, N. Koyama, Y. Nojima and T. Town, “Overexpression of Human S100B Exacerbates Brain Damage and Periinfarct Gliosis after Permanent Focal Ischemia,” Stroke, Vol. 39, No. 7, 2008, pp. 2114-2121. doi:10.1161/STROKEAHA.107.503821
- R. Brouns, B. De Vil, P. Cras, D. De Surgeloose, P. Mariën and P. P. De Deyn, “Neurobiochemical Markers of Brain Damage in Cerebrospinal Fluid of Acute Ischemic Stroke Patients,” Clinical Chemistry, Vol. 56, No. 3, 2010, pp. 451-458. doi:10.1373/clinchem.2009.134122
- R. Gregersen, T. Christensen, E. Lehrmann, N. H. Diemer and B. Finsen, “Focal Cerebral Ischemia Induces Increased Myelin Basic Protein and Growth-Associated Protein- 43 Gene Transcription in Peri-Infarct Areas in the Rat Brain,” Experimental Brain Research, Vol. 138, No. 3, 2001, pp. 384-392. doi:10.1007/s002210100715
- T. Strand, C. Alling, B. Karlsson, I. Karlsson and B. Winblad, “Brain and Plasma Proteins in Spinal Fluid as Markers for Brain Damage and Severity of Stroke,” Stroke, Vol. 15, No. 1, 1984, pp. 138-144. doi:10.1161/01.STR.15.1.138
NOTES
*Corresponding author.