Advances in Chemical Engineering and Science
Vol.3 No.3A2(2013), Article ID:35635,5 pages DOI:10.4236/aces.2013.33A2001
Extraction, Methylation and Quantification of Fatty Acids in Fast Food Items and Its Health Implications
1Sustainable Development Policy Institute (SDPI), Islamabad, Pakistan
2Department of Environmental Sciences, Fatima Jinnah Women University, Rawalpindi, Pakistan
Email: *wastiayesha@gmail.com, uzairaiqbal@yahoo.com
Copyright © 2013 Ayesha Wasti, Uzaira Rafique. This is an open access article distributed under the Creative Commons Attribution License, which permits unrestricted use, distribution, and reproduction in any medium, provided the original work is properly cited.
Received April 10, 2013; revised May 10, 2013; accepted June 10, 2013
Keywords: fatty acid; fried foods; Stearic acid; fat content
ABSTRACT
The research is designed to study the relationship of intake of fatty acids through fast food items, consumption trends and related health issues. Fried food products most commonly consumed at restaurants were selected. Food outlets of both branded and non-branded vendors were included in the study for comparison. Total fat content, Fatty acids and Fatty Acid Methyl Esters (FAME’s) in food samples were determined experimentally using titrimetric and spectrophotometric methods. Fatty acids of Stearic, Oleic and Myristic were extracted from each food sample using petroleum ether as extracting solvent, followed by conversion to FAME’s by treating the filtrate with methylamine, ethanol and sulphuric acid. A survey analysis using the questionnaire as a tool was also conducted. The results showed variable concentration in each sample. Total fat content was highest in French fries, followed by fish and chicken. Among the fatty acids, Stearic acid was found highest in concentration than other two fatty acids. The study concluded that the level of saturated fatty acids was 0.4 g (7.6%), which was securely under the allowable limit of daily value (on a 2000 calorie diet) of 3 g (15%).
1. Introduction
Fatty acids are present in the metabolites of living organisms and are significant as nutritional substances. Different fatty acids play a vital role in regulating the biological as well as the physiological functions. Food processing makes it edible, tempting and makes it stable after storage [1].
Food industries develop techniques to prepare deep fried foods, which require less cooking time and are cost effective. The trend of fast foods has increased with time. Eating habits have now shifted to fast foods and a continuously increasing trend is being observed in its consumption. About half of the lunch or dinner order in different restaurants and canteens include fried food items [2]. Most of the foods such as French fries, fried fish pieces, samosas, pakoras, chicken sticks etc., are prepared by deep frying. These require very high temperatures about 180˚C or more which has to be kept at this high temperature for a longer time period [3]. Fried edibles absorb the heated fat which contributes towards the fat that is ingested by the consumers [4]. The frequent use of oil for frying at high temperatures results in different oxidative and thermal degradation that changes the physico, sensory and dietary characteristics of the food [5]. Degraded foods are harmful for health as they cause mutations, destroy vitamins and inhibit enzymes [6]. Western societies have mostly died because of cardiovascular diseases due to excessive fat intake [7].
For every individual perfect health is of the top priority. In the previous times the obesity, diabetes and heart diseases levels were not very prevalent. But now as the way of living has changed the food patterns have also transformed. Due to this huge change, more study is required in this area. In Pakistan, especially, there are very little research data that are available for the consumption of fried food and its effect so the research output will help in devising the safe levels of the selected fatty acids based upon the concentration levels found in the food items.
2. Materials and Methods
2.1. Reagents
Standard stock solutions of Stearic acid, Myristic acid and Oleic acid were prepared by dissolving 142 mg, 114 mg and 282 mg respectively to give 10 ppm solution in 100 ml of n-hexane for stearic and myristic acid and chloroform for oleic acid. Five working standards of varying strengths were prepared by dilution method. All reagents used were of analytical grade.
2.2. Sampling
In order to compare the amount of fatty acids in different food items both the branded and the unbranded fast food areas were chosen. Samples were obtained from the restaurants of Rawalpindi, Pakistan. Samples were labeled as A, B and C. Sample A and B were from branded food outlets while sample C was from a local shop. Each of the food items was taken in small amounts and sealed in airtight polythene zip locks and were kept under refrigeration till the time of analysis.
2.3. Extraction of Fat
Fat was extracted from the food item by taking 5 g from each item and then crushed into small pieces and then adding 100 ml of petroleum ether in it. The mixture was placed on shaker at the rate of 200 rpm for three hours. The samples were filtered and then the filtrate was stored in the refrigerator till further analysis [8].
2.4. Preparation of Fatty Acid Methyl Esters (FAMEs)
Filtrate (10 ml) of the extracted fat for each food sample was treated for methylation, by adding C2H5OH and concentrated H2SO4 in 1:1 ratio. The solution was heated at 50˚C for an hour, followed by the addition of distilled water and n-hexane (1:1), with continuous stirring. The mixture was transferred into the separatory funnel. Extraction was repeated for multiple times by adding distilled water, for the separation of organic layer [8].
2.5. Total Fat Analysis
For the determination of total fat content in extracted and methylated food samples, titrimetric method was used. To the extracted filtrate of known volume, solvent mixture of ethanol: diethyl ether (1:1) and few drops of 1% phenolphthalein in 95% ethanol was added as indicator. The solution was titrated against 0.1 M KOH till the appearance of a pink color as end point. The acid value was calculated by the following formula:
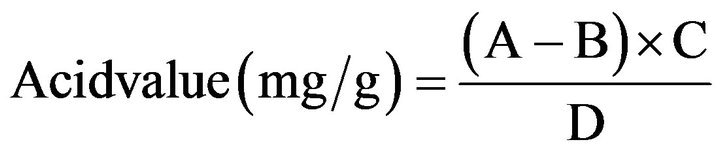
where A (ml) is the volume of titrant used, B (ml) is the volume of titrant used for blank, C (g/L) is the concentration of titrant and D (ml) is volume of sample titrated. From the acid value total fat content was calculated by multiplying it with the mass of the sample used (5 g).
2.6. Survey Analysis
A survey analysis was conducted using a questionnaire as a tool. It comprised of eleven items relevant to fast food consumption and related health issues. It was distributed to 90 consumers of fast food out of which 79 responded.
3. Results and Discussion
3.1. Acid Value and Total Fat Content
Results of titrimetric analysis showed that the total fat content in extracting chicken samples from Sample B was 25% lower than Sample A. However, in Sample C fried chicken showed an increase of 40% in fat content than in Sample B. For the French Fries the total fat had a remarkable increase of 46% and 38% in Sample A than Sample B and C respectively. Fried fish for Sample B, in contrast to earlier results showed higher total fat than other two outlets. In comparison of total fat in branded and Sample C food items, it was seen that Sample C had relatively lower concentration than branded sample (A and B). The total fat content was also analyzed after methylation. It was found (see Table 1) on comparison to extracted fat content, it was observed that methylation had no significant effect on fat content and it followed the same trend as: French fries > Fish > Chicken. However, methylated samples had far lower values that obtained in the extracted ones. Results of methylated samples showed (see Table 1) that the concentration of the unbranded samples were relatively higher than the Sample B. According to nutrition facts the amount of total fat intake (on a 2000 calorie diet) is 12 g or 18% daily value (DV)
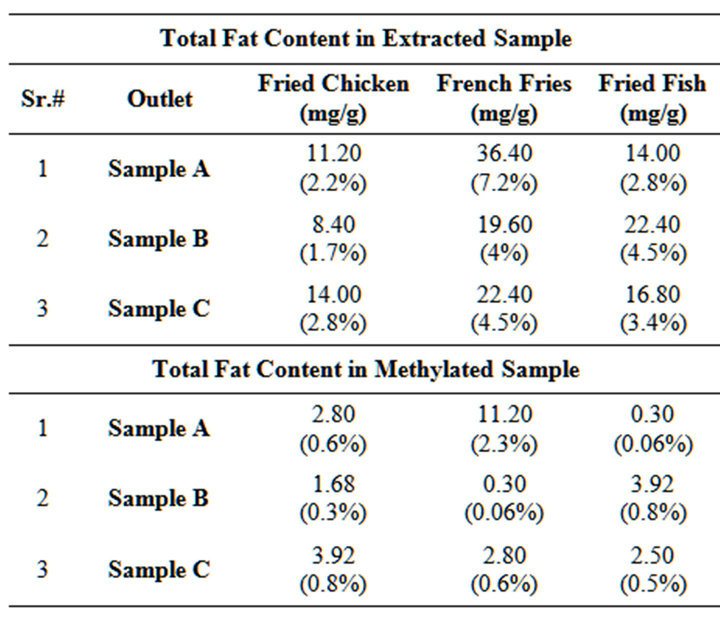
Table 1. Total fat content (in mg/g) in extracted and methylated food items.
while the results of the current study indicated that they were under the safe values [9].
3.2. Fatty Acid Concentration
From Table 2 (see Appendix) it can be drawn that the concentrations of three fatty acids were higher in methylated samples than extracted samples. The results of UV showed that the three fatty acids (myristic, oleic and stearic) were high in Sample B for fried chicken, Sample A for fried fish and Sample C for French fries. The concentration of stearic acid was higher in all the food items. Thus, the concentration of SFA was far greater in all the food items as compared to MUFA. According to another research the SFA in chicken, French fries was determined in the range of 26.90% - 46.18% and MUFA 32.95% - 45.60% which when compared to the study revealed that the obtained values were far less than other research [10]. Moreover, the daily value for saturated fatty acids (on a 2000 calorie diet) is 3 g or 15% and the study revealed 0.4 g or 7.6% which were securely under the allowable limit.
3.3. IR Data
Infrared spectra of samples were recorded in Shimazdu FTIR 8400, model Japan on KBr discs. All the spectra’s were scanned in the full wavelength range that is 3000 - 900 cm−1. A well established methyl peak of FAME was observed. The two lowest frequency bands 1300 cm−1 and 1400 cm−1 both underwent significant shifts from (1465 - 1460 cm−1 in chicken, French fries and fish) to lower frequencies upon methylation. An average shift of 6 cm−1 was noted down in methylated samples.
3.4. Fragmentation Analysis
Each extracted and methylated food samples were run on GC-MS spectrophotometer, (GCMS-QP5050A). The standards of three selected fatty acids were also run for comparison. The following conditions were used: helium gas as carrier gas, scan range from 10 - 700 amu, scan speed 31, column pressure 72 kPa. The volume injected was 0.5 μl with the temperature programming started at 170˚C, held for 2 minutes, and then increased to 200˚C at a rate of 10˚C minutes–1, maintained at 200˚C for 32 minutes [8].
The important peaks of significant intensities for stearic acid in chicken of Sample A appeared at m/z in 125.6, 127.85, 129.55, 130.6, 131.45, 132.3 and 278.05. It was observed that fried chicken of Sample B and Sample C outlets showed the same spectral pattern. In the methylated samples of stearic acid lower peaks like m/z 268 was only observed in Sample A chicken while m/z 274 peaks were present in both Sample A and Sample B’s chicken. On average the relative intensity was highest for Sample A m/z 21.03. The major peaks of oleic acid in chicken, French fries and fish of different outlets made their appearance at m/z 125.75, 127.85, and 128.65 in close proximity to each other; whereas the molecular ion peak with relative intensity of 100 was at 124. On the other hand, fish of Sample C outlet showed an additional peak at m/z 157.25. It may be due to the fact that Sample C fish was fried in oil with highly unsaturated fats. However, myristic acid significant peaks were observed highest in chicken samples for both the methylated and the unmethylated samples as compared to other food items. Chicken being richer in saturated and unsaturated fatty acids contained high concentration of all fatty acids as compared to fish and French fries.
The values of molecular ion peaks observed were in close agreement with the calculated mass of M+ ion. The fragmentation patterns are as follows (see Figure 1).
3.5. Survey Analysis
The questionnaire comprised of 11 questions provided
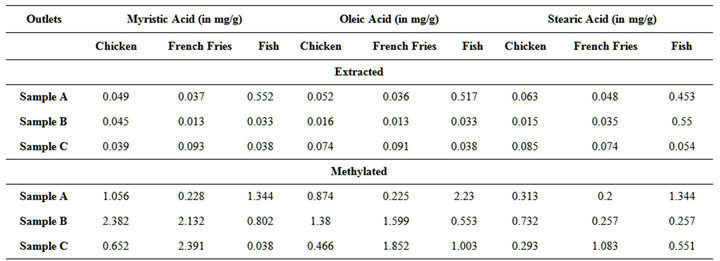
Table 2. Concentration (in mg/g) in extracted and methylated food items.
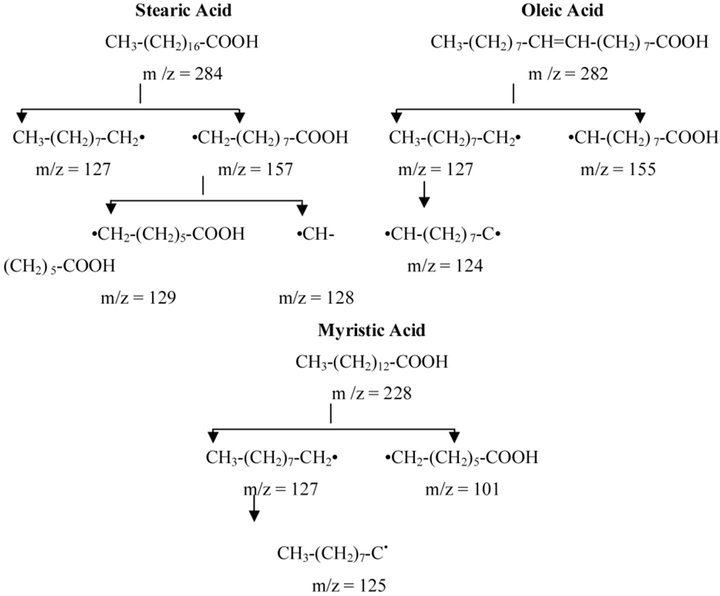
Figure 1. Fragmentation pattern of stearic acid oleic acid myristic acid.
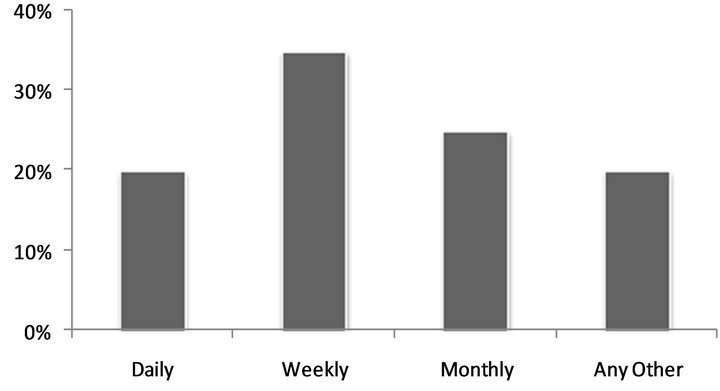
Figure 2. Frequency of visits to fast food outlets.
with the information on gender, age and qualification. People who visited fast food outlets once a week were 35% while on a monthly basis were 25%. People who ate daily had a close percentage with the people who ate once a month which was only a difference of (5%) (See figure 2). These percentages revealed the attitude of people towards fast foods. The highest percentage was received for daily and weekly combined (55%). This was due to the fact that people liked the taste of fast food restaurants. Data showed that 70% people preferred eating branded fast food because it was tasty while 11% people opted for Sample C food for its good taste while 13% people eat fast food because they have no time for cooking.
The most popular food item found among all the age groups was Burger 31% followed by fried chicken 24%. 23% agreed with French fries while 22% people preferred eating fried fish at fast foods (see Figure 3). The consumption rate of fast foods was observed high because people are unable to take out time from their daily chores. Research reveals that children who consume large amount of fast foods are more likely to experience recurrent abdominal pain than others, and this may be severe enough to interfere with school activities. On the other hand, a diet rich in fruits and vegetables does not cause any abdominal problems [11].
Obesity is a major issue all around the world and this problem is spreading fast in Pakistan too. This is all due to the excessive consumption of these fast food items as seen above from the results. People are eating more fried items than healthy salads and baked items. Out of the 79 respondents 56% of the people believed that the most widely health effects of eating fried foods are stomach
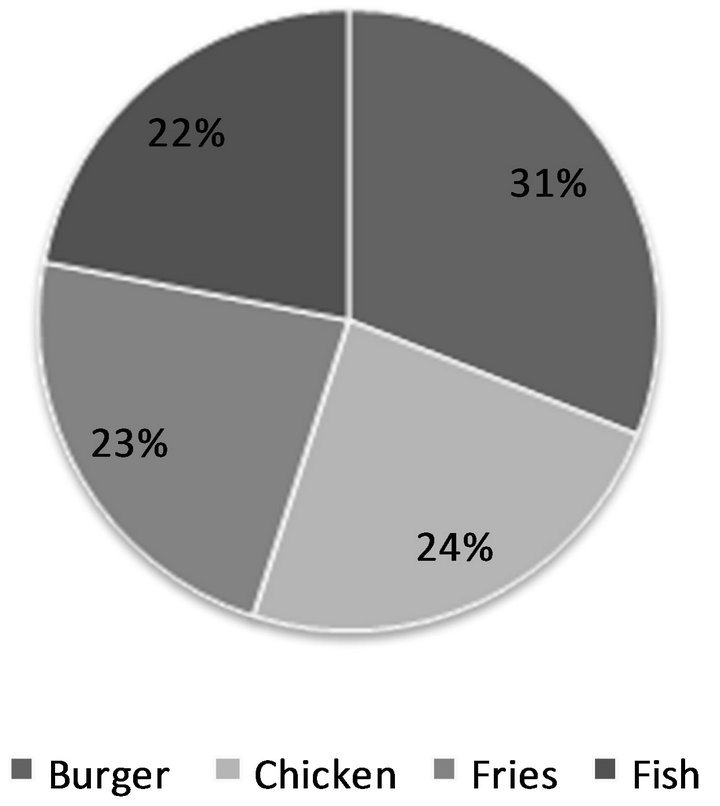
Figure 3. Relationship of different food items and its popularity.
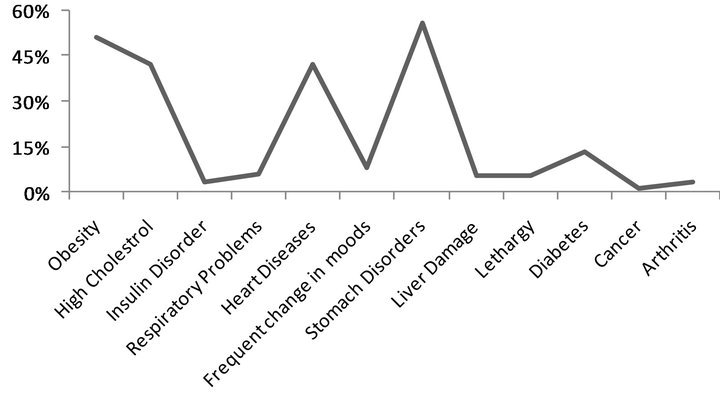
Figure 4. Fried foods health implications.
disorders (see figure 4). There were similar number of votes for high cholesterol and heart diseases.
4. Conclusion and Recommendations
The research results indicated that fatty acids were present in the fried foods; either in higher or in lower amounts, but each one of them was under the safe limits. The study was successful in determining the amount of fatty acids in each sample and the consumers’ response through the questionnaire which proved the hypothesis that fried foods were the most widely consumed products these days. More importantly, consumers had little knowledge of the severe health effects that the fried food items could cause either branded (Sample A and B) or unbranded (Sample C) product they were consuming. There was little difference in the amounts of fatty acids determined between the branded and the unbranded as in some samples that the amount was more in the branded as compared to the unbranded. Fried foods yet could not be considered as healthy foods even though the fatty acid concentration were under the limit because frequent and excessive intake of fried foods may lead to serious health problems. Therefore, it was recommended to consume protein rich foods such as fish, skinless chicken, fat free dairy products etc. foods that were naturally low in fat and soluble fibers like oats, rice, cereals etc. Additionally, food labels should be checked for saturated fats, hydrogenated and partially hydrogenated fats before taking any food item.
REFERENCES
- Z. Fang, Z. W. Chen, Z. Xian, S. Y. Rui, L. G. Juan and Y. J. Mao, “Determination of Free Fatty Acids by High Performance Liquid Chromatography with Fluorescence Detection and Identification with Mass Spectrometry,” Chinese Journal of Analytical Chemistry, Vol. 35, No. 4, 2007, pp. 489-494. doi:10.1016/S1872-2040(07)60045-0
- H. W. Lawson, “Standards for Fats and Oils,” The Publishing Company, Westport, 1985.
- L. M. Smith, A. J. Clifford, R. K. Creceling and C. L. Hamblin, “Lipid Content and Fatty Acid Profiles of Various Deep-Fat Fried Foods,” Journal of the American Oil Chemists Society, Vol. 62, No. 6, 1985, pp. 996-999. doi:10.1007/BF02935700
- D. P. Houhoula, V. Oreopoulou and C. J. Tzia, “A Kinetic Study of Oil Deterioration during Frying and a Comparison with Heating,” Journal of the American Oil Chemists’ Society, Vol. 79, No. 2, 2002, pp. 133-137. doi:10.1007/s11746-002-0447-0
- H. Gloria and J. M. Aguilera, “Assessment of the Quality of Heated Oils by Differential Scanning Calorimetry,” Journal of Agricultural and Food Chemistry, Vol. 46, No. 4, 1998, pp. 1363-1368. doi:10.1021/jf9703664
- W. L. Clark and G. W. Serbia, “Safety Aspects of Frying Fats and Oils,” Food Technology, Vol. 45, No. 2, 1991, pp. 84-89.
- C. C. Akoh and D. B. Min, “Food Lipids: Chemistry, Nutrition and Biotechnology,” 2nd Edition, Marcel Dekker, New York, 2002. http://www.stu.edu.vn/uploads/documents/030509-215944.pdf
- H.-Q. Wu, X.-L. Huang, X.-S. Lin, F. Huang, Z.-X. Zhu and Y.-F. Ma, “Gas Chromatographic Retention Time Rule and Mass Spectrometric Fragmentation Rule of Fatty Acids and Its Application in Food,” Chinese Journal of Analytical Chemistry, Vol. 35, No. 7, 2007, pp. 998-1003. doi:10.1016/S1872-2040(07)60065-6
- US Department of Agriculture and Health and Human services, “Dietary Guidelines for Americans,” 2010. http://webarchive.library.unt.edu/eot2008/20080916042652/http://www.health.gov/dietaryguidelines/dga2005/healthieryou/html/chapter8.html
- F. Anwar, M. Bhanger, S. Latif and M. Manzoor, “Lipid content and Fatty Acid Composition of Some Deep Fried and Fast Foods from Sindh,” Journal of Chemistry, Vol. 28, No. 4, 2006, pp. 374-379.
- P. Observer, “Weight Problem in Pakistan,” 2010. http://pakobserver.net
NOTES
*Corresponding author.