Journal of Biomaterials and Nanobiotechnology
Vol.4 No.2A(2013), Article ID:29819,9 pages DOI:10.4236/jbnb.2013.42A001
Growth Enhancement of Dunaliella salina by Microbubble Induced Airlift Loop Bioreactor (ALB)—The Relation between Mass Transfer and Growth Rate
![]()
1Department of Chemical and Biological Engineering, University of Sheffield, Sheffield, UK; 2Department of Molecular Biology and Biotechnology, University of Sheffield, Sheffield, UK.
Email: cpp09ky@sheffield.ac.uk
Copyright © 2013 Kezhen Ying et al. This is an open access article distributed under the Creative Commons Attribution License, which permits unrestricted use, distribution, and reproduction in any medium, provided the original work is properly cited.
Received January 15th, 2013; revised February 17th, 2013; accepted April 4th, 2013
Keywords: Airlift Bioreactor; Fluidic Oscillator; Dunaliella salina; Specific Growth Rate
ABSTRACT
The efficiency of a novel microalgal culture system (an airlift loop bioreactor [ALB] engaged with a fluidic oscillator to produce microbubbles) is compared with both a conventional ALB (producing fine bubbles without the fluidic oscillator) and non-aerated flask culture. The impact of CO2 mass transfer on Dunaliella salina growth is assessed, through varying the gas (5% CO2, 95% N2) dosing flow rate. The results showed that approximately 6 - 8 times higher chlorophyll content was achieved in the aerated ALB cultures than in the non-aerated flasks, and there was a 20% - 40% increase in specific growth rate of D. salina in the novel ALB with microbubbles when compared with the conventional ALB cultures. The increase in chlorophyll content was found to be proportional to the total amount of CO2 mass transfer. For the same dosing time and flow rate, higher CO2 mass transfer rate (microbubble dosing) resulted in a greater growth rate.
1. Introduction
Microalgae have been considered for CO2 capture from flue gas by many industries recently, due to their high CO2 uptake efficiencies which are one order of magnitude (10 to 50 times) higher than those of terrestrial plants [1]. Industry is one of the major CO2 producers and fossil fuel consumers, responsible for more than 7% of total world CO2 emissions [2], while the flue gas produced, containing various percentages of CO2, actually can provide a carbon-rich source for microalgae cultivation. Microalgae capture CO2 for their growth, saving the costs of adding CO2 scrubbing systems [3]. Some microalgae species show a good tolerance to NOx/SOx, and can even capture them as nutrients for growth [4,5]. The products from microalgae culture can be used as food, animal feed, fertilizers, valuable chemicals and as a source of biofuel production etc. [6,7]. These high value commercial products can be expected to offset the capital and operating costs.
Many studies have demonstrated the correlation between light intensity and algal productivity based on the assumption of unlimited CO2 supply, however, in practice CO2 mass transfer was always limited due to conventional bubble dosing. In order to achieve sufficient CO2 dissolution, higher dosing rate and longer dosing time (e.g. 24 hrs/d) were employed to compensate for the lower mass transfer. Nevertheless, by doing so, under higher aerating flow rate, most of the gas was wasted due to low mass transfer, and the intensive agitation could cause damage to the algal cells. Besides, longer dosing time means more energy consumption which would result in a low yield/power ratio. Therefore, design of a CO2 dosing system with a relatively high gas mass transfer and low energy cost tends to be a major consideration for cost-competitive microalgae culture. Since an energy efficient microbubble dosing system has been developed [8] and proved to have a relatively higher mass transfer coefficient than normal bubble dosing [9,10], the same level of dissolved CO2 concentration can be achieved at relatively lower dosing flow rate, consequently, considerable energy saving along with higher productivity will be made. To further study the impact of microbubbles produced by fluidic oscillation, a range of ALB bench cultures of D. salina were set up to discover 1) the contrast between aerated ALB cultures and non-aerated flask cultures, 2) the difference between microbubble dosing and fine-bubble dosing and 3) the correlation between mass transfer and D. salina growth.
2. Materials and Methods
2.1. Design of Lab Scale Airlift Loop Bioreactor (ALB)
Zimmerman et al. [11] introduced the design of the microbubble mediated ALB for a large lab scale 250 L volume. To further study the impact of using innovative ALB on microalgal cultivation, twelve 3L-ALBs were made for screening purposes, based on a similar design. Figure 1 shows the configuration of a 3L-ALB. Generally, the bioreactor is made of acrylic material, with the dimension of 285 mm in height and 124 mm in diameter. The air lift loop design consists of a ceramic diffuser (diameter of 78 mm, pore size of 20 µm) fixed at bottom and an internal draught tube (H: 170 mm, D: 95 mm) hung 30 mm above the diffuser. The flow pattern of airlift loop has been discussed in detail in previous studies [9,10,12].
2.2. Experimental Setup and Processes
The experimental setup for lab bench ALB cultures is shown in Figure 2. Generally, twelve ALBs were arranged into two rows. Each row contains a flask culture and five ALB cultures under different dosing conditions (0.3 L·min−1, 0.5 L·min−1, 0.7 L·min−1, 0.9 L·min−1 and 1.1 L·min−1, all under 1 atm pressure). For each ALB culture flow rate was monitored through the rotameter directly connected to the output port of ALB. For the five ALBs connected to a fluidic oscillator (FO) CO2 was dosed through microbubbles (300 µm), while another five ALBs were dosed with fine-bubbles (600 µm). The two flask cultures (without gas dosing) were run in parallel for error estimates. Two fluorescent lamps, one per each row, provided continuous illumination of 90 µmol·m−2·s−1. The temperature for each culture was maintained around 24˚C, due to the empirical heat transfer from the fluorescent lamps. The algal species for this study was Dunaliella salina [12], which has a wide pH range from 6 to 9. The strain was obtained from the Culture Centre of Algae and Protozoa, SAMS, Oban, UK as CCAP 19/30. The unbuffered culture medium i.e. without 20 mM HEPES buffer, is shown in Table 1.
D. salina was pre-cultured in a growth room (25˚C ± 2˚C, light intensity 50 µmol·m−2·s−1) in a similar culture medium, but with added HEPES (20 mM) as a buffer (pH 7.5). At the beginning of the main experiments, 50 ml of pre-cultured D. salina was added to 2.5 L of fresh culture medium for each culture. Each ALB culture was

Figure 1. The structure of a 3 L airlift loop bioreactor.

Figure 2. Schematic setup of ALB cultures.
Table 1. D. salina culture medium.

dosed with CO2 enriched gas (5% CO2, 95% N2) for 30 minutes per day. 50 ml algal samples were taken after gas dosing or mixing (for flask cultures), followed by topping up the culture with 50 ml of fresh medium. pH and DO levels in each of the bioreactors were measured daily before and after gas dosing using a SevenGo Duo Pro pH/DO meter.
2.3. Analysis Methods
2.3.1. Measurements of Algal Growth
The chlorophyll content of the samples of D. salina culture taken each day was determined by measuring the optical density at wavelengths of 645 nm and 663 nm using the method described by Zimmerman et al. [12]. The overall specific growth rate were obtained at the end of the culture growth period as described by Scragg [13], which was estimated from the slope of a semilog plot of ln(Ct/C0) versus t.
2.3.2. Measurements for CO2 Uptake Estimation
The CO2 concentration dissolved in the medium was calculated from the current pH using Equation (2), of which the detailed derivation is shown in Appendix A.
 (2)
(2)
Each day, the difference between the concentration of dissolved CO2 before and after dosing, calculated based on the pH, indicates the amount of CO2 that has been transferred into the medium (dosed CO2). The reading taken the following day before dosing indicates the decrease in the dissolved CO2 and gives the amount of CO2 uptake by D. salina.
3. Results and Discussion
3.1. Comparisons between ALB Culture and Conventional Flask Culture
3.1.1. Chlorophyll Content
Figure 3 gives the plot of chlorophyll content versus culture time for ALB cultures and flask cultures. Generally, the D. salina cells cultured in ALB, either with or without fluidic oscillator engaged, were growing faster compared with the flask culture. As can be seen in Figure 3, for the flask culture, without daily gas supply the microalgae were growing relatively slowly, with the chlorophyll content increasing from about 0.15 mg·L−1 to eventually 4.30 mg·L−1 through 18 days. In contrast, the algal chlorophyll content in all ALB cultures increased from the similar initial concentration to an even higher point (4.73 - 7.24 mg·L−1) within only 6 days. For these ALB cultures, the active growth phase started from the third day and lasted about 13 days, with the peak varying from 26.43 to 32.65 mg·L−1 (depending on flow rate and dosing method). Entry into stationary phase was observed after about 15 days. In general, about 6 - 8 times higher chlorophyll content was achieved in ALB cultures

Figure 3. D. salina growth in ALBs and in flasks. FO stands for the culture with fluidic oscillator, NoFO represents the culture without oscillator, and “control” means the control experiment (the flask cultures). The number in front of these abbreviations indicates the dosing flow rate (e.g. 0.3 stands for 0.3 L·min−1 of dosing flow rate). Due to the laboratory limitations, only the control experiment and the culture dosed under 0.3 L·min−1 using oscillator were repeated, with the error bars shown in the diagram.
than in the flask cultures for the same culture period. It is easily understood that the ALB engaged with microbubble/fine-bubble dosing enables a high mass transfer of CO2 dissolution and O2 removal, which makes the culture both CO2 sufficient and O2 stripped, therefore, algae grew better in such “well served” circumstances. Zimmerman et al. [12] demonstrated a pilot scale microalgal culture using a similar design of ALB as in this study, the results also showed that such ALB culture was neither CO2 limited nor O2 inhibited, which led to a high algal growth rate.
3.1.2. pH Changes
Apart from the relatively higher CO2 mass transfer and an appreciable O2 stripping by “micro/fine-bubbling”, a better pH control is also one of the reasons that explain why ALB cultures exceeded the flask cultures in productivity. Commonly, pH in the culture medium increases as the algae grows, and when the pH increases beyond the optimum range, the culture may be adversely affected. As algae grow, the photosynthetic uptake of CO2 leads to the increase in pH, but as a consequence of increasing pH, 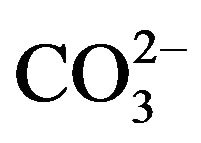 increases while
 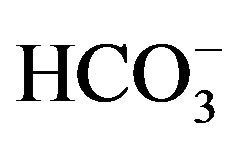 and CO2 decrease, which inhibits the photosynthetic reaction and improves the rate of algal respiration [14]. Therefore, for many algal cultures, either buffer solutions (e.g. HEPES) are usually included in culture medium or acid is added when pH increases over a suitable level via an auto-controlled system. However, in this study, neither buffer solution nor acid is added, because it was expected that the increasing pH could be neutralized by daily CO2 supply via microbubble dosing technique, and indeed the results strongly supported this hypothesis.
Figure 4 shows the daily pH changes in ALB cultures (either with or without fluidic oscillator) and in control experiment (flask cultures). For control experiment, because of the absence of CO2 supply and the accumulation of O2, D. salina grew relatively slowly in the first 9 days, with its chlorophyll content increased from 0.15 mg·L−1 to only 3.04 mg·L−1 (Figure 3). Correspondingly, its pH also increased slowly, rising from 7.9 to 9.1 through the first 9 days (Figure 4). However, after 9 days the pH barely increased and was maintained at 9.1 - 9.5, whilst the algae almost stopped growing as well, with its chlorophyll content maintained at 3.04 - 3.33 mg·L−1. One of the reasons is that, after pH went above 9 the culture was inhibited, because for most microalgae the suitable pH ranges from 6 to 9 [15], and over this range inhibition of
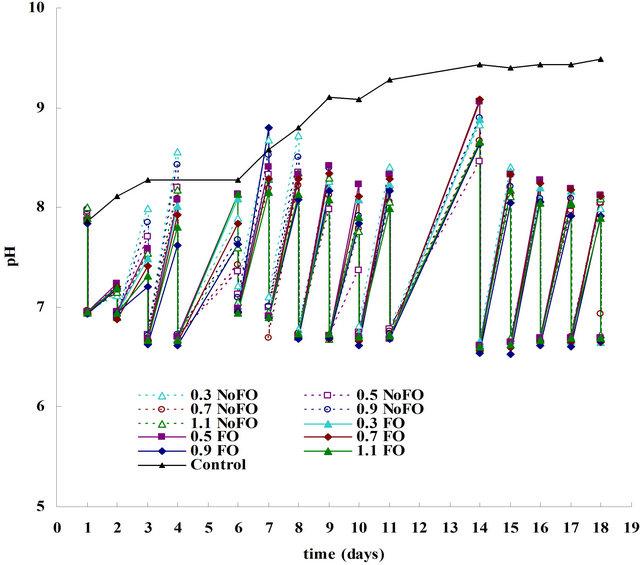
Figure 4. Plot of pH changes versus culture time for ALB cultures and control culture. For ALB cultures (either with or without fluidic oscillator), there are two pH values per day, a higher one and a lower one, representing the pH value before and after CO2 dosing, respectively.
growth occurs. In terms of ALB cultures (FO engaged or not), chlorophyll increased dramatically (from around 0.05 - 0.15 mg·L−1 to 26.43 - 32.65 mg·L−1) until the growth entered steady phase (the last 3 days). Correspondingly, pH was supposed to rise even faster than control culture, however, due to daily micro-bubble (300 μm) or fine-bubble (600 μm) dosing, the culture pH was maintained in a suitable range of 6.5 - 8.5 (Figure 4). As can be seen, for each day, after 30 min of 5% CO2 dosing, pH was reduced to around 7, but because of the desirable culture condition (CO2 unlimited and O2 free), pH increased back to about 9 within only one day. The next day, another 30 min of dosing dragged it back to around 7 again. Such a virtuous cycle kept pH within a desirable range, making the culture also not limited by pH.
One thing needs to be clarified that for all ALB cultures in this study, the pH value seems to be similar despite the different dosing flow rates or dosing methods. But theoretically, for various dosing conditions with different mass transfer capabilities, the dissolved CO2 in the culture medium differs, correspondingly, the pH value indicating the amount of dissolved CO2 differs as well. Such a ‘contradiction’ can be explained by Table 2. As can be seen, one magnitude of difference in the concentration (mol/L) of dissolved CO2 only changes the pH by one unit, while the difference in the total CO2 mass transfers (daily) for this study are in the range of 10−4 to 10−3 mol/L, for different dosing conditions. Therefore, the difference in the pH value was barely affected by the different mass transfer capabilities. This also supports the hypothesis that the pH was scientifically controlled in the study, and it can be considered as a controlled parameter when comparing the impact of mass transfer on the algal growth (see 3.2).
3.2. Comparisons between FO Engaged ALB Culture and Conventional ALB Culture
3.2.1. Effect of Fluidic Oscillator (Comparing Microbubble Dosing with Fine Bubble Dosing)
Figure 3 shows the comparison between the ALB cultures with fluidic oscillator engaged and normal ALB
Table 2. The corresponding dissolved CO2 for different pH values. The amount of CO2 was calculated based on Equation (2) and on the particulate NaHCO3 concentration in medium.

culture. Generally, for each dosing flow rate D. salina grew better in FO engaged ALBs (microbubble dosing) than in normal ALBs (fine-bubble dosing). The peak chlorophyll content reached 27.03 - 32.65 mg·L−1 when FO was applied, while only 23.13 - 26.47 mg·L−1 was achieved without FO. To quantify the comparison of D. salina growth under different dosing conditions, the overall specific growth rate was estimated from the slope of a semilog plot of ln(Ct/C0) versus time. Hence the specific growth rate under each ALB dosing condition was obtained, which was plotted in Figure 5. Generally, fluidic oscillator engaged ALB cultures presented a higher algal specific growth rate (μ), showing an approximately 20% - 40% enhancement compared with conventional ALB cultures. The highest specific growth rate (near 0.13 d−1) for normal ALB culture was achieved at a dosing flow rate of 1.1 L·min−1, while the similar specific growth rate for ALB culture (with FO) was achieved at only 0.1 L·min−1, which shows a considerable energy saving potential.
3.2.2. Effect of Flow Rate (Comparing the Impact of Different Dosing Flow Rates on D. salina Growth)
Generally, the specific growth rate (μ) was found to increase along with dosing flow rate, either with or without FO engaged. The maximum μ of 0.13 d−1 and 0.17 d−1 was achieved at flow rate of 0.9 L·min−1 (without FO) and at 1.1 L·min−1 (with FO), respectively. This overall trend was found similar to gas-liquid mass transfer study [10] (see Figures S1(a) and (b) in Supplementary information). Considering both algal specific growth rate
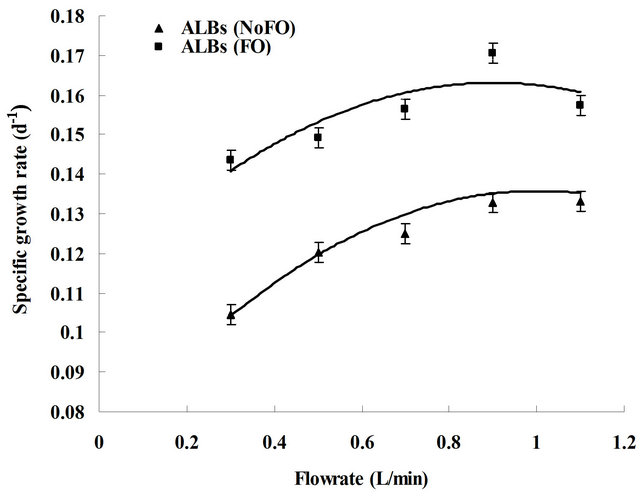
Figure 5. Plots correlating the overall specific growth rate with CO2 dosing flow rate for both ALB cultures with and without fluidic oscillator. Due to the lab limitations, the error bars shown in this figure was obtained from the duplication of one ALB culture (0.3 L·min−1 FO, randomly chosen).
(Figure 5) and mass transfer coefficient (Figures S1(a) and (b)) under different dosing flow rates, the algal growth appears to be correlated to mass transfer via following hypothesis.
For the ALB cultures with fine-bubble dosing (NoFO), within the flow rate range of 0.3 - 1.1 L·min−1, mass transfer coefficient Kla (either for CO2 dissolution or for O2 removal) increased with flow rate, and consequently CO2 dissolution and O2 stripping efficiency were enhanced. The culture therefore had more dissolved CO2 available for algal uptake and less O2 inhibition. Thus, specific growth rate increased as the flow rate went up. The same scenario was observed for the novel ALB cultures (microbubble dosing) under the flow rate of 0.3 - 0.7 L·min−1. However, the specific growth rate did not significantly increase by further increasing the flow rate when it exceeded 0.7 L·min−1. This can be explained by assuming that for 0.3 - 1.1 L·min−1 of dosing (ALB cultures, NoFO) and 0.3 - 0.7 L·min−1 of dosing (ALB cultures, FO), the daily total amount of CO2 mass transfer (average CO2 mass transfer rate × dosing time) did not reach or exceed the saturation concentration, therefore higher mass transfer led to a greater amount of available CO2, which consequently resulted in a higher growth rate. For the flow rate of 0.9 - 1.1 L·min−1 with mcirobubble dosing, the total CO2 mass transfer is likely to be excessive (average CO2 mass transfer rate × dosing time > CO2 saturation). The extra CO2 was therefore released to the atmosphere and did not contribute to the algal growth. Thus increasing the flow rate over a valid range may not effectively improve the growth. Based on the above discussion, 30 min·d−1 of dosing under 0.7 L·min−1, close enough to reach CO2 saturation, turns out to be the optimal dosing condition for the 3L-ALB culture (with microbubble dosing).
3.3. Relation between CO2 Mass Transfer and D. salina Growth
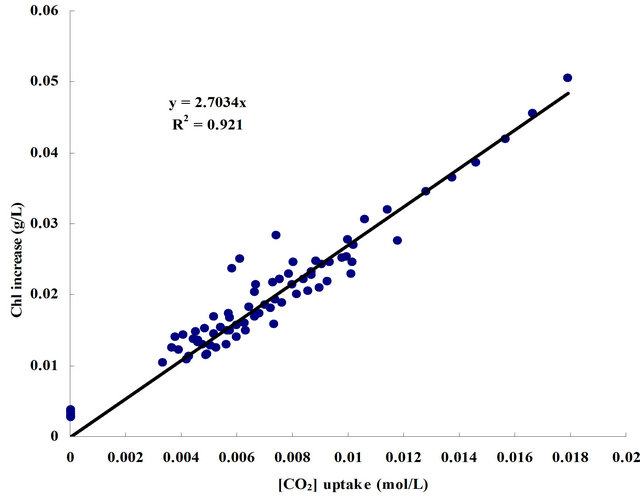
For the ALB cultures under each condition, the amount of total CO2 uptake and the increase in the chlorophyll content were calculated for certain culture periods, which are shown in Figure 6(a). The chlorophyll content increase shown was found commensurate with the amount of CO2 uptake within the same culture period. It can be simply understood by the basic photosynthetic equation 6CO2 (aq) + 12H2O (liq) + photons → C6H12O6 (aq) + 6O2 (g) + 6H2O (liq), the amount of algal growth is speculated to be proportional to the CO2 concentration. An equation describing the relation between chlorophyll increase and CO2 consumption for the D. salina cultures in this study is therefore obtained via linear regression.
 (3)
(3)
Therefore, an assumption can be made that in the same time period, the CO2 uptake rate should be proportional to the instant algal concentration (chlorophyll content), which is shown as follows:
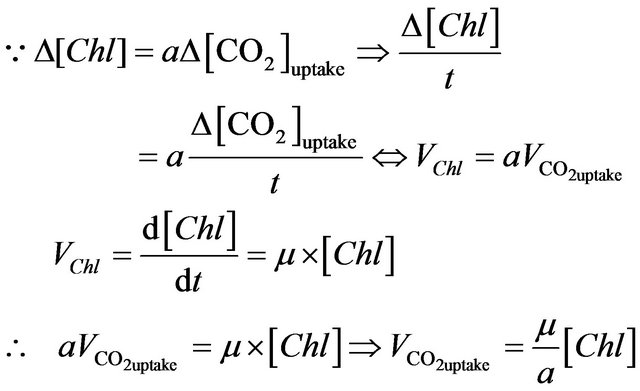
where μ is the overall specific growth rate (constant for a certain culture condition); VChl and 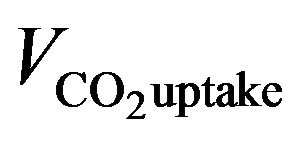 represent chlorophyll growth rate and CO2 uptake rate, respectively; [Chl] and [CO2] mean the chlorophyll content and CO2 concentration, separately.
Indeed, the experimental data, shown in Figure 6(b), strongly support this assumption. The daily CO2 uptake rate is in direct proportion to the concentration of chlorophyll content, of which the equation is shown as
 . (4)
. (4)
In order to correlate the algal growth to CO2 mass transfer, the correlations between the amount of CO2 uptake and the CO2 transferred to the liquid still needs to be understood, which is presented in Figure 6(c). As can be seen, the amount of daily CO2 uptake was equal to the valid amount of CO2 dosed, which can be described as:
 , (5)
, (5)
where  represents CO2 average mass transfer rate; tdosing means the dosing time.
By combining Equation (3) and Equation (5), it gives
 . (6)
. (6)
From Equation (6), the chlorophyll content increase has been shown to be in direct proportion to the mass transfer rate for the ALB cultures in this study, which again explains why the ALB cultures with microbubble dosing have higher growth rates than the ones with finebubble dosing.
4. Conclusions
An about 6 to 8 times enhancement of D. salina growth was found in ALB cultures, compared with the flask incubation. Instead of buffer solution (e.g. HEPES), daily 30 minutes of 5% CO2 gas dosing maintained pH at a suitable level (6.5 - 8.5). Besides approximately 20% -
 (a)
(a)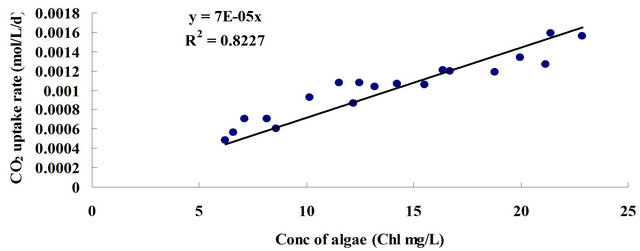 (b)
(b) (c)
(c)
Figure 6. (a) The relation between CO2 uptake and algal growth (based on chlorophyll increase); (b) Plot of CO2 uptake versus concentration of chlorophyll content; (c) Plot of CO2 uptake versus CO2 input. (a) For each dosing condition, the total amount of chlorophyll content increase within X days (day1 - dayX) was represented in Y-axis, and the total amount of CO2 uptake within X days was represented in X-axis. X was taken as 6, 7, 8, 9 and 10; (b) The data come from the ALB cultures with microbubble dosing under 0.7 L·min−1, 0.9 L·min−1 and 1.1 L·min−1, for which the daily CO2 dosing were excessive (average CO2 mass transfer rate × dosing time ≥ CO2 saturation); (c) The amount of dissolved CO2 in the medium was calculated based on pH (Equation (2)). For each day, the changes in the amount of dissolved CO2 before and after dosing indicate the valid dosed [CO2]. Till the following day before dosing, the decrease in the amount of [CO2] gives the amount of CO2 uptake by the algae. Data come from the ALB cultures with bubble dosing which did not exceed the valid range (average CO2 mass transfer rate × dosing time < CO2 saturation), including all the ALB cultures with fine bubble dosing and the ALB cultures with microbubble dosing at 0.3, 0.5, 0.7 L·min−1.
40% increase in specific growth rate was found in the FO engaged ALB cultures, over a wide range of gas dosing flow rate. Furthermore, the chlorophyll content (growth) was found to be directly proportional to the mass transfer rate for D. salina ALB cultures. Further modelling of these observations is being carried out.
5. Acknowledgements
WZ would like to thank the Royal Society for a Brain Mercer Innovation Award. We acknowledge support for microbubble dynamics from EPSRC. DJG would like to acknowledge support from Carbon Trust.
REFERENCES
- Y. Li, M. Horsman, B. Wang, N. Wu and C. Q. Lan, “Effects of Nitrogen Source on Cell Growth and Lipid Accumulation of Green Alga Neochloris oleoabundans,” Applied Microbiology and Biotechnology, Vol. 81, No. 4, 2008, pp. 629-636. doi:10.1007/s00253-008-1681-1
- N. Sakai, Y. Sakamoto, N. Kishimoto, M. Chihara and I. Karube, “Chlorella Strains from Hot Springs Tolerant to High Temperature and High CO2,” Energy Conversion and Management, Vol. 36, No. 6-9, 1995, pp. 693-696. doi:10.1016/0196-8904(95)00100-R
- B. Wang, Y. Li, N. Wu and C. Q. Lan, “CO2 Bio-Mitigation Using Microalgae,” Applied Microbiology and Biotechnology, Vol. 79, No. 5, 2008, pp. 707-718. doi:10.1007/s00253-008-1518-y
- H. Matsumoto, A. Hamasaki, N. Sioji and Y. Ikuta, “Influence of CO2, SO2 and NO in Flue Gas on Microalgae Productivity,” Journal of Chemical Engineering of Japan, Vol. 30, No. 4, 1997, pp. 620-624. doi:10.1252/jcej.30.620
- H. Nagase and K. Eguchi, “Improvement of Microalgal Nox Removal in Bubble Column and Airlift Reactors,” Journal of Fermentation and Bioengineering, Vol. 86, No. 4, 1998, pp. 421-423. doi:10.1016/S0922-338X(99)89018-7
- P. Chelf, L. M. Brown and C. E. Wyman, “Aquatic Biomass Resources and Carbon Dioxide Trapping,” Biomass Bioenergy, Vol. 4, No. 3, 1993, pp. 175-183. doi:10.1016/0961-9534(93)90057-B
- M. A. Borowitzka and L. J. Borowitzka, “Micro-Algal Biotechnology,” Cambridge University Press, Cambridge, 1988.
- W. B. Zimmerman, V. Tesar and H. C. H. Bandalusena, “Towards Energy Efficient Nanobubble Generation with Fluidic Oscillation,” Current Opinion in Colloid & Interface Science, Vol. 16, No. 4, 2011, pp. 350-356. doi:10.1016/j.cocis.2011.01.010
- M. K. H. Mashhadani, H. C. H. Bandalusena and W. B. Zimmerman, “CO2 Mass Transfer Induced through an Airlift Loop by a Microbubble Cloud Generated by Fluidic Oscillation,” Industrial & Engineering Chemistry Research, Vol. 51, No. 4, 2012, pp. 1864-1877. doi:10.1021/ie200960v
- K. Ying, K. H. M. Al-Mashhadani and W. B. Zimmerman, “The Effect of Flow Rate on Enhancement of O2 Removal and CO2 Dissolution by Using Novel Microbubble Generation System in Airlift Bioreactor,” Unpublished, 2012.
- W. B. Zimmerman, B. N. Hewakandamby, V. Tesar, H. C. H. Bandalusena and O. A. Omotowa, “On the Design of Simulation of an Airlift Loop Bioreactor with Microbubble Generation by Fluidic Oscillation,” Food and Bioproducts Processing, Vol. 87, No. 3, 2009, pp. 215-227. doi:10.1016/j.fbp.2009.03.006
- W. B. Zimmerman, M. Zandi, H. C. H. Bandulasena, V. Tesar, D. J. Gilmour and K. Ying, “Design of an Airlift Loop Bioreactor and Pilot Scales Studies with Fluidic Oscillator Induced Microbubbles for Growth of a Microalgae Dunaliella Salina,” Applied Energy, Vol. 88, No. 10, 2011, pp. 3357-3369. doi:10.1016/j.apenergy.2011.02.013
- A. H. Scragg, “Bioreactors in Biotechnology: A Practical Approach,” Ellis Horwood, London, 1991, pp. 47-48.
- N. E. Steenman, “Marine Photosynthesis with Special Emphasis on the Ecological Aspects,” Elsevier Scientific Publishing Co., New York, 1975.
- P. Coutteau, “Micro-Algae,” In: P. Lavens and P. Sorgeloos, Eds., Manual on the Production and Use of Live Food for Aquaculture, FAO Fisheries Technical Paper No. 361, Laboratory of Aquaculture & Artemia Reference Center, University of Gent, Belgium, 1996.
- K. Livansky, “Losses of CO2 in Outdoor Mass Algal Cultures: Determination of the Mass Transfer Coefficient KL by Means of Measured pH Course in NaHCO3 Solution,” Algological Studies, Vol. 58, 1990, pp. 87-97.
- R. F. Camacho, “Prediction of Dissolved Oxygen and Carbon Dioxide Concentration Profiles in Tubular Photobioreactors for Microalgal Culture,” Biotechnology and Bioengineering, Vol. 62, No. 1, 1999, pp. 71-84. doi:10.1002/(SICI)1097-0290(19990105)62:1<71::AID-BIT9>3.0.CO;2-T
Appendix: [CO2] Estimation Based on pH in Medium (with NaHCO3)
The dissolved CO2 is in equilibrium with  and
and , which can be described by the following chemical reactions [16,17].


where the relevant equilibrium constants are:


 .
.
The system must satisfy the electro-neutrality constraint, therefore

Assuming constant concentrations of other cations and anions, it gives

By solving above equations, it gives
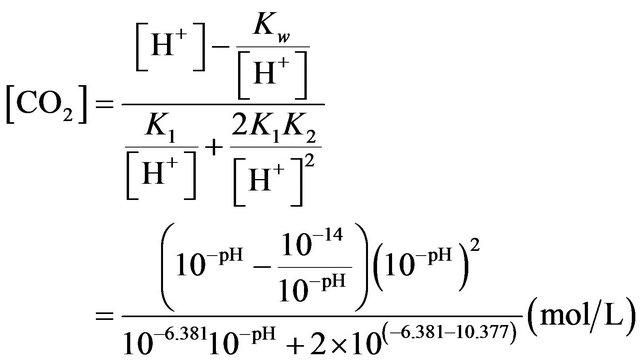 (1)
(1)
However Equation (1) can only be used to calculate the concentration of CO2 in water and when the pH is less than 7. For the [CO2] estimation in the medium containing NaHCO3 modification needs to be made. The system would still need to satisfy the electro-neutrality constraint. But since NaHCO3 is added into medium, other cations and anions are not equal.

Therefore, the additional amount of Na+ needs to be taken into consideration:

Finally, Equation (1) is modified as:
 (2)
(2)
Supplementary Information: The Relation between Mass Transfer and Dosing Flow Rate

(a)

(b)
Figure S1. (a) Effect of FO on mass transfer coefficient for carbon dioxide dissolution; (b) Effect of FO on mass transfer coefficient for oxygen removal [10].

