Agricultural Sciences
Vol.3 No.2(2012), Article ID:18377,6 pages DOI:10.4236/as.2012.32017
Effects of planting dates, densities, and varieties on ecophysiology of pigeonpea in the Southeastern United States
![]()
1Department of Biological Sciences, Tennessee State University, Nashville, USA; *Corresponding Author: dhui@tnstate.edu
2Key Laboratory of Vegetation Restoration and Management of Degraded Ecosystems, South China Botanic Garden, Chinese Academy of Sciences, Guangzhou, China
3Department of Agricultural and Environmental Sciences, Tennessee State University, Nashville, USA
Received 2 November 2011; revised 20 December 2011; accepted 24 January 2012
Keywords: Leaf Area Index; Photosynthesis; Soil Respiration; Transpiration; Water Use Efficiency
ABSTRACT
Pigeonpea [Cajanus cajan (L.) Millsp.] is an important legume crop widely cultivated in tropical and subtropical climates of the world. Interest in this crop is growing in many countries because of its multiple uses as a source of food, feed, fuel, and fertilizer. However, the performance of pigeonpea in Southeastern US has not been well investigated. We conducted an experiment in Nashville, Tennessee to test the effects of two planting dates, three densities, and four varieties on pigeonpea ecophysiology that included leaf photosynthesis, stomatal conductance, transpiration, water use efficiency (WUE), leaf area index (LAI) and soil respiration. Results indicated that the plants in the late planting plots had higher photosynthetic rate, stomatal conductance and transpiration. There were significant differences in the levels of leaf photosynthesis, stomatal conductance, transpiration, WUE and LAI among all four varieties. W3 and G1 showed higher photosynthetic rate and LAI than W1, and W3 had higher WUE than G2 and W1. Planting densities had no significant effect on all variables studied. This study indicated that late planting of variety G1 or W3 resulted in higher WUE and yield, but did no significant influence soil CO2 emission.
1. INTRODUCTION
Pigeonpea [Cajanus cajan (L.) Millsp.] is well adapted to arid and semi-arid tropical and subtropical climates of the world [1-3]. Pigeonpea is the sixth most important legume food crop globally and is grown on about 5 million ha of land [4]. Currently, pigeonpea is widely cultivated in India [5]. Uganda and Kenya in Africa; the West Indies, Puerto Rico, and the Dominican Republic in the Caribbean region; and Burma in Asia are also major pigeon-pea-producing countries [6-8]. Pigeonpea is a nutritious high protein crop with high digestible protein (68%), low in fat and sodium with no cholesterol and has high dietary fibers [9]. Interest in this crop is growing in many other countries because of its multiple uses as a source of food, feed, fuel, and fertilizer [10-12]. During the three years of 1997-1999, the consumption of dry edible beans per person in the US has increased by 28% over the 1987-1989 period to 3.5 kg [13]. It has been postulated that a combination of rising immigration (particularly among the Hispanic population), wide-spread interest in ethnic foods cooked dry beans, and changes in America’s dietary awareness and sophistication have contributed to the rising per capita dry bean use [13]. It would be a great blessing to the rural community if this crop could be grown in the Southeast region of US. Since most of the agronomic practices used for the production of pigeon-pea are similar to soybean, pigeonpea appears to be a promising new legume crop for sale in the southern US.
Previous studies on pigeonpea have been conducted mostly in India and in the tropical and subtropical regions of the world [7,10,12,14]. Pigeonpea is tolerant to low phosphorus supply and acid soils, and grows well in the phosphorus-deficient soils of the tropical environment [15]. Faroda and Johri (1981) found that row spacings from 25 to 40 cm and plant spacing of 20 cm is suitable for early and extra early varieties of pigeonpea [16]. Despite the potential for pigeonpea as an important leguminous and vegetable crop, only a few studies have been conducted in the US on its adaptability to various climatic conditions such as low and uncertain summer rainfall or on its canopy development in temperate regions [11,17-20]. Several varieties have been developed in Georgia and Mississippi and tested in Florida, Oklahoma and Virginia for grain and forage production [11, 19,21]. Experiments conducted by Rao et al. (2002) showed that pigeonpea has the potential to produce moderate-quality forage during the forage deficit period from August through October in the Southern US Great Plains [11]. Bhardwaj et al. (1999) also reported that determinate pigeonpea varieties out-yielded indeterminate varieties (1751 vs 721 kg/ha) [21]. The green bean yield of pigeonpea varied from 11,888 to 15,696 kg/ha. Rao et al. (2009) found that pigeonpea had similar aboveground biomass, accumulated less nitrogen, lower digestibility than soybean and guar, and could provide producers in the Southern Great Plains with options other than soybean for generating forage or biological nitrogen [19].
The objective of this study was to quantify the ecophysiological responses of pigeonpea to planting dates, plant densities, and four varieties in terms of leaf physicology, leaf area development and soil respiration. We believe that such information concerning pigeonpea will be useful for crop improvement and possible biofuel production programs.
2. MATERIALS AND METHODS
2.1. Experimental Site, Experimental Design, and Treatments
Field experiments were conducted on the Tennessee State University Agricultural Research Center (Latitude 36.12'N, Longitude 36.98'W, elevation 127.6 m) in Nashville, Tennessee, in 2010. The experimental site was an Armour silt loam soil, slightly acidic (pH = 6.2), low in both phosphorus and potassium.
We considered varieties, planting dates and densities as treatment factors. Four varieties of pigeonpea were selected for this study: two early maturing varieties (G1: George One and G2: Georgia Two), and two late maturing varieties (W1 and W3). Two planting dates were June 9 and July 1, 2010. Three planting spacings were 5, 10, and 15 cm, equivalent to 295,500, 145,250, and 96,833 pants/ha, respectively.
The experiment was laid out as a split-plot design with four replications. The planting date was as main factors and variety and density were split factors. In each block, varieties and densities were randomly assigned. The total number of plots was 96. Plot size was 3 m × 2 m. Seeds were obtained from a private company in Georgia. Fresh seeds were sown and thinned to pre-determined densities. Normal agricultural practices were used. No nitrogen or irrigation was applied; 130 kg P2O5/ha and 80 kg K2O/ha were surface applied before seeds were planted. Few insect/disease problems were encountered, while weed control was maintained by pre-plant application of a mixture of two herbicides—prowl (EC) at 1.1 kg a.i./ha and fusilade (2E) at 0.28 kg a.i./ha and post-emergence application of basagran (4E) herbicide at 1.1 kg a.i/ha. Total precipitation during the cropping season (June to November) was 683.8 mm, higher than 30 years’ average (540.5 mm), but total precipitation in September and October was remarkably lower than 30 years’ average (93 mm vs 160 mm) [22].
2.2. Field Measurements of Leaf Photosynthesis, Stomatal Conductance, Transpiration, Leaf Area Index and Soil Respiration
Leaf photosynthesis, stomatal conductance and transpiration rates were measured using a Li-6400 Portable Photosynthesis System (Li-Cor Inc., Lincoln, NE, USA). We selected 2 to 3 plants in the center row of each plot. For each plant, two fully expanded young leaves were measured for leaf photosynthesis. All measurements were conducted during the peak flowering time in September and October between 10:00 am and 3:00 pm. The photosynthetically active radiation (PAR) was set at 2000 µmol photon m−2·s−1, and the CO2 concentration of the air was set at ambient concentration 380 - 400 ppm. Water use efficiency was calculated as leaf photosynthesis/ transpiration.
Leaf area index was measured using a LAI 2200 Plant Canopy Analyzer (Li-COR, Inc., Lincoln, Nebraska, USA). We followed the manufacture’s instruction for row crop measurements. Two measurements above the canopy and 6 below were made for each plot, in a sequence of ABBBABBB (A for above canopy and B for below canopy measurements). Measurements were taken near sunset during the peak flowering time.
Soil respiration was measured using the Li-Cor 6400 infrared gas analyzer (Li-COR, Inc., Lincoln, Nebraska, USA) connected to a Li-Cor 6400-09 soil respiration chamber (9.55 cm diameter) (Li-COR, Inc., Lincoln, Nebraska, USA). Two PVC soil collars (80 cm2 in area and 5 cm in height) were installed about 3 cm deep into the soil in the center row of each plot, a few days before taking the measurements. Soil respiration was measured during the peak flowering time at the same time as for the leaf photosynthesis measurements. These measurements were made between 1:00 pm and 4:00 pm local time. Soil respiration was measured three times for each soil collar. Soil temperature at 5 cm below the soil surface was monitored with a thermocouple sensor attached to the respiration chamber during the soil respiration measurement. Volumetric soil moisture of the top 5 cm soil layer was measured near soil collars using a HydroSense (Campell Scientific Australia Pty. Ltd.) connected with a CS620 sensor at the same time that the soil respiration measurements were taken.
2.3. Statistical Analysis
The effects of planting dates, varieties, and densities using analysis of variance (ANOVA) for a split plot design were evaluated [23]. If the effect was significant, least significant difference (LSD) was used for multiple comparisons. Data analysis was done using SAS software [23,24].
3. RESULTS AND DISCUSSION
The effects of planting dates, densities and varieties on leaf photosynthesis, stomatal conductance, LAI and soil respiration were analyzed using Analysis of variance (ANOVA). Planting dates and varieties of pigeonpea had significant effects on leaf photosynthesis and stomatal conductance (Table 1). However, plant density did not influence these variables. For LAI, only varietal effects were significant. Block effect was significant for leaf photosynthesis, stomatal conductance, and LAI. We did not find any significant effect of planting date, varieties, density, or even block on soil respiration.
3.1. Leaf Photosynthesis, Stomatal Conductance, Transpiration and Water Use Efficiency
The maximum leaf photosynthetic rate was 10.99 μmol CO2/m2/s for the late planting plots, 17.8% higher than that in the early planting plots (Table 2). Among the four varieties, the photosynthetic rate of W1 was 8.97 μmol CO2/m2/s, which was significantly lower than other three varieties (Table 3). Among the other three varieties, there was no significant difference. Plant densities did not influence the photosynthetic rate. For stomatal conductance, plants in the late planting plots had higher stomatal conductance rates (0.087 mol H2O/m2/s compared to 0.078 mol H2O/m2/s in early planting plots). There was no significant difference among G2, W3 and G1, but W1 had a significant lower stomatal conductance than G2 and W3. No significant difference was found between W1 and G1 (Table 4). Plant densities also did not influence stomatal conductance.
Leaf photosynthesis is an important biological process that directly influences plant growth and productivity. Values we measured during the peak flowering times may be similar to those taken at other times but varied among species [25]. The low precipitation during the flowering time in 2010 may have reduced the net leaf photosynthetic rates, but these values were consistent to several other previous studies. For example, Khudsar and Iqbal (2001) measured the leaf net photosynthetic rate at different cadmium concentrations and found that under no cadmium stress, the photosynthetic rate varied from 11.53 μmol CO2 m−2·s−1 pre-flowering, to 9.50 during flowering and 6.92 post-flowering [26]. Takele and McDavid (1995) reported that net photosynthesis of pigeonpea grown in pots was 12.6 μmol CO2 m−2·s−1 [27]. Net leaf photosynthetic rates varied from 10.9 to 13.9 μmol CO2 m−2·s−1 among three varieties and stomatal
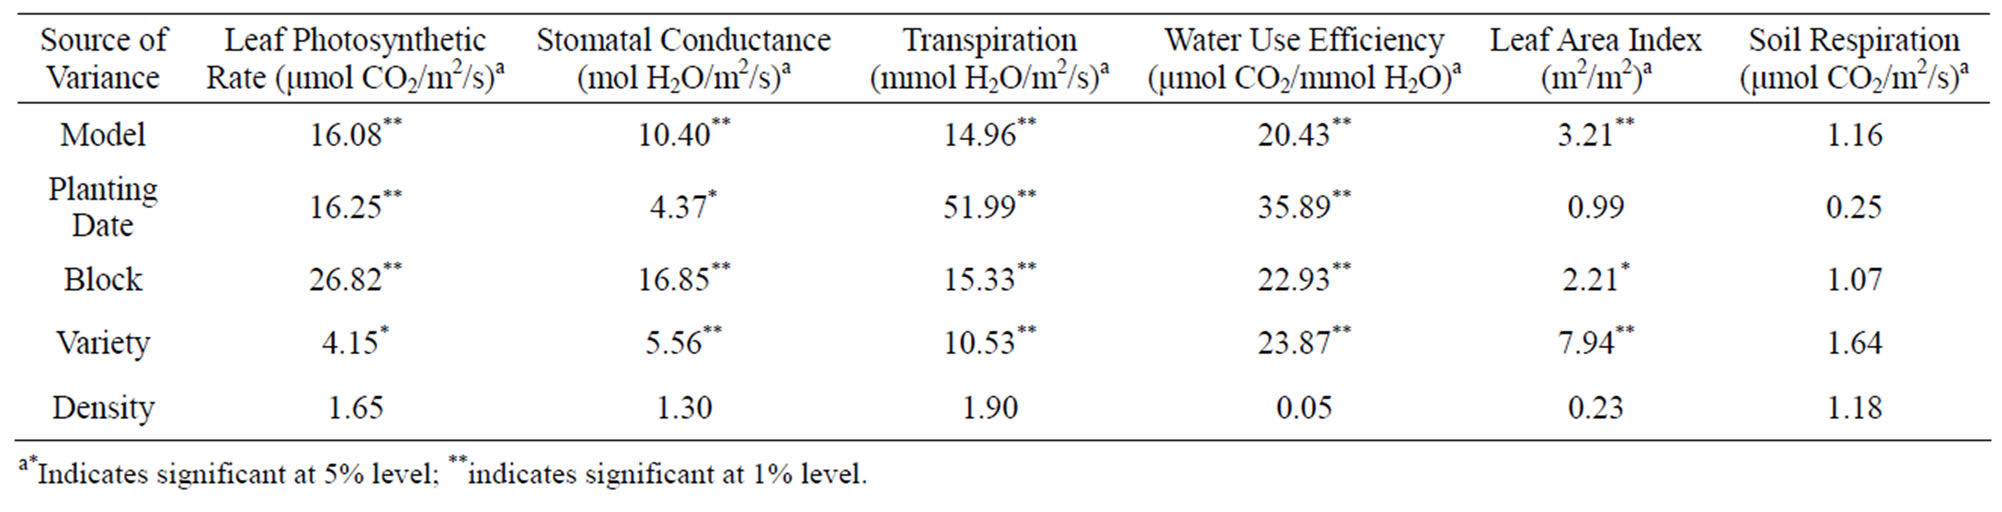
Table 1. Results of Analysis of Variance (ANOVA) to detect the effects of planting dates, varieties and densities on maximum net leaf photosynthetic rate, stomatal conductance, leaf area index and soil respiration of pigeonpea.

Table 2. Mean and significance of maximum leaf photosynthetic rate, stomatal conductance, leaf area index and soil respiration of pigeonpea between planting dates.
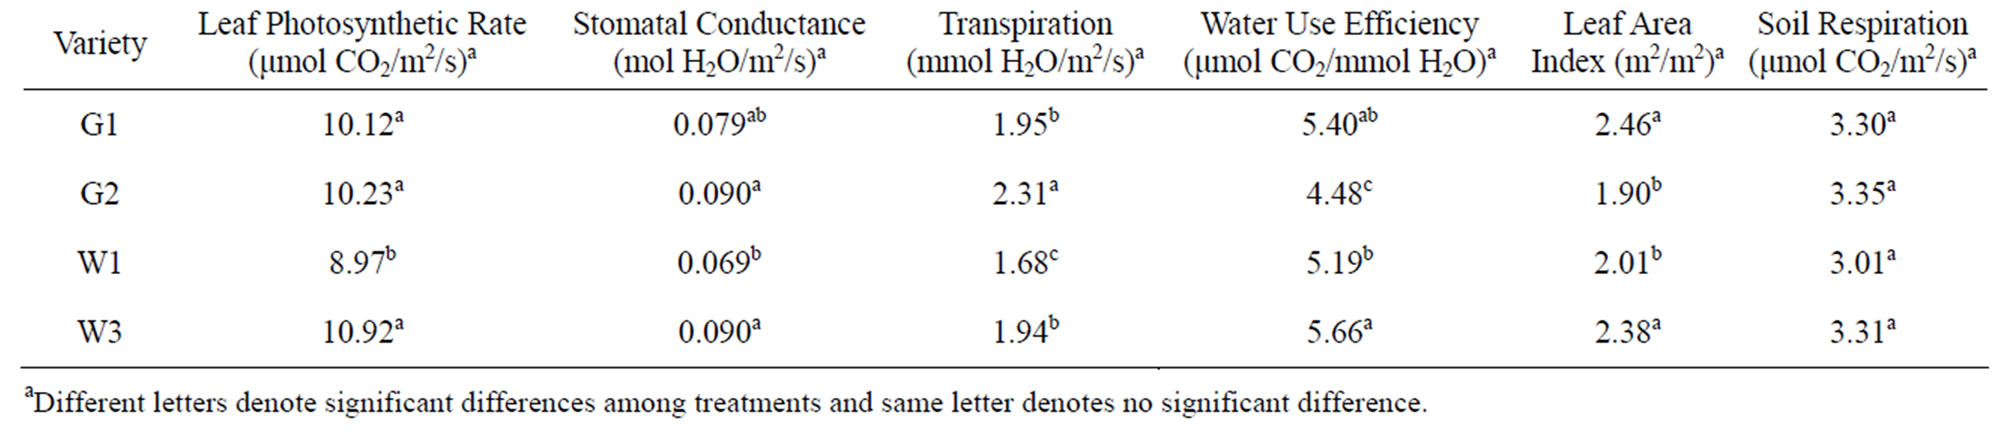
Table 3. Mean and significance of maximum leaf photosynthetic rate, stomatal conductance, leaf area index, and soil respiration of pigeonpea among varieties.
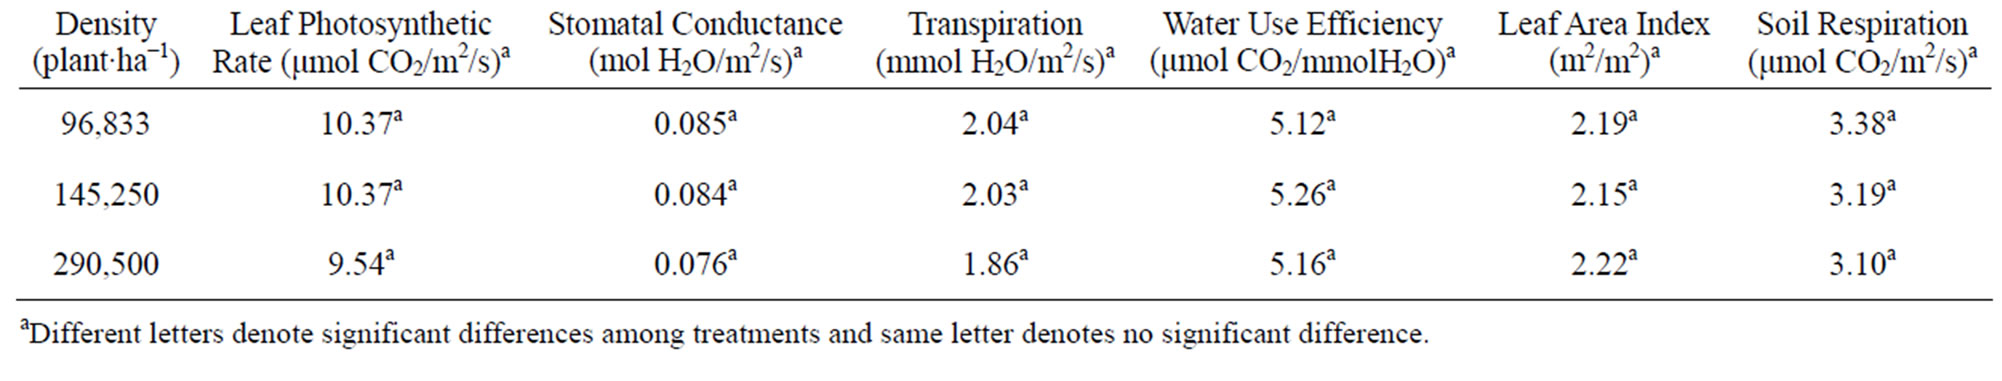
Table 4. Mean and significance of maximum leaf photosynthetic rate, stomatal conductance, leaf area index and soil respiration of pigeonpea among planting densities.
conductance varied from 0.155 to 0.214 mmol H2O m−2·s−1 (Fujita et al. 2004). But, Lopez et al. (1988) reported much higher values of maximum net leaf photosynthesis and stomatal conductance (~22 μmol CO2 m−2·s−1 and 0.25 mmol H2O m−2·s−1) for pot-grown pigeonpea plants measured at PAR of 1700 μmol photon m−2·s−1 [28].
Tayo (1982) evaluated the growth, development and yield of pigeonpea grown at three different densities of 27,000, 55,000 and 83,000 plants/ha and found that there was a progressive reduction in the development per plant of vegetative characters, dry matter accumulation and yield characters as population densities increased; however, the calculated growth rates (net photosynthesis rate, relative growth rate and leaf area ratio) were more or less the same at each density [29]. Their results were similar to what we found. For same varieties planted at different dates, it appears that pigeonpea planted at a late date had higher net leaf photosynthesis rates. Among the four varieties studied, W3 seems to be more suitable for Middle Tennessee region.
Water use and water use efficiency are important variables of crop varieties. To date there have been no reports published on WUE of pigeonpea grown in the US. We found that transpiration rates varied among all four varieties and planting dates, but not among densities. W1 consumed less water, but also had lower water use efficiency. W3 had a significant higher WUE (5.66 μmol CO2/mmol H2O) than G2 and W1, but was similar to G2. The values were lower than those for sorghum, higher than for wheat and comparable to cotton and soybean [30-32]. For example, Xin et al. (2009) reported that WUE varied from 12.73 to 15.65 μmol CO2/mmol H2O among 25 sorghum lines [32]. WUE of wheat ranged from 2.0 to 3.7 μmol CO2/mmol H2O [30]. WUE varied among temperature and CO2 treatments and ranged from about 2 to 5 μmol CO2/mmol H2O for cotton [33] and 2 to 7 μmol CO2/mmol H2O for soybean [31].
3.2. Leaf Area Index (LAI)
Both planting dates and plant densities had no influence on LAI (Tables 2 and 4). The mean LAI for all plots was 2.17 m2/m2. There was no significant difference in LAI between G1 and W3 or between G2 and W2. LAI of G1 and W3 were significantly higher than for G2 and W1 (Table 3). G1 and W3 were the two taller species than G2 or W2, which grew shorter. The values for LAI were smaller, but within the range reported for LAI for pigeonpea. For example, Lopez et al. (1997) reported that LAI varied from 1.3 to 4.9 m2/m2 of seven genotypes of pigeonpea for the control treatment and 0.6 to 3.6 m2/m2 under the water stress treatment [7]. Balakrishnan et al. (1987) reported a critical LAI of 5.3 m2/m2 among six pigeonpea varieties, but found that the crop growth rate was influenced more by the net leaf photosynthesis rate than for LAI [34].
3.3. Soil Respiration
No significant difference was observed among planting dates, or densities, or varieties (Table 1). The mean soil respiration rate was 3.23 μmol CO2 m−2·s−1. One thing should be noted is that soil moisture was very low when the soil respiration measurements were taken. The value measured in the pigeonpea field was similar to that in a nearby grassland measured at similar times, and in the range of those reported for crop fields [35,36].
4. CONCLUSION
We investigated the effects of planting dates, planting densities and varieties on ecophysiology of pigeonpea in Southeastern US We found significant differences in maximum net leaf photosynthesis, stomatal conductance, transpiration, WUE, and LAI among all four varieties. Plants in the late planting plots had higher leaf photosynthesis, but used more water, resulting in a lower WUE. Higher WUE of plants in early planting plots could be attributed to lower stomatal conductance and lower transpiration losses. LAI was not influenced by the planting dates. Soil respiration was not influence by the planting dates, planting densities and varieties. No variable investigated in this study was influenced by the planting densities. Based on these results, we conclude that late plating with variety G1 or W3 produced higher biomass and yield, had high WUE, and had no significant influence on soil CO2 emission.
5. ACKNOWLEDGEMENTS
We thank Dr. Sharad Phatak, Professor Emeritus, University of Georgia, for his input on planting protocol, selection of seed varieties, and making arrangement for free seed supply. We also thank students for their help in planting and data collection. This research was funded in part by the USDA CBG program (grant number: 2008-38814-04736), the National Science Foundation (grant numbers: DBI-0923371 and DBI-0933958) and Li-Cor Environmental Education Fund (LEEF).
REFERENCES
- Ae, N., Arihara, J., Okada, K., Yoshihara, T. and Johansen, C. (1990) Phosphorus uptake by pigeon pea and its role in cropping systems of the Indian subcontinent. Science, 248, 477-480. doi:10.1126/science.248.4954.477
- Rao, S.C., Phillips, W.A., Mayeux, H.S. and Phatak, S.C. (2003) Potential grain and forage production of early maturing pigeonpea in the southern Great Plains. Crop Science, 43, 2212-2217. doi:10.2135/cropsci2003.2212
- Raju, N.L., Gnanesh, B.N., Lekha, P., et al. (2010) The first set of EST resource for gene discovery and marker development in pigeonpea (Cajanus cajan L.). BMC Plant Biology, 10, 45. doi:10.1186/1471-2229-10-45
- Varshney, R.K., Chen, W., Li, Y., Bharti, A.K., Saxena, R.K., Schlueter, J.A., Donoghue, M.T.A., Azam, S., et al. (2011) Draft genome sequence of pigeonpea (Cajanus cajan), an orphan legume crop of resource-poor farmers. Nature Biotechnology, 30, 83-89. doi:10.1038/nbt.2022
- Vanaja, M., Reddy, P.R., Lakshmi, N.J., Razak, S.K., Vagheera, P., Archana, G., Yadav, S.K., Maheswari, M. and Venkateswarlu, B. (2010) Response of seed yield and its components of red gram (Cajanus cajan L. Millsp.) to elevated CO2. Plant, Soil and Environment, 56, 458-462.
- Nene, Y.L. and Sheila, V.K. (1990) Pigeonpea: Geography and importance. In: Nene, Y.L. et al., Eds., The Pigeonpea, CAB International, University Club, Cambridge, 1-14.
- Lopez, F.B., Chauhan, Y.S. and Johansen, C. (1997) Effects of timing of drought stress on leaf area development and canopy light interception on short-duration pigeonpea. Journal of Agronomic Crop Science, 178, 1-7. doi:10.1111/j.1439-037X.1997.tb00344.x
- Odeny, D.A. (2007) The potential of pigeonpea (Cajanus cajan (L.) Millsp.) in Africa. Natural Resources Forum, 31, 297-305. doi:10.1111/j.1477-8947.2007.00157.x
- Salunkhe, D.K., Chavan, J.K. and Kadam, S.S. (1986) Pigeon pea as important food source. Critical Reviews in Food Science and Nutrition, 23, 103-141. doi:10.1080/10408398609527422
- Singh, U., Jambunathan, R., Saxena, K.B. and Subrahmanyam, N. (1990) Nutritional quality evaluation of newly developed high-protein genotypes of pigeonpea (Cajanus cajan L.). Journal of the Science of Food and Agriculture, 50, 201-209. doi:10.1002/jsfa.2740500208
- Rao, S.C., Coleman, S.W. and Mayeux, H.S. (2002) Forage production and nutritive value of selected pigeonpea ecotypes in southern Great Plains. Crop Science, 42, 1259- 1263. doi:10.2135/cropsci2002.1259
- Egbe, O.M. and Kalu, B.A. (2009) Evaluation of pigeonpea (Cajanus cajan (L.) Millsp.) genotypes for intercropping with tall sorghum (Sorghum bicolor (L.) Moench) in southern Guinea Savanna of Nigeria. ARPN Journal of Agricultural and Biological Science, 4.
- Lucier, G., Lin, B.-H., Allshouse, J. and Kantor, L.S. (2000) Factors affecting dry bean consumption in the United States. USDA Economic Research Service: Vegetables and Specialties, Washington DC, 26-34.
- Rao, A.S., Luthra, Y.P., Sheoran, I.S. and Singh, R. (1984) Partitioning of carbon and nitrogen during growth and development of pigeonpea (Cajanus cajan L.). Journal of Experimental Botany, 35, 774-784. doi:10.1093/jxb/35.6.774
- Fujita, K., Kai, Y., Takayanagi, M., El-Shemy, H., AduGyamfi, J.J. and Mohapatra, P.K. (2004) Genotypic variability of pigeonpea in distribution of photosynthetic carbon at low phosphorus level. Plant Science, 166, 641- 649. doi:10.1016/j.plantsci.2003.10.032
- Faroda, A.S. and Johri, J.N. (1981) Extending pigeonpea cultivation to nontraditional areas in India. Proceedings of the International Workshop on Pigeonpeas, 15-19 December 1980, Patancheru, 45-50.
- Phatak, S.C., Nadimpalli, R.G., Tiwari, S.C. and Bhardwaj, H.L. (1993) Pigeonpeas: Potential new crop for the south-eastern United States. In: Janick J. and Simon, J.E., Eds., New crops, Wiley, New York, 597-599.
- Scokstad, E. (2007) The plant breeder and the pea. Science, 316, 196-197. doi:10.1126/science.316.5822.196
- Rao, S.C. and Northup, B.K. (2009) Capabilities of four novel warm-season legumes in the Southern Great Plains: Biomass and forage quality. Crop Science, 49, 1096-1102. doi:10.2135/cropsci2008.08.0499
- Foster, J.L., Adesogan, A.T., Carter, J.N., Sollenberger, L.E., Blount, A.R., Myer, R.O., Phatak, S.C. and Maddox, M.K. (2009) Annual legumes for forage systems in the United States Gulf Coast Region. Agronomy Journal, 101, 415-421. doi:10.2134/agronj2008.0083x
- Bhardwaj, H.L., Rangappa, M. and Hamama, A.A. (1999) Chickpea, faba bean, lupin, mungbean, and pigeonpea: potential new crops for the Mid-Atlantic Region of the United States. In: Janick, J. Ed., Perspectives on New Crops and New Uses, ASHS Press, Alexandria, 202-205.
- NOAA National Weather Service Weather Forecast Office (2011). http://www.srh.noaa.gov
- Hui, D. and Jiang, C. (1996) Practical SAS Usage. Beijing University of Aeronautics & Astronautics Press, Beijing, China.
- SAS Institute Inc. (2005) SAS OnlineDoc 9.1.3, SAS Institute Inc., Cary.
- Hamidou, F., Zombre, G., Diouf, O., Diop, N.N., Guiko, S. and Braconnier, S. (2007) Physiological, biochemical and agromorphological responses of five cowpea genotypes (Vigna unguiculata (L.) Walp.) to water deficit under glasshouse conditions. Biotechnology, Agronomy, Society and Environment, 11, 225-234.
- Khudsar, T., Mahmooduzzafar and Iqbal, M. (2001) Cadmium-induced changes in leaf epidermis, photosynthetic rate and pigment concentrations in Cajanus cajan. Biologia Plantarum, 44, 59-64. doi:10.1023/A:1017918320697
- Takele, A. and McDavid, C. (1995) The response of pigeonpea cultivars to short durations of waterlogging. African Crop Science Journal, 3, 51-58.
- Lopez, F.B., Setter, T.L. and McDavid, C.R. (1988) Photosynthesis and water vapor exchange of pigeonpea leaves in response to water deficit and recovery. Crop Science, 28, 141-145. doi:10.2135/cropsci1988.0011183X002800010030x
- Tayo, T.O. (1982) Growth development and yield of pigeon-pea (Cajanus cajan) cultivar Cita-1 in lowland tropics. 1. Effect of plant population density. Journal of Agricultural Science, 98, 65-70. doi:10.1017/S0021859600041101
- Farquhar, G.D. and Richards, R.A. (1984) Isotopic composition of plant carbon correlates with water-use efficiency of wheat genotypes. Functional Plant Biology, 11, 539-552.
- Allen, L.H. Jr., Pan, D., Boote, K.J., Pickering, N.B. and Jones, J.W. (1995) Carbon dioxide and temperature effects on evapotranspiration and water use efficiency of soybean. Agronomy Journal, 95, 1071-1081. doi:10.2134/agronj2003.1071
- Xin, Z., Aiken, R. and Burke, J. (2009) Genetic diversity oftranspiration efficiency in sorghum. Field Crops Research, 111, 74-80. doi:10.1016/j.fcr.2008.10.010
- Reddy, V.R., Reddy, K.R. and Hodges, H.F. (1995) Carbon dioxide enrichment and temperature effects on cotton canopy photosynthesis, transpiration, and water-use efficiency. Field Crops Research, 41, 13-23. doi:10.1016/0378-4290(94)00104-K
- Balakrishnan, K., Natarajaratnam, N. and Rajendran, C. (1987) Influence of sowing date on photosynthesis and production of Cajanus cajan (L.) Millsp. Photosynthetica, 21, 308-313.
- Rochette, P., Desjardins, R. L. and Pattey, E. (1991) Spatial and temporal variability of soil respiration in agricultural fields. Canadian Journal of Soil Science, 71, 189- 196. doi:10.4141/cjss91-018
- Lohila, A., Aurela, M., Regina, K. and Laurila, T. (2003) Soil and total ecosystem respiration in agricultural fields: Effect of soil and crop type. Plant and Soil, 251, 303-317. doi:10.1023/A:1023004205844