International Journal of Geosciences
Vol.4 No.6A1(2013), Article ID:35593,5 pages DOI:10.4236/ijg.2013.46A1001
Estimation of Growth Area of Aquatic Macrophytes Expanding Spontaneously in Lake Shinji Using ASTER Data
1Graduate School of Engineering, Hiroshima University, Hiroshima, Japan
2Research Center for Coastal Lagoon Environments, Shimane University, Shimane, Japan
Email: sakuno@hiroshima-u.ac.jp
Copyright © 2013 Yuji Sakuno, Hidenobu Kunii. This is an open access article distributed under the Creative Commons Attribution License, which permits unrestricted use, distribution, and reproduction in any medium, provided the original work is properly cited.
Received May 19, 2013; revised June 25, 2013; accepted July 17, 2013
Keywords: ASTER; NDVI; Aquatic Macrophytes; Bio-Optical Algorithm; Lake Shinji
ABSTRACT
In this study, we estimated the growth area of aquatic macrophytes that have expanded spontaneously in Lake Shinji, located in eastern Shimane Prefecture, Japan, using Terra satellite Advanced Spaceborne Thermal Emission and Reflection Radiometer (ASTER) data. Visible and near infrared ASTER data from April, August, and September 2012 were used. The water depth at which ASTER can detect submersed aquatic macrophytes using in situ spectral reflectance of aquatic macrophytes and a bio-optical model was also examined. As a result, when the threshold value of a normalized difference vegetation index (NDVI) was set to 0, only aquatic macrophytes up to a depth of approximately 10 cm could be detected. The growth area of aquatic macrophytes detected by NDVI from ASTER data was in relatively good agreement with the growth area as observed by aerial photography.
1. Introduction
Lake Shinji is a brackish water lake with rich biological resources primarily represented by corbicula. In recent years, an abrupt increase in blue-green algae and the spontaneous expansion of aquatic macrophytes have been observed within the lake. The influence of such events on the biological resources of the lake is unknown. It is thought that these phenomena may be the resultant processes of an environment “regime shift” [1], in which an environment changes suddenly. There has been little systematic global investigation on the soundness of lake ecosystems; consequently, sufficient knowledge about the shift from the turbid system of phytoplankton domination to the clear system of sea grass domination has not been acquired [2]. However, it is difficult to ascertain the actual conditions of such a wide area. Hence, it is expected that satellite remote sensing technology rather than conventional field survey can be employed to obtain the required data. This study aims to estimate the spontaneously expanded growth area of aquatic macrophytes in the lake using Advanced Spaceborne Thermal Emission and Reflection Radiometer (ASTER) data from the Terra satellite.
2. Method and Data
2.1. Study Area
Lake Shinji is located in the eastern part of Shimane Prefecture, Japan (Figure 1). The surface area, volume, and mean depth of the lake are 79.2 km2, 3.66 × 10⁸ m3, and 4.5 m, respectively. The lake is comprised of estuarine lagoons with eutrophic conditions similar to Lake Nakaumi. The most dominant macrobenthos in Lake Shinji is the infaunal Corbicula japonica [3,4]. According to a report from the Department of Science, Shimane University [5], the annual average water quality of Lake Shinji (center point) from 1982 to 1993 can be characterized as follows: transparency 1.3 ± 0.1 m, surface salinity 4.0‰ ± 1.5‰, SS 6.8 ± 1.6 mg·L−1, and surface chlorophyll-a (Chl-a) 16.2 ± 3.2 μg·L−1. Large outbreaks of blue-green algae blooms occurred in 2010 and 2012 following heavy rains in 2006. Moreover, macrophytes grew in abundance at the southern coast of the lake in the autumn of 2009 and have continued to expand since then.
2.2. Extraction of Aquatic Macrophytes
To extract information about aquatic macrophytes from
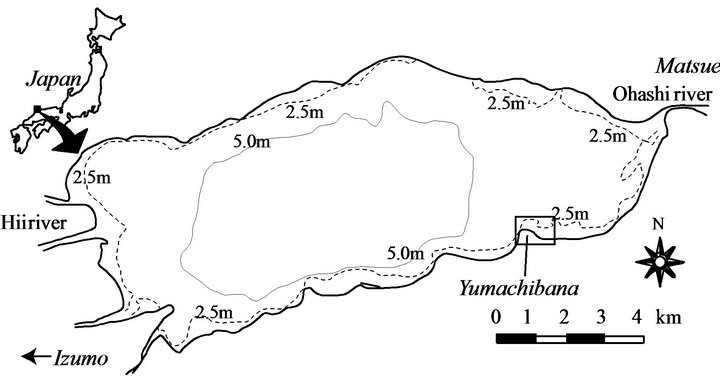
Figure 1. Location and bathymetric image of Lake Shinji.
satellite data, we applied a normalized difference vegetation index (NDVI), which is used for the evaluation of land plant activity. The NDVI was calculated using the following equation:
 , (1)
, (1)
where R is reflectance, and NIR and red are near infrared and red bands, respectively. The NDVI takes values between −1 and 1, with higher values indicating higher activity. In general, NDVI = 0 indicates a soil line, and values higher than 0 indicate a plant. In this study, NDVI values greater than 0 were considered to be aquatic macrophytes. However, since we are dealing with underwater plants, we cannot expect to apply this particular condition (NDVI = 0). Therefore, in this study, we estimated the water depth that can be extracted by the NDVI threshold using a bio-optical model.
2.3. Bio-Optical Algorithm
The bio-optical reflectance estimation model developed by Albert and Mobley [6] was used to investigate the influence of water depth on the NDVI. This model was valid just below the water surface (R−) and considers the influence of bottom reflection in optical shallow waters.
 (2)
(2)
Here we described only the main points of Equation (2). A detailed examination of the algorithm and its numerical values can be found in literature [6]. From this equation, when the reflectance RB and water depth zB of bottom materials (e.g., aquatic macrophytes) were known, the reflectance directly under the lake surface can be reproduced by changing Chl-a and the total suspended sediment in a and b (or u). In this study, we can obtain the reflectance just above the water surface (R+) by calculating R− when changing the water depth z assuming the spectral reflectance of the aquatic macrophytes exposed to the surface to be RB and multiplying R− by 0.55.
2.4. ASTER Data
The ASTER data was captured as shown in Table 1 and was used to detect aquatic macrophyte distribution. ASTER is an imaging instrument aboard the Terra satellite. It consists of three separate subsystems: visible and near infrared (VNIR), SWIR, and TIR. Only the VNIR data was used in this research. The VNIR subsystem has a spatial resolution of 15 m, a viewing swath width of 60 km, and spectral bands of 0.52 - 0.62 (Band 1), 0.63 - 0.69 (Band 2), and 0.78 - 0.86 (Band 3).
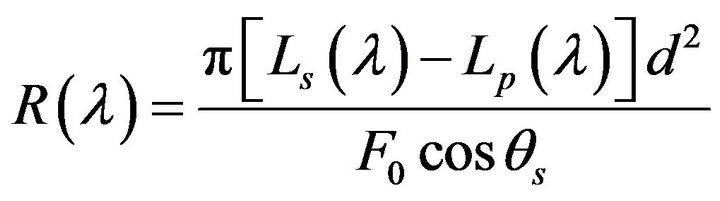
Reflectance conversion of ASTER data was performed according to the following equation [7] which has been used for many years to estimate water quality using satellites.
 , (3)
, (3)
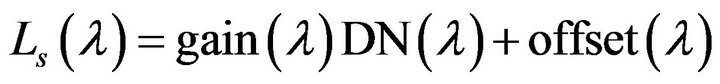
where Ls is the radiance from the satellite data (Wm−2·sr−1·μm−1), Lp is the path radiance (Wm−2·sr−1·μm−1), F0 is the exoatmospheric irradiance (Wm−2·μm−1), and qs is the solar zenith angle (˚). Among these, L conversion from the digital value (DN) of AVNIR-2 data was calculated using the following conversion equation.
 , (4)
, (4)
where gain and offset are radiometric conversion coefficients. Furthermore, Lp was calculated from Rayleigh scattering path radiance.
2.5. Aquatic Macrophyte Reflectance Data
To obtain the reflectance data of the aquatic macrophytes for Equation (2), a field survey was conducted off Yumachibana (rectangular frame, Figure 1) on September 24, 2012. As seen in the photographs in Figure 2" target="_self"> Figure 2, a patch
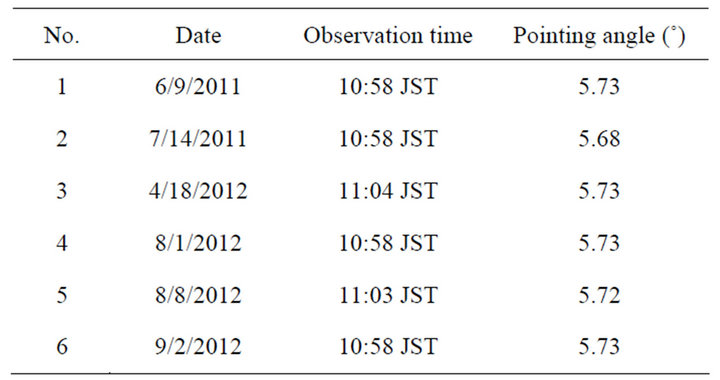
Table 1. ASTER data information.
of aquatic plants with a covering of blue-green algae bloom was observed. The aquatic macrophytes observed were primarily Potamogeton anguillanus (Figure 2, lower left photograph) and Cladophora sp. The spectral reflectance (RB of Equation (2)) was measured where the two macrophytes had floated to the surface. The spectral reflectance of the aquatic macrophytes was measured using a portable spectrometer (MS-720, Eiko Co., Ltd., Japan) with a spectral resolution of 1 nm and a range of 400 - 900 nm. On the day of the field survey, Chl-a was 42 μg·L−1 and SS was 8 mgL−1, which was estimated from historical data of Chl-a and SS in the lake.
3. Results
3.1. Overview of ASTER Image
The false color image of the ASTER data is shown in Figure 3. It was difficult to observe the remarkable color
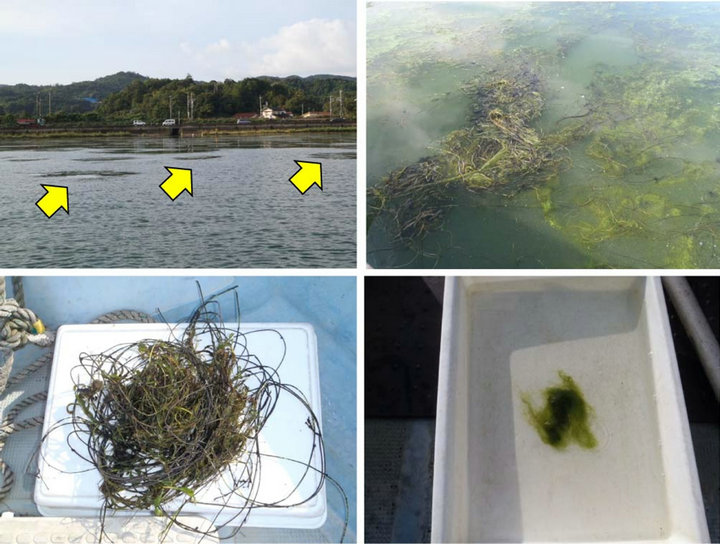
Figure 2. Photographs of field survey off Yumachibana in Lake Shinji (September 24, 2012).
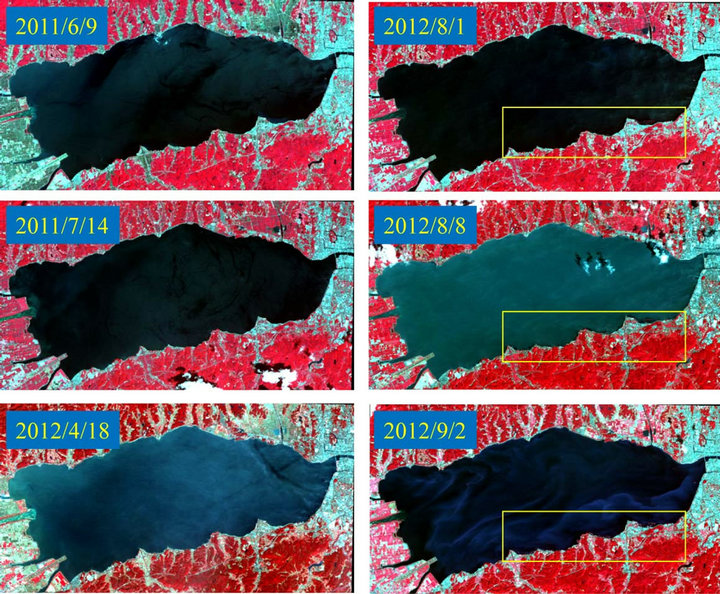
Figure 3. ASTER false color composite images of Lake Shinji (2011-2012).
change that was considered to be due to the aquatic macrophytes between June and July in 2011. On the other hand, high reflectance in the near-infrared band (red color) was observed at the southern coast of the lake on August 8 and September 2, 2012, as shown in Figure 4. Judging from Shimane Prefecture field survey results (undisclosed), these areas are in good agreement with the area in which the aquatic macrophytes have spread spontaneously.
3.2. Aquatic Macrophyte Extraction from NDVI
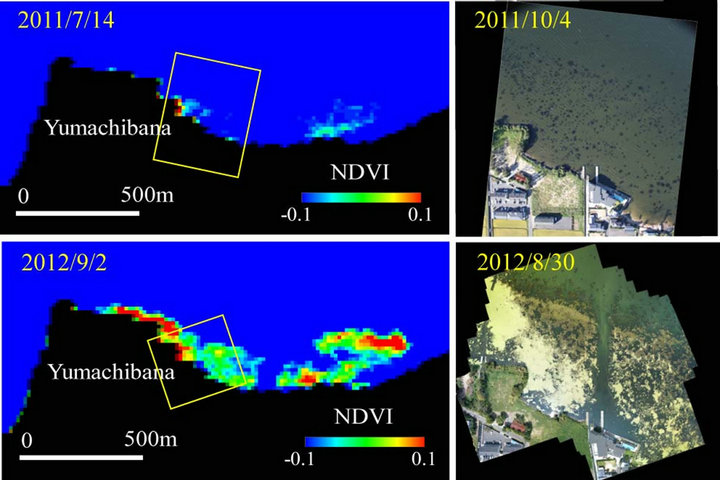
Figure 5 shows the time series change of the NDVI distribution calculated from ASTER data for the area encompassed by the rectangle in Figure 1. Figure 6 shows a comparison between aerial photos and the ASTER NDVI images of the area from 2011 and 2012. It can be seen that the high NDVI area is in relatively good agreement with the area in which the aquatic macrophytes (especially Cladophora sp.) were observed (shown in white).
3.3. Simulated Water Depth for Macrophyte Detection
Here the NDVI calculated from ASTER data is estimated using the bio-optical algorithm of Equation (2) to determine the depth at which the information was obtained. Figure 7 shows the spectral reflectance characteristics of two types of submersed aquatic macrophytes. It can be seen that, for all cases, reflectance at 700 nm or more decreases significantly as water depth increases. When aquatic macrophytes submersed at a depth of at least 0.5 m were examined, the magnitude relationship of the reflectance at ASTER Band 2 and Band 3 was reversed.
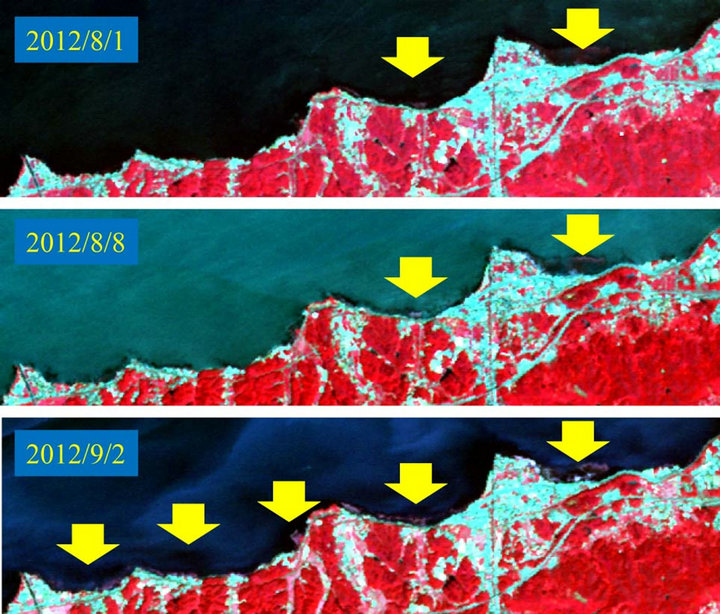
Figure 4. ASTER false color composite images at the southern coast of Lake Shinji (August 1, August 8, and September 2).
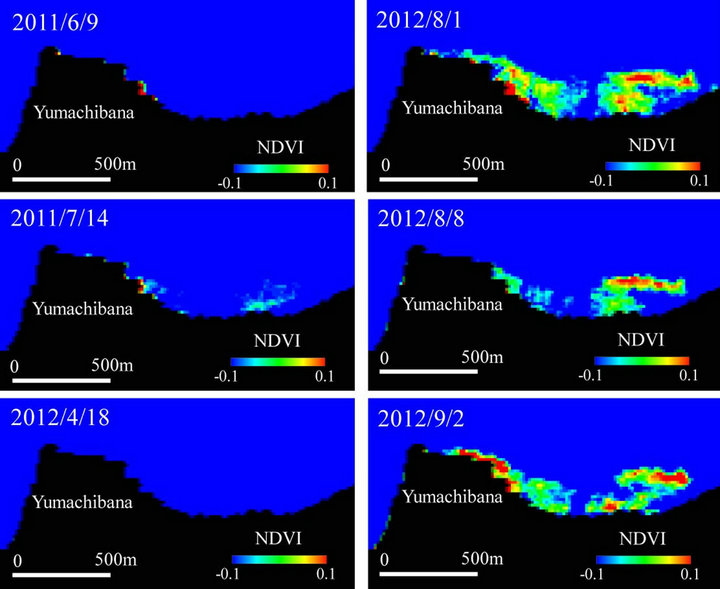
Figure 5. NDVI distributions extracted from ASTER data (2011-2012).
 (a) (b)
Figure 6. Comparison between ASTER NDVI and aerial photos. (a) NDVI from ASTER; (b) Arial photo.
Figure 8 shows the relationship between water depth (z) and NDVI in more detail. When the threshold of NDVI was set to 0, the depth at which the aquatic macrophytes can be detected was estimated to be approximately 0.1 m (10 cm).
4. Discussion
This study aims to estimate the spontaneously expanded growth area of aquatic macrophytes in Lake Shinji using ASTER data. Although the aquatic macrophyte distribution in the lake can be roughly seen from ASTER data in Figures 3-6, it appears that detection sensitivity changes with species (Potamogeton anguillanus and Cladophora sp.). It is considered that the NIR absorption of water and mixed pixels (spatial resolution) affects detection sensitivity [8,9]. When aquatic macrophytes actually enter the water (Figures 7 and 8), the NIR reflectance falls rapidly. Moreover, at many points, the green colored Potamoge-
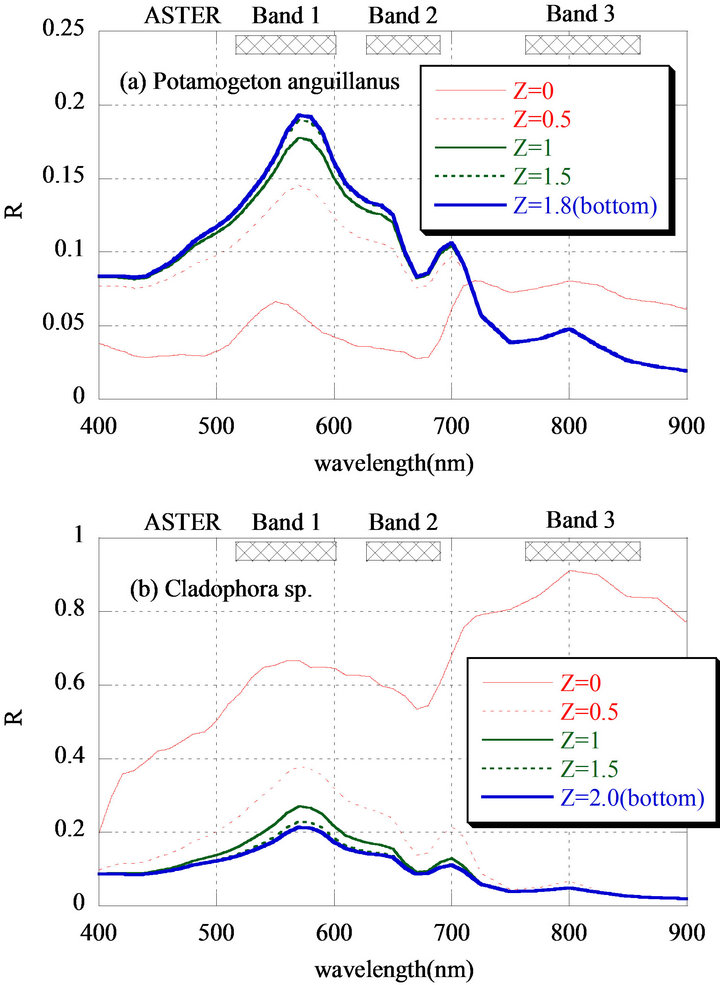
Figure 7. Simulated reflectance of the macrophytes relative to water depth using the bio-optical algorithm.
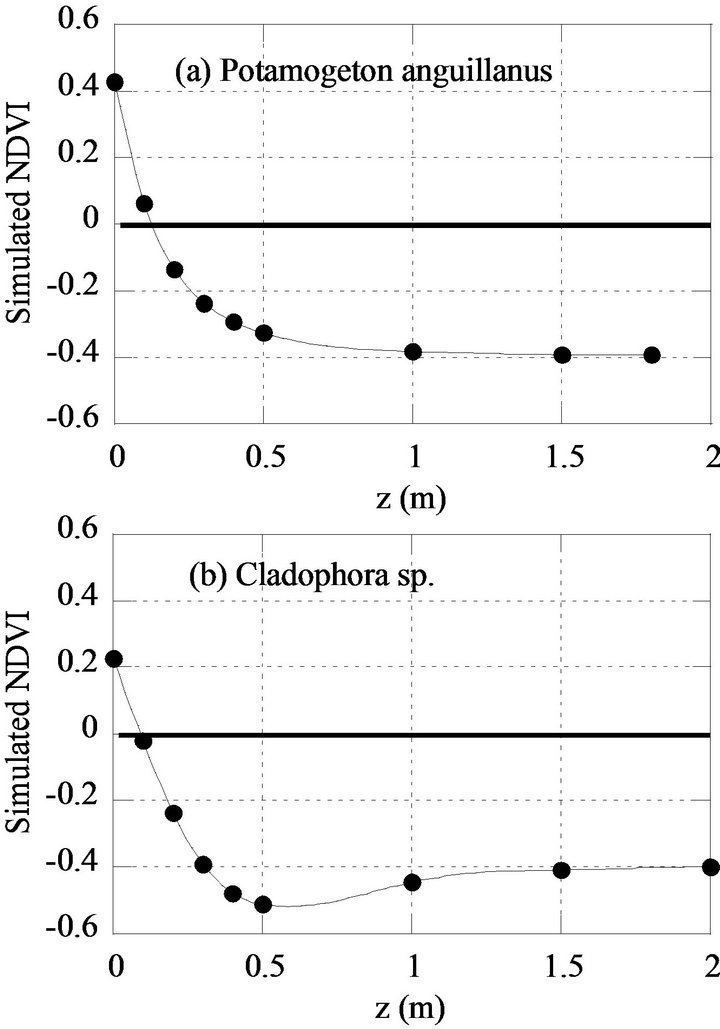
Figure 8. Difference in NDVI of macrophytes by water depth.
ton anguillanus covered the white colored Cladophora sp. Therefore, the conditions of the aquatic macrophytes detected by ASTER with a resolution of 15 m showed an area of 15 m or more, and indicated that the crown of the aquatic macrophytes had reached the water surface. On the other hand, when the NDVI threshold was set to 0, the depth at which the aquatic macrophytes could be detected was estimated to be approximately 0.1 m (Figure 8). Ackleson [10] indicated that a mask should be used for positions deeper than 1.9 m when Landsat MSS and TM data are used. In addition, Everitt [11] reported that detecting hydrilla at depths from 2.5 to 7.5 cm below the water surface using video images is difficult. Therefore, it is assumed that the estimated detection depth of 0.1 m in this study is appropriate.
5. Conclusions
We attempted to estimate the growth area of aquatic macrophytes that have expanded spontaneously in Lake Shinji using ASTER data. As a result, the following observations were made.
1) The false color ASTER image approximated the actual distribution of aquatic macrophytes as observed from August 1 to September 2, particularly at the southern coast of the lake.
2) The NDVI distribution calculated from ASTER data is in good agreement with the aquatic macrophytes visible in aerial photos.
3) When the threshold of the NDVI was set to 1, it was estimated from a bio-optical model that only aquatic macrophytes at a depth of approximately 10 cm are detected by ASTER.
In future, we aim to develop a robust aquatic macrophyte monitoring methodology that is combined with ASTER data and other similar satellite data.
6. Acknowledgements
The aerial photos used in this study were acquired using the funded-research expenses of the Ministry of Land, Infrastructure, Transport, and Tourism, Izumo River Office. In addition, a part of this research was supported by the Japan Society for the Promotion of Science KAKENHI (25281054 and 24560623).
REFERENCES
- M. Scheffer and S. R. Carpenter, “Catastrophic Regime Shifts in Ecosystems: Linking Theory to Observation,” Trends in Ecology & Evolution, Vol. 18, No. 12, 2003, pp. 648-656. doi:10.1016/j.tree.2003.09.002
- I. Blindow, A. Hargeby, J. Meyercordt and H. Schubert, “Primary Production in Two Shallow Lakes with Contrasting Plant form Dominance: A Paradox of Enrichment?” Limnology and Oceanography, Vol. 51, No. 6, 2006, pp. 2711-2721. doi:10.4319/lo.2006.51.6.2711
- M. Nakamura, M. Yamamuro, M. Ishikawa and H. Nishimura, “Role of the Bivalve Corbicula Japonica in the Nitrogen Cycle in a Mesohaline Lagoon,” Marine Biology, Vol. 99, No. 3, 1988, pp. 369-374. doi:10.1007/BF02112129
- M. Yamamuro, “Abundance and Size Distribution of Sublittoral Meiobenthos along Estuarine Salinity Gradients,” Journal of Marine Systems, Vol. 26, No. 2, 2000, pp. 135-143. doi:10.1016/S0924-7963(00)00050-6
- Laboratory of Analytical Chemistry of Shimane University, “Monthly Report of Water Quality in Lake Shinji and Lake Nakaumi,” 1994.
- A. Albert and C. Mobley, “An Analytical Model for Subsurface Irradiance and Remote Sensing Reflectance in Deep and Shallow Case-2 Waters,” Optics Express, Vol. 11, No. 22, 2003, pp. 2873-2890. doi:10.1364/OE.11.002873
- R. G. Lathrop, T. M. Lillesand and B. S. Yandell, “Testing the Utility of Simple Multi-Date Thematic Mapper Calibration Algorithms for Monitoring Turbid Inland Waters,” International Journal of Remote Sensing, Vol. 12, No. 10, 1991, pp. 2045-2063. doi:10.1080/01431169108955235
- P. T. Wolter, C. A. Johnston and G. J. Niemi, “Mapping Submergent Aquatic Vegetation in the US Great Lakes Using Quickbird Satellite Data,” International Journal of Remote Sensing, Vol. 26, No. 23, 2005, pp. 5255-5274. doi:10.1080/01431160500219208
- O. K. Dogan, Z. Akyurek and M. Beklioglu, “Identification and Mapping of Submerged Plants in a Shallow Lake Using Quickbird Satellite Data,” Journal of Environmental Management, Vol. 90, No. 7, 2009, pp. 2138-2143. doi:10.1016/j.jenvman.2007.06.022
- S. Ackleson and V. Klemas, “Remote Sensing of Submerged Aquatic Vegetation in Lower Chesapeake Bay: A Comparison of Landsat MSS to TM Imagery,” Remote Sensing of Environment, Vol. 22, No. 2, 1987, pp. 235- 248. doi:10.1016/0034-4257(87)90060-5
- J. Everitt, C. Yang, D. Escobar, C. Webster, R. Lonard and M. Davis, “Using Remote Sensing and Spatial Information Technologies to Detect and Map Two Aquatic Macrophytes,” Journal of Aquatic Plant Management, Vol. 37, 1999, pp. 71-80.