Journal of Minerals and Materials Characterization and Engineering
Vol.1 No.6(2013), Article ID:39980,8 pages DOI:10.4236/jmmce.2013.16043
Use of Mineral Liberation Analysis (MLA) in the Characterization of Lithium-Bearing Micas
1Department of Mineralogy, TU Bergakademie Freiberg, Freiberg, Germany
2Helmholtz Institute Freiberg for Resource Technology, Freiberg, Germany
Email: *dirk.sandmann@mineral.tu-freiberg.de
Copyright © 2013 Dirk Sandmann, Jens Gutzmer. This is an open access article distributed under the Creative Commons Attribution License, which permits unrestricted use, distribution, and reproduction in any medium, provided the original work is properly cited.
Received September 17, 2013; revised October 20, 2013; accepted November 2, 2013
Keywords: Mineral Liberation Analysis; Zinnwaldite; Conventional Comminution; High Voltage Pulse Power Fragmentation
ABSTRACT
The capabilities and opportunities of the application of automated mineralogy for the characterization of lithium-bearing zinnwaldite-micas are critically assessed. Samples of a crushed greisen-type ore comprising mostly of quartz, topaz and zinnwaldite (Li-rich mica) were exposed to further comminution by cone crusher and high voltage pulse power fragmentation. Product properties were analyzed by using a Mineral Liberation Analyser (MLA) and the obtained mineralogical and mineral processing relevant parameters were carefully evaluated with special focus on the characteristics of zinnwaldite. The results illustrate that both samples contain a significant quantity of very fine particles that are products of comminution. The modal mineralogy in the different sieve fractions is characterized by the accumulation of minerals of low hardness in the finest fraction and the enrichment of topaz, having a high hardness, in the somewhat larger fractions. Based on the results of mineral association data for zinnwaldite, a displacement of the muscovite-quartz ratio, in comparison to the results of modal mineralogy, was observed by indicating good quartz-zinnwaldite boundary breakage and weak muscovite-zinnwaldite breakage. Liberation as well as mineral grade recovery curves indicate that fraction ‑1000 to +500 µm is most suitable for beneficiation. The results of this study demonstrate that SEM-based image analysis, such as MLA, can effectively be used to investigate and evaluate phyllosilicate minerals in a fast and precise way. It is shown that the results of MLA investigations, such as modal mineralogy, are in good agreement with other analytical methods such as quantitative X-ray powder diffraction.
1. Introduction
Comminution is one of the most energy intensive, and thus most costly processes in industrial mineral processing. As energy costs continue to rise, comminution can compromise the profitability of a mining operation. Innovative concepts for energy-efficient comminution are therefore of great relevance. Comminution by high voltage pulse power fragmentation is such a novel concept that may be considered. Recent studies by Wang [1] illustrate that this technology, in certain cases, can be more energy-efficient compared to conventional mechanical comminution.
However, particle size reduction is only one tangible attribute to be achieved by comminution. Liberation of ore minerals is a second parameter that is of equal interest and that cannot be neglected. The present study describes the degree of liberation and particle/mineral grain size distribution achieved from samples treated with high voltage pulse power fragmentation as well as conventional mechanical comminution. Automated mineralogy, using a Mineral Liberation Analyser [2,3], was used to quantify liberation and other tangible particle and mineral attributes.
An example of coarse-grained and isotropically textured raw material was selected for the experimental study. This material is originated from the Zinnwald SnW-Li greisen deposit and contains zinnwaldite, next to quartz, topaz as well as minor cassiterite, wolframite, and fluorspar. Zinnwaldite, a Li-rich mica and main commodity of interest in this study (as a potential ore mineral), ranges up to 5 mm in grain size [4].
Lithium is an emerging commodity because of its importance in energy storage systems (e.g., Li-ion batteries). Future demand for lithium is set to increase rapidly, mainly due to the continuous growth of world automobile market, rising prices for crude oil and the resultant increasing demand for lithium-ion batteries [5]. In 2011, about two thirds of global lithium production came from surface brine deposits (e.g., from Chile, China and Argentina) and one third from hard-rock silicate ores. In the latter case, spodumene-bearing pegmatites are the dominant source of Li-bearing hard-rock silicates, with Greenbushes (Australia) and Bikita (Zimbabwe) as prominent examples.
Li-bearing micas, namely lepidolite and zinnwaldite, currently have very limited economic significance in lithium production as they are mined only in Portugal and Zimbabwe. However, due to their wide distribution and abundance, such Li-bearing mica may well become an attractive proposition, if the demand for lithium will indeed increase as predicted. It appears thus imperative to define and optimize technological approaches to liberate and concentrate Li-bearing mica [6].
Synopsis of the Zinnwald Deposit
The historic Zinnwald deposit, located in the Eastern Erzgebirge/Východní Krušné hory, straddles the Saxon (Germany), Bohemian (Czech Republic) border. Tin mining took place there from the 16th century to the 1940s (German part) resp. 1990 (Czech part). From the mid- 19th century, tungsten was mined and from 1869 to 1945 lithium-bearing mica concentrates were produced. During this period, Zinnwald was one of the few Industrial sources of lithium globally. At present, the German side of the deposit is explored by the Solarworld AG.
The Zinnwald deposit is classified as a greisen-type orebody [7]. This orebody is located in a fluorine-rich granitic stock intruded into Palaeozoic rhyolites. The highly altered granites host a series of lens-like Li-Sn-Wbearing greisen bodies consisting mostly of quartz, zinnwaldite, topaz and minor fluorite as well as vein-style Sn-W mineralization [7].
The lithium content of the greisen deposit is solely hosted in a series of mica named zinnwaldite (Formula: KLiFe2+Al(AlSi3O10)(F,OH)2) extending in composition from the mineral siderophyllite (KFe2+2Al(Al2Si2O10) (OH)2) to polylithionite (KLi2Al(Si4O10)(F,OH)2). Zinnwaldite from the Zinnwald deposit is available as a candidate reference sample (Zinnwaldite ZW-C), and according to [8], has an average Li2O content of 2.43 wt% (n = 44).
2. Methods
The material for this study was part of a large bulk sample of approximately 4 metric tons that was taken from a greisen body during a pilot project to the current exploration program by Solarworld AG. The entire bulk sample was crushed at the UVR-FIA GmbH, Freiberg, using a jaw crusher with a gap width of 35 mm. The resultant product was homogenized and split up in two representative subsamples at the Department of Mechanical Process Engineering and Mineral Processing of the TU Bergakademie Freiberg. The entire process is illustrated in Figure 1.
2.1. Conventional Comminution Procedure
The first representative subsample was passed through a
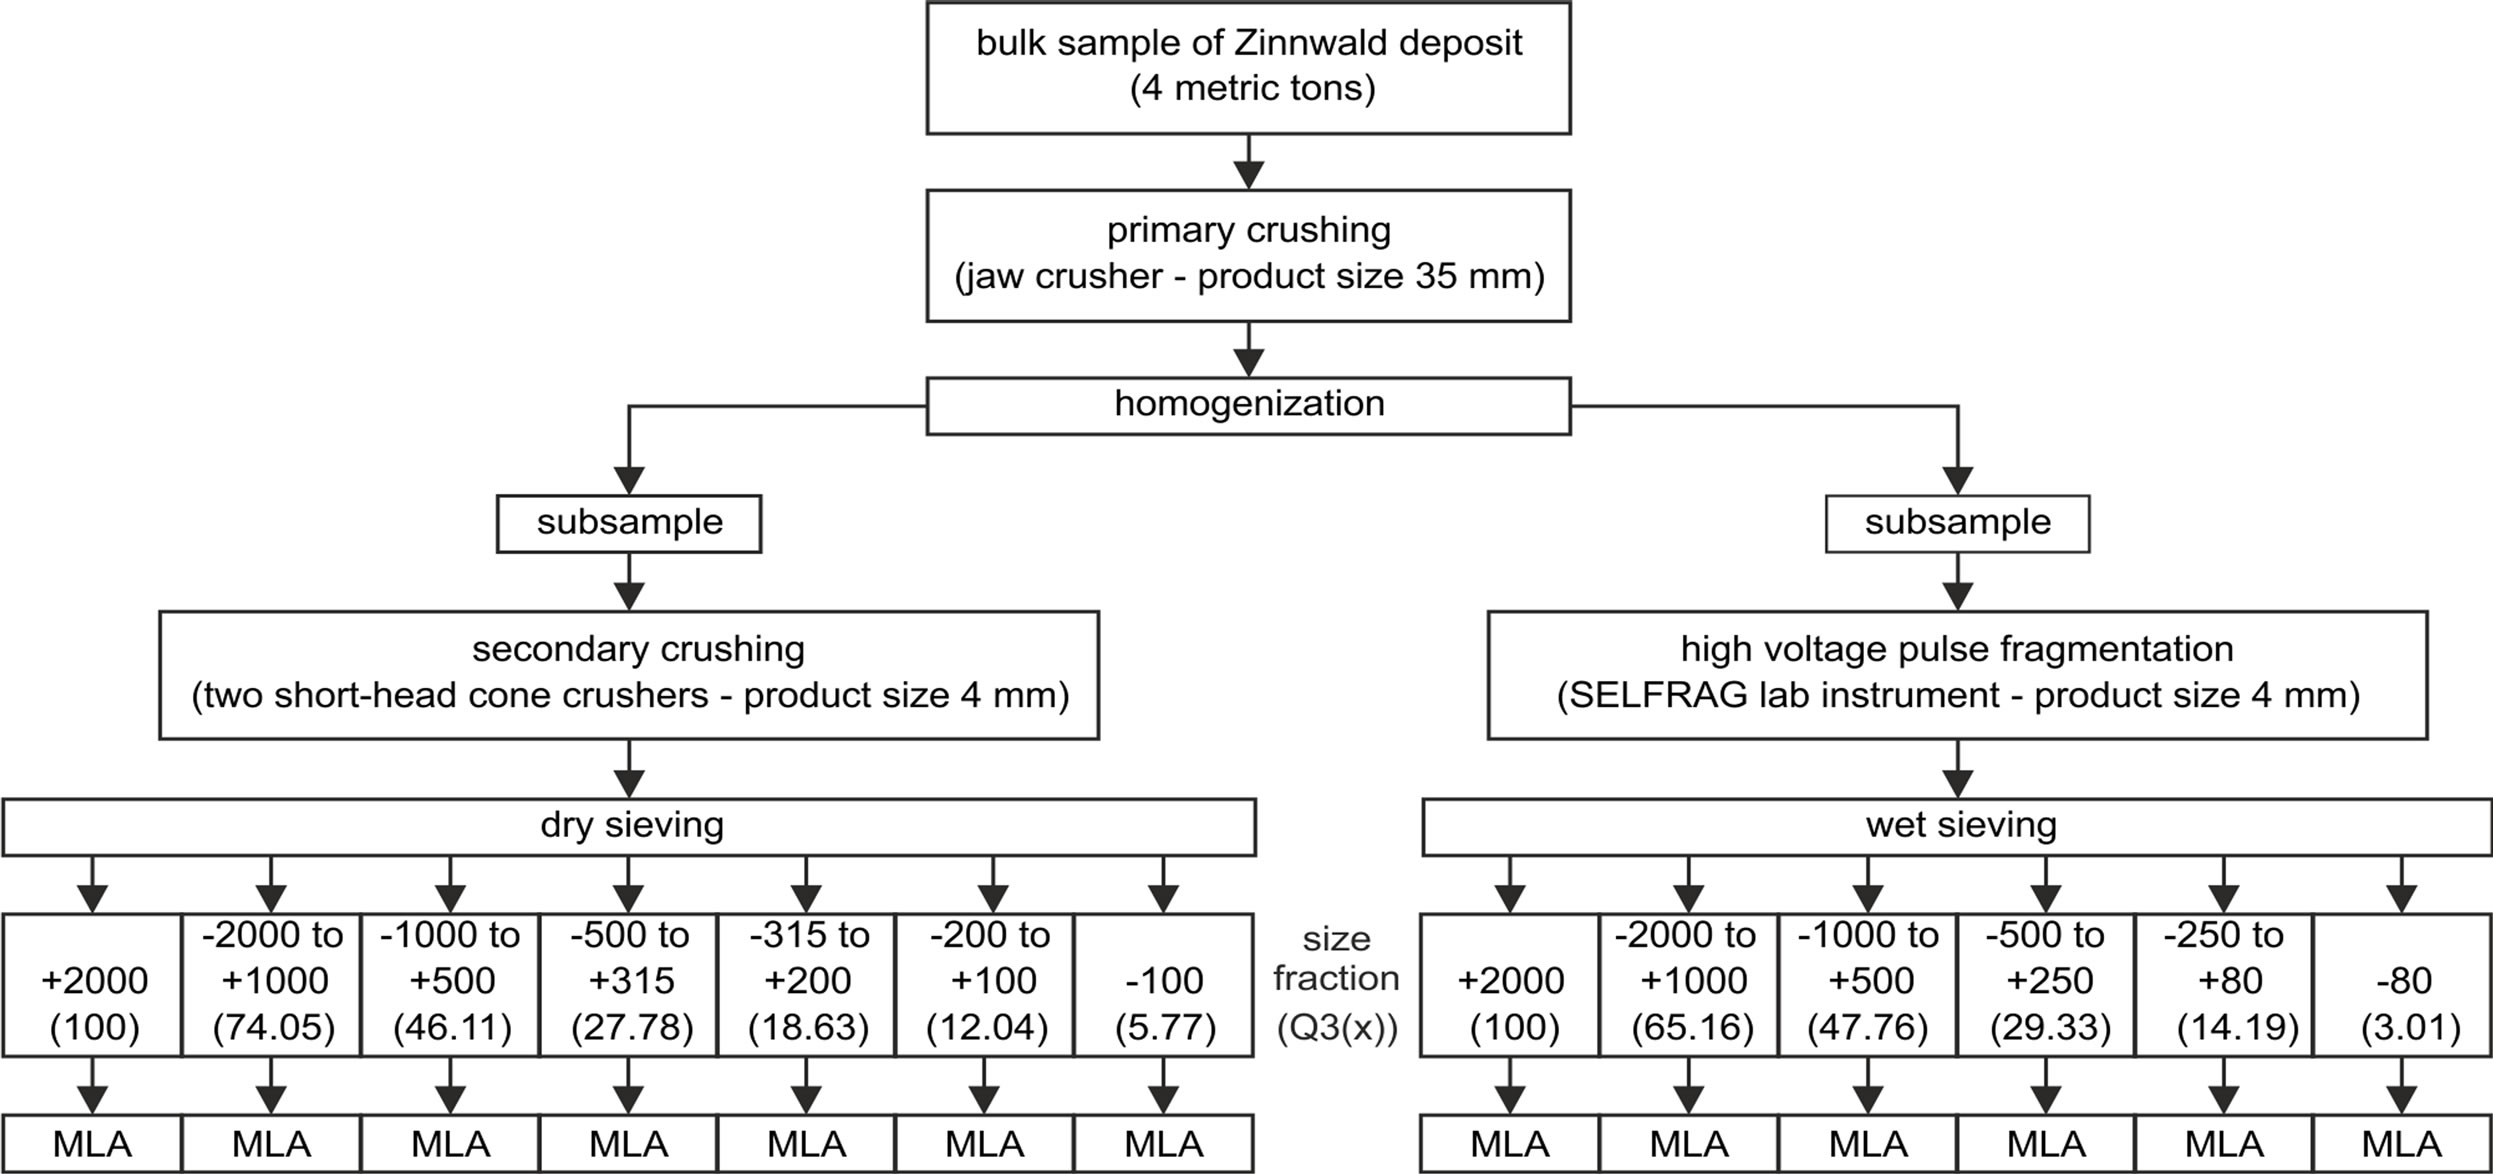
Figure 1. Flowchart of the sample processing during this study (Note: sieve fractions are given in µm and the related cumulative distribution Q3(x) in %).
short-head cone crusher with a product size of 4 mm at the Department of Mechanical Process Engineering and Mineral Processing of the TU Bergakademie Freiberg. A representative subsample was taken and sized into seven sieve fractions (Figure 1), used for Mineral Liberation Analysis (MLA).
2.2. High Voltage Pulse Power Technology
A second subsample of crushed greisen was used as educt for high voltage pulse fragmentation. A SELFRAG lab instrument [1,9,10], installed at the Department of Geology, TU Bergakademie Freiberg, was used for this purpose. The following instrument settings were used: voltage of the output impulse generator 150 kV, pulse frequency 3.3 Hz, and working electrode gap 10 to 40 mm. An amount of 2 kg was processed using the SELFRAG instrument feed sieve of 4 mm and on average 200 - 300 pulses. The product of high voltage pulse fragmentation was classified into six sieve fractions (Figure 1) for MLA analysis.
2.3. Mineralogical and Microfabric Analysis
All 13 subsamples were prepared as polished grain mounts at the Department of Mineralogy, TU Bergakademie Freiberg. Great care was taken to avoid preferred orientation of the zinnwaldite mica that tends to form thin plates on fragmentation. Several steps of sample preparation as described by Jackson [11] were conducted including random subsampling by a rotary riffler, mixing the sample with crushed graphite and mechanical shaking of the mixture in cylindrical plastic moulds.
Quantitative studies of mineralogy and microfabric were performed at the Department of Mineralogy, TU Bergakademie Freiberg, using a FEI MLA 600F system [2,3,12]. The scanning electron microscope FEI Quanta 600F is equipped with a field emission source (FEG) and two SDD-EDS X-ray spectrometers (Bruker X-Flash) combined with Mineral Liberation Analysis (MLA) software. The polished grain mounts were carbon-coated prior to measurement to obtain an electrically conducting surface. The samples were analyzed with a grain X-ray mapping measurement mode (“GXMAP”) at a magnification of 175 times and a X-ray mapping threshold for back scattered electron (BSE) image grey values of 25. The analytical working distance was 10.9 mm, the emission current 190 µA, the probe current 10 nA and the overall electron beam accelerating voltage 25 kV. Standard BSE image calibration was set with epoxy resin as background (BSE grey value <25) and gold as upper limit (BSE grey value >250). See further detail to MLA measurement modes in [2].
3. Results and Discussion
The results of MLA measurements provide a broad range of mineralogical and processing parameters [2,3]. The most relevant parameters for the evaluation of effectiveness of conventional as well as high voltage pulse power treatment are presented hereinafter.
It should be noted that systematic errors can be induced by sample preparation and MLA analysis methods. As it is difficult to quantify them, a precise sample preparation, which comprehends and minimizes preparation problems, is needed to scale down the systematic errors [13].
3.1. Particle Size Distribution/Mineral Grain Size Distribution
The results of particle size distribution of the combined data for all size fractions show a minor amount of top sized material and a larger quantity of finest material for both the conventional comminution subsample as well as the high voltage pulse power subsample (Figure 2(a)). The same applies to the zinnwaldite grain size distribution which shows nearly the same distribution as the corresponding particle sizes (Figure 2(b)). It must be noted
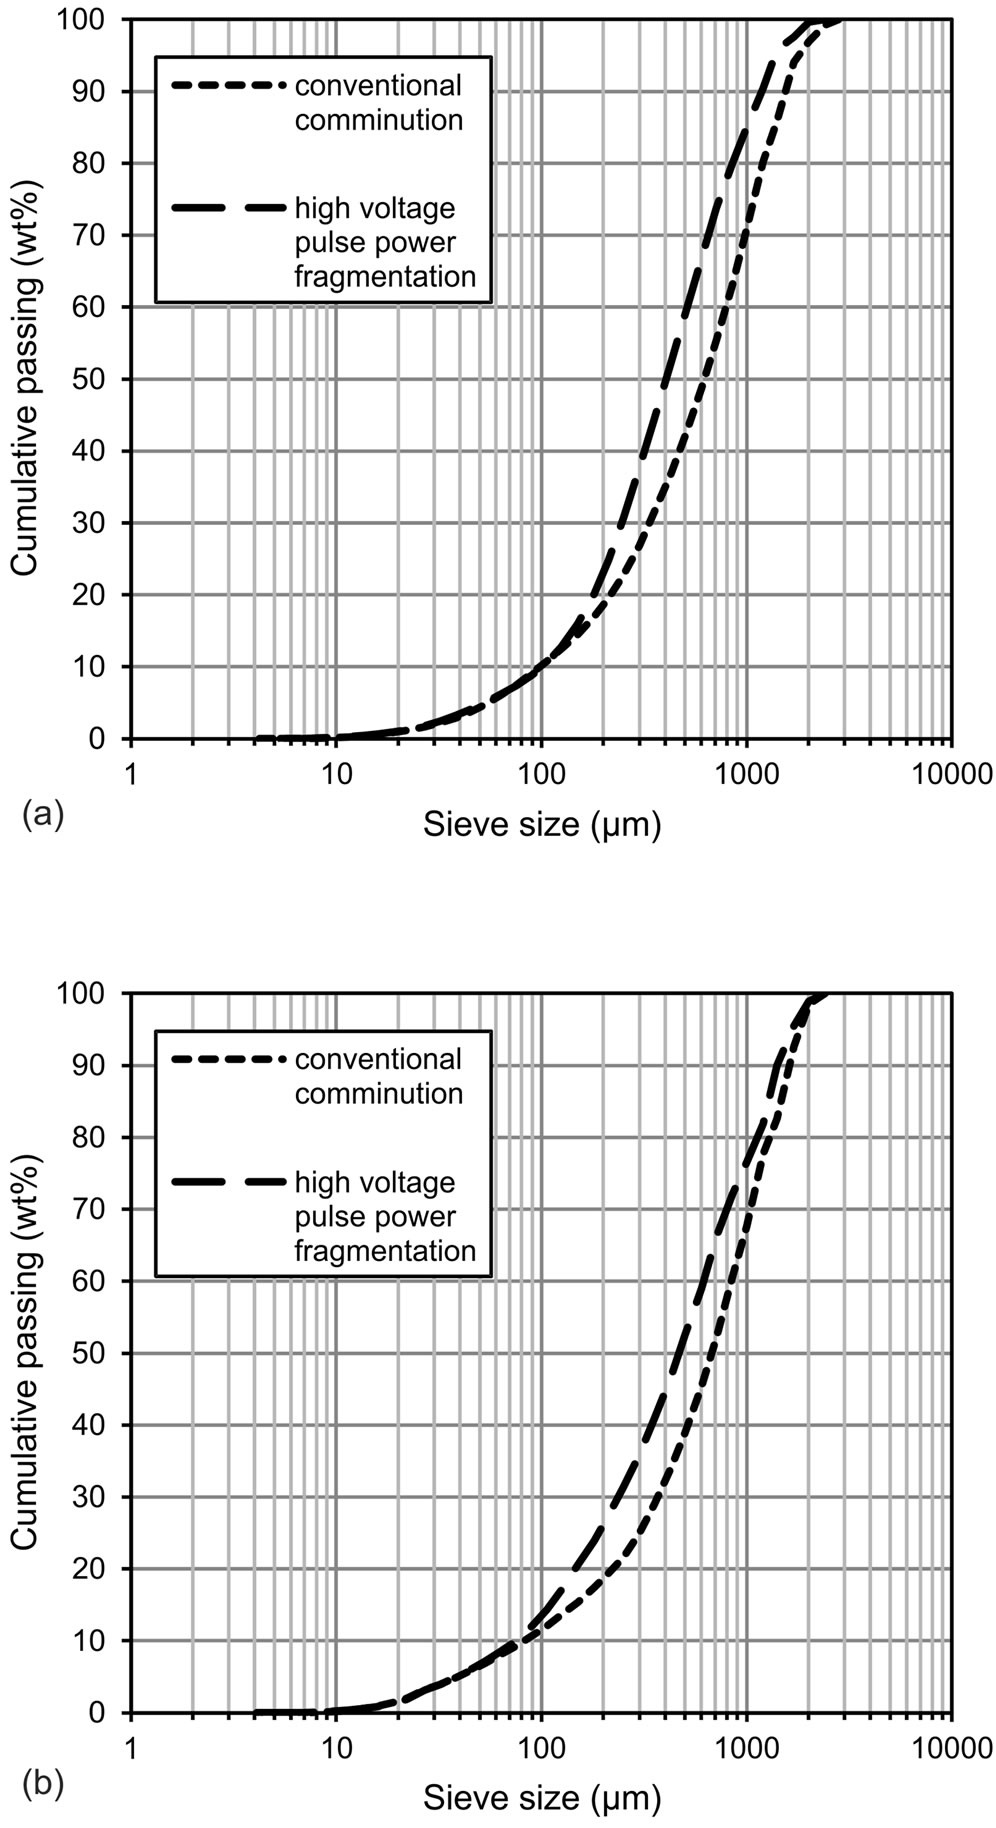
Figure 2. Particle size distribution (a) and zinnwaldite mineral grain size distribution (b) of the combined data for all size fractions for the conventional comminution subsample and the high voltage pulse power fragmentation subsample.
that the sizes obtained by the mineral liberation analysis are measured in 2D using the equivalent circle diameter of the particle respectively grain area. These 2D generated size data give in general a smaller size in comparison to 3D data. In spite of this obvious limitation it has been shown by a recent study that size data measured by image analysis systems are in general in good agreement to other size distribution measurement systems [14].
3.2. Modal Mineralogy
The data of modal mineralogy obtained by this MLA study corroborate previous results of transmitted-light microscopic studies [15-17]. Light-microscopic observations of polished thin sections showed that zinnwaldite and quartz are usually coarse-grained with mineral grain/ aggregate sizes of 5 - 6 mm. Topaz mineral grains are ordinarily somewhat smaller (up to 1 mm).
Main constituents of the two subsamples analyzed here are quartz, zinnwaldite, and topaz. Further minerals in minor portions are muscovite, kaolinite, fluorite, hematite as well as in small quantities (each <0.1 wt%) barite, crandallite, cassiterite, dolomite, columbite, scheelite, monazite, zircon, xenotime, florencite, siderite, cerphosphorhuttonite, gypsum, apatite, wolframite, ilmenorutile, sphalerite, chernovite, and uraninite. Both subsamples display varying proportions of main minerals in the larger sieve fractions, whereas the amount of zinnwaldite is more consistent in fractions of smaller particle size (−315 µm in the conventional sample and −500 µm in the high voltage pulse power sample). In relation to the combined educt sample there is a concentration of muscovite, kaolinite, fluorite and hematite in the finest fraction as well as a distinct enrichment of topaz in the fraction −500 to +100 µm respectively +80 µm (Figure 3). This can be interpreted by the different physical properties of the minerals. For example, topaz is much harder (Mohs hardness 8) than the minerals enriched in the smallest fraction (e.g. kaolinite with Mohs hardness 2) and need more specific energy to become comminuted.
It should be mentioned that a test of high-intensity magnetic separation of zinnwaldite ore was conducted with material from both subsamples, but is not part of this paper. In a recent paper by Leißner [18] the entire mineral processing (comminution and magnetic separation) of the zinnwaldite-bearing greisen-type ore from the Zinnwald deposit is discussed. The authors show that in all chosen size fractions liberation efficiencies are better than separation efficiencies for zinnwaldite and conclude that the separation process should be improved for process optimization.
3.3. Mineral Locking and Mineral Association
Mineral locking and mineral association data as gener-
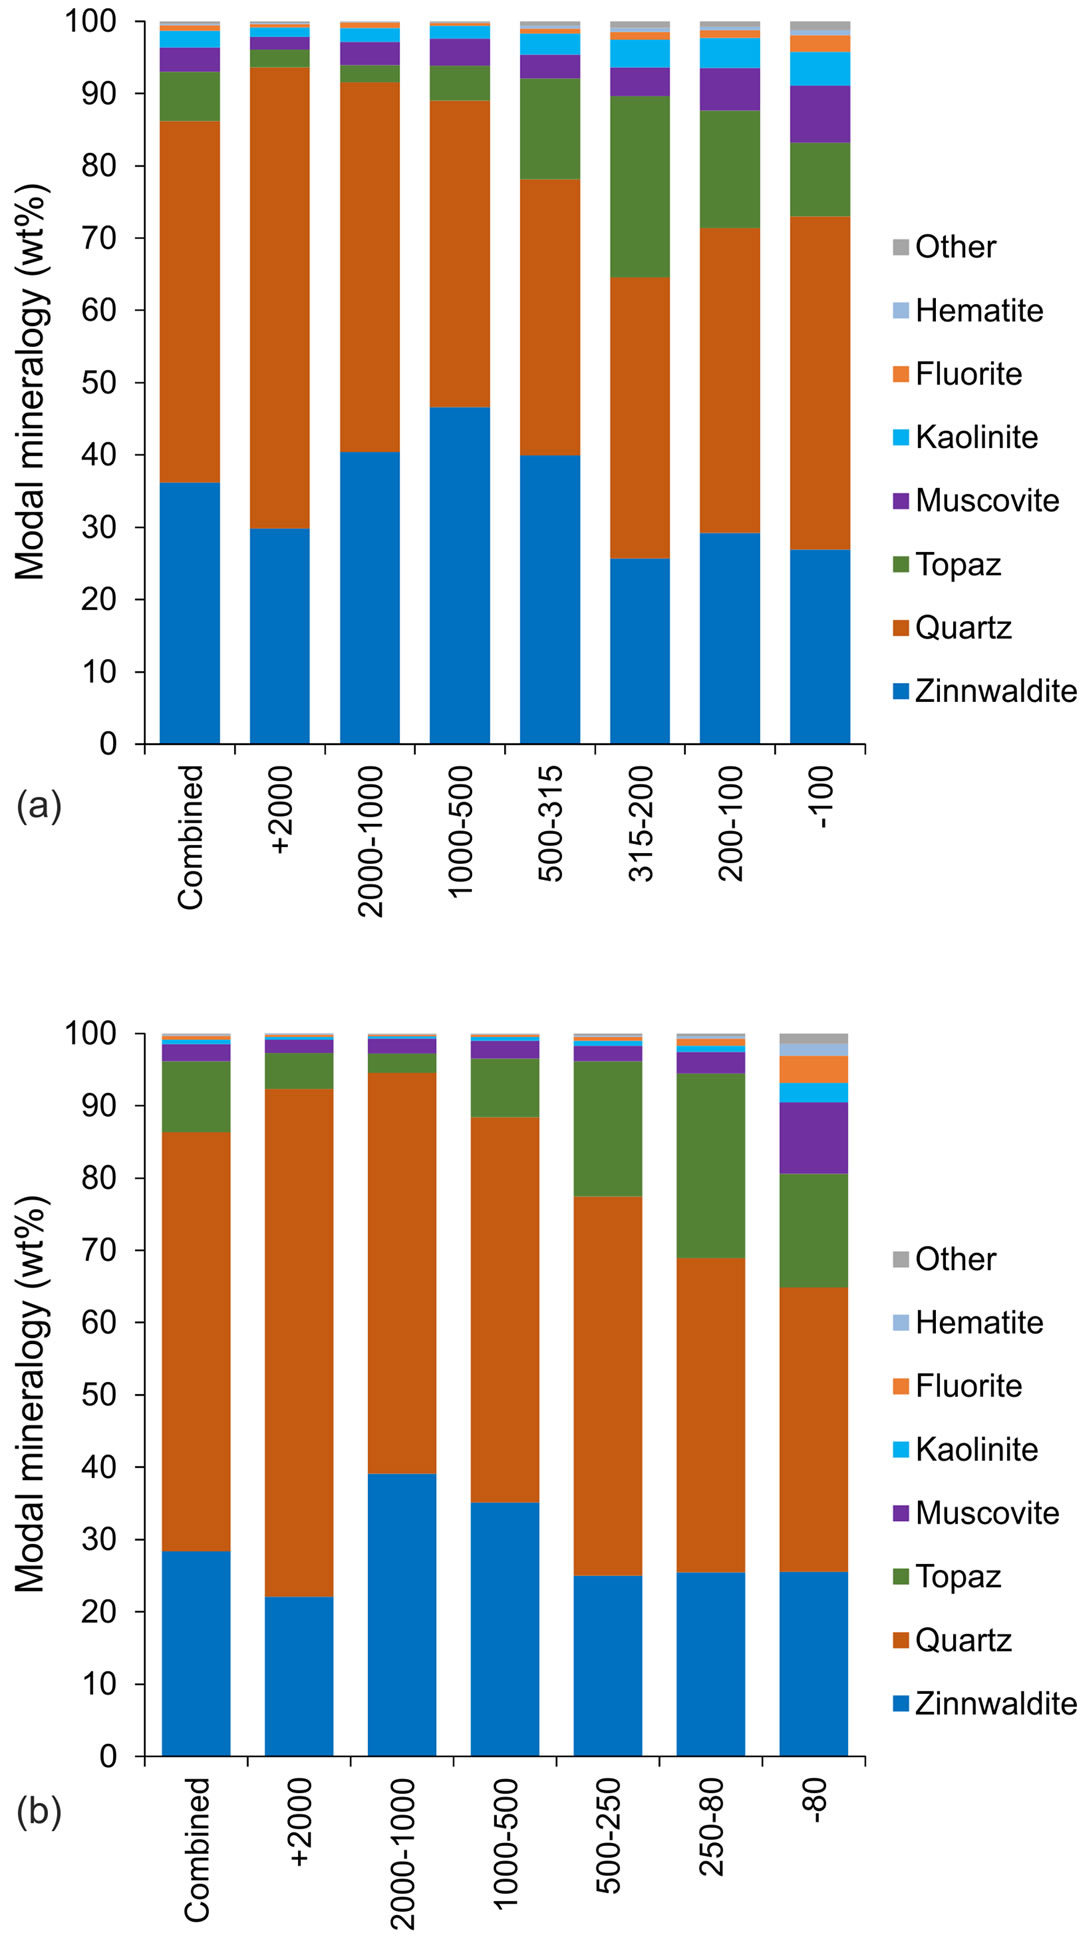
Figure 3. Modal mineralogy of MLA measurements for the subsample from conventional comminution (a) and high voltage pulse power fragmentation (b). The diagram shows as well the data of the educt (“combined”) as the data for the different sieve fractions.
ated by MLA give valuable assistance to estimate the grade of associated minerals (e.g., gangue), which is important to optimize the mineral beneficiation process. The diagram of zinnwaldite mineral associations shows in general a decreasing amount of associated minerals respectively an increasing amount of non-associated zinnwaldite grains in smaller size fractions for both subsamples (Figure 4). Zinnwaldite mineral grains that are not fully liberated are more associated with one mineral (“binary particles”) than two or more minerals (“ternary+ particles”) (for examples see Figure 5). The results of mineral association data reflect roughly the results of modal mineralogy with quartz, muscovite, topaz and kaolinite as the main minerals associated with zinnwaldite. It can be noted that the quartz-muscovite ratio in the zinnwaldite mineral association results (≤1) is much lower than expected from the results of modal mineralogy (quartz-muscovite ratio: >5). This means that the muscovite-zinnwaldite grain boundary breakage is not as
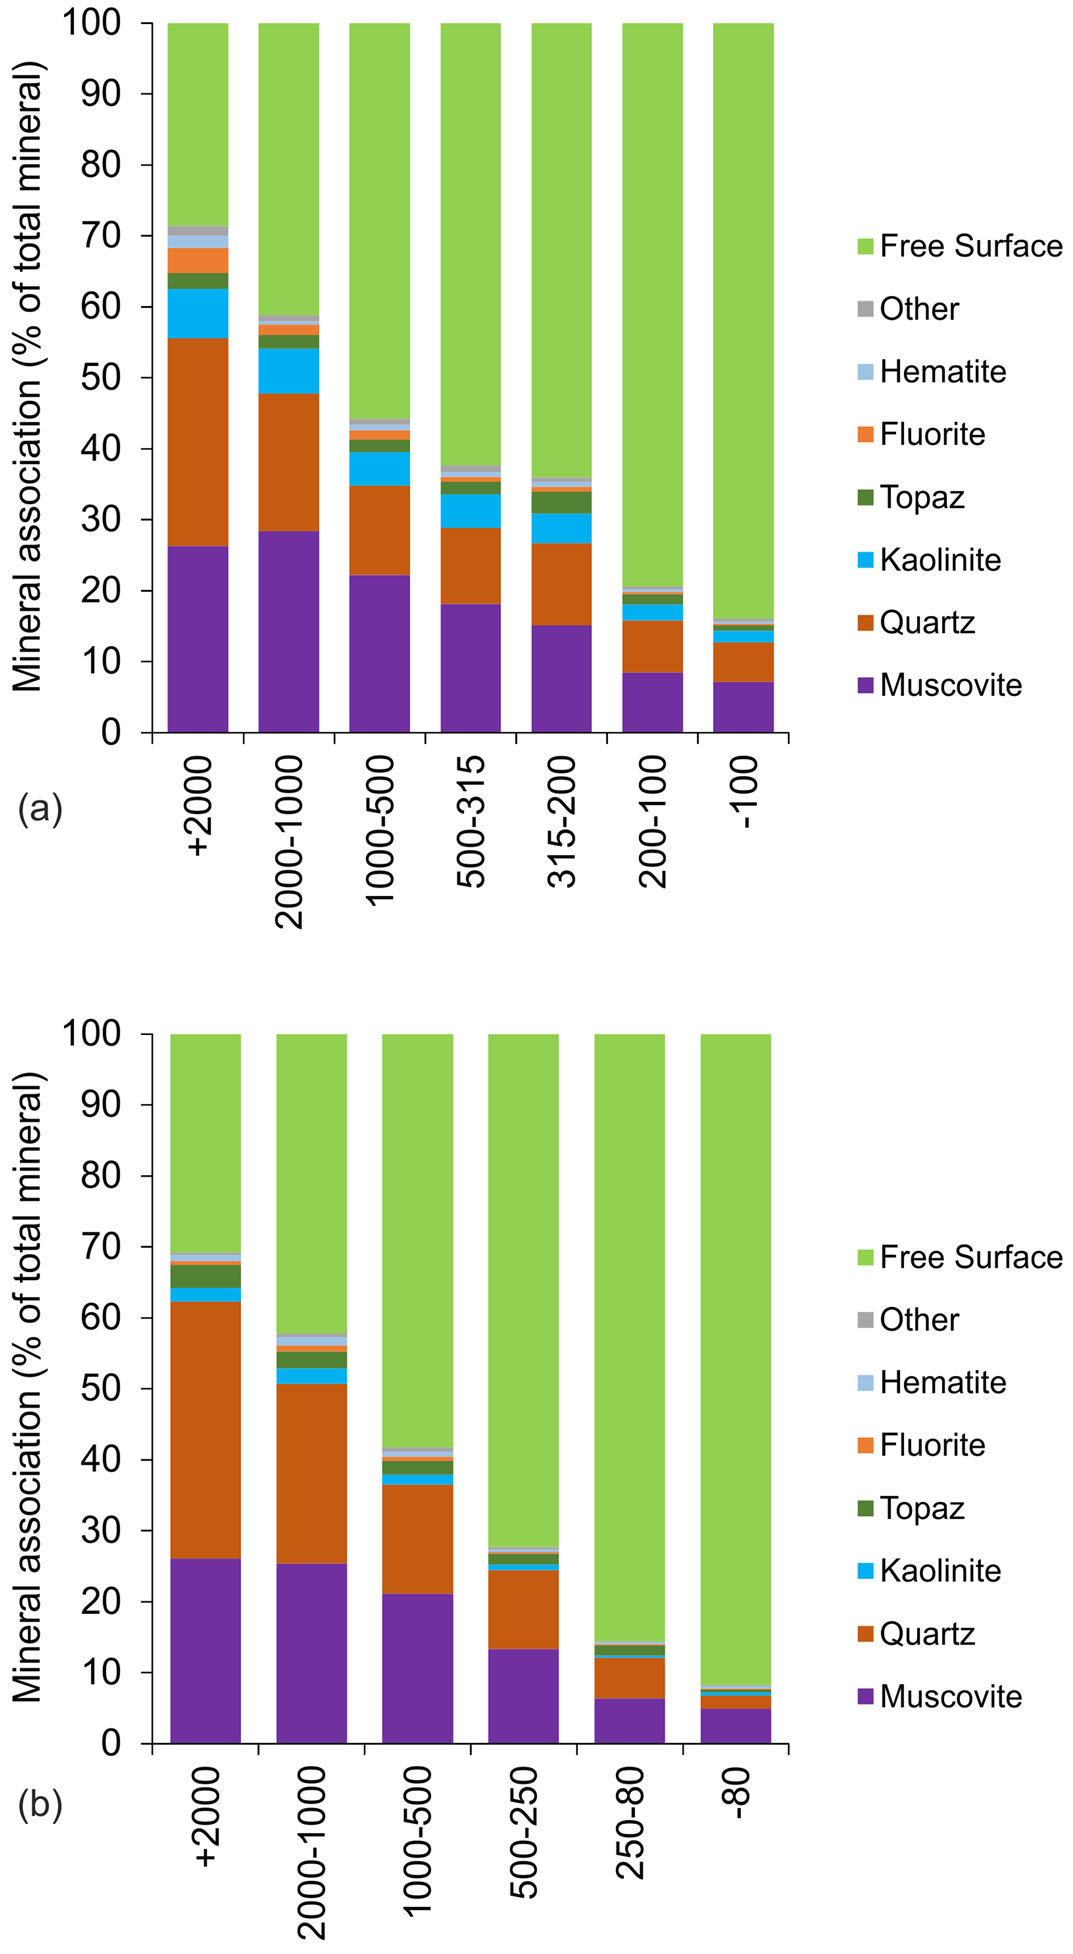
Figure 4. Mineral association for zinnwaldite mineral grains in the different sieve fractions from conventional comminution (a) and high voltage pulse power fragmentation (b).
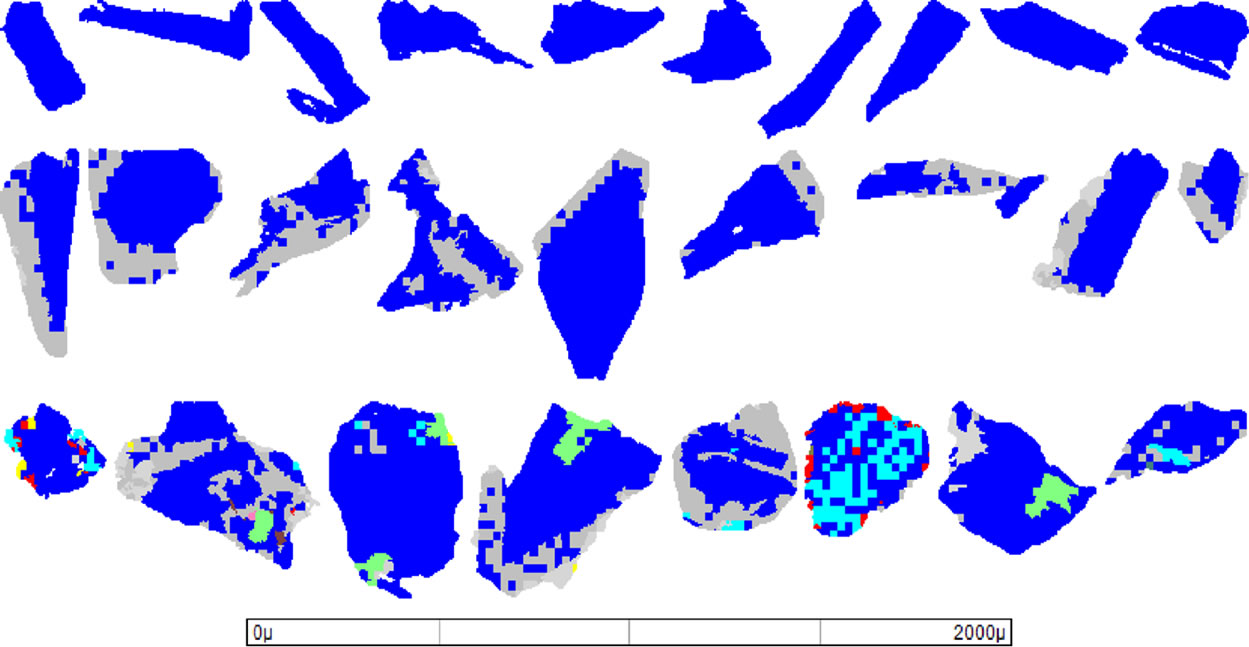
Figure 5. Line-up of three groups of different zinnwaldite locking characteristics (Row 1—liberated zinnwaldite grains; Row 2—binary (with only one other phase) locked zinnwaldite grains; Row 3—ternary and higher (with more than one phase) locked zinnwaldite grains) from the conventional comminution subsample.
good as the quartz-zinnwaldite grain boundary breakage. This can be observed in both the conventional comminution subsample and the high voltage pulse power subsample and is explained by the overgrowth and replacement of zinnwaldite by muscovite in a younger greisenization stage (Figure 6).
3.4. Mineral Liberation
The mineral liberation by particle composition diagram for zinnwaldite-bearing particles shows not completely an increasing degree of liberation from smaller sieve fractions for both conventional comminution and high voltage pulse power subsamples (Figure 7). This applies only for the three largest sieve fractions. The sieve fraction −500 to +315 µm resp. −500 to +250 µm shows, in contrast, a worse degree of liberation as compared to sieve fractions −1000 to +500 µm, which is the best liberated fraction. The two smallest sieve fractions are again not as good liberated as sieve fraction −500 to +315 µm resp. −500 to +250 µm. All these apply for both conventional comminution and high voltage pulse power subsamples. The shape of the different curves is related to its starting point of the curve at the 100% liberation class. The curves with a small amount of particles in this class show a rapid increase in particles in the 90% - 95% liberation class. Curves with a higher starting point show a lower rise.
3.5. Theoretical Grade Recovery
Theoretical grade-recovery curves are defined by the maximal expected recovery of a mineral at a given grade. These curves are related to the comminution size of the treatment process and determined from the liberation characteristics. It should be noted that theoretical graderecovery curves are defined for the value minerals (e.g., zinnwaldite) and not based on a final product (e.g., metal or compound) to be recovered. Furthermore, it is important to advise that the theoretical grade-recovery curves provided by the MLA are generated from 2D liberation measurements and therefore overestimate the true liberation by a certain amount [19].
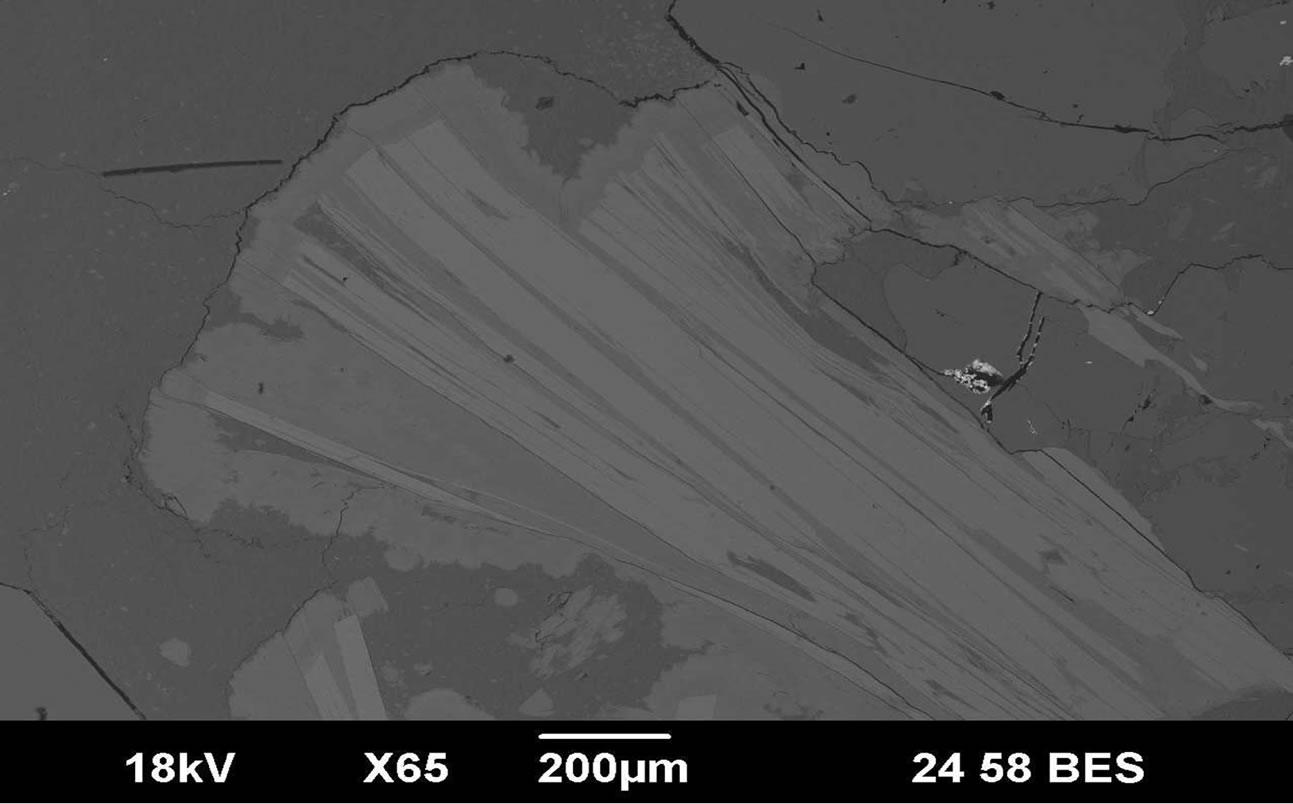
Figure 6. Intense overgrowth and replacement of zinnwaldite (light gray; elongated) by muscovite (medium grey) in a younger greisenization stage (BSE image from [4]).
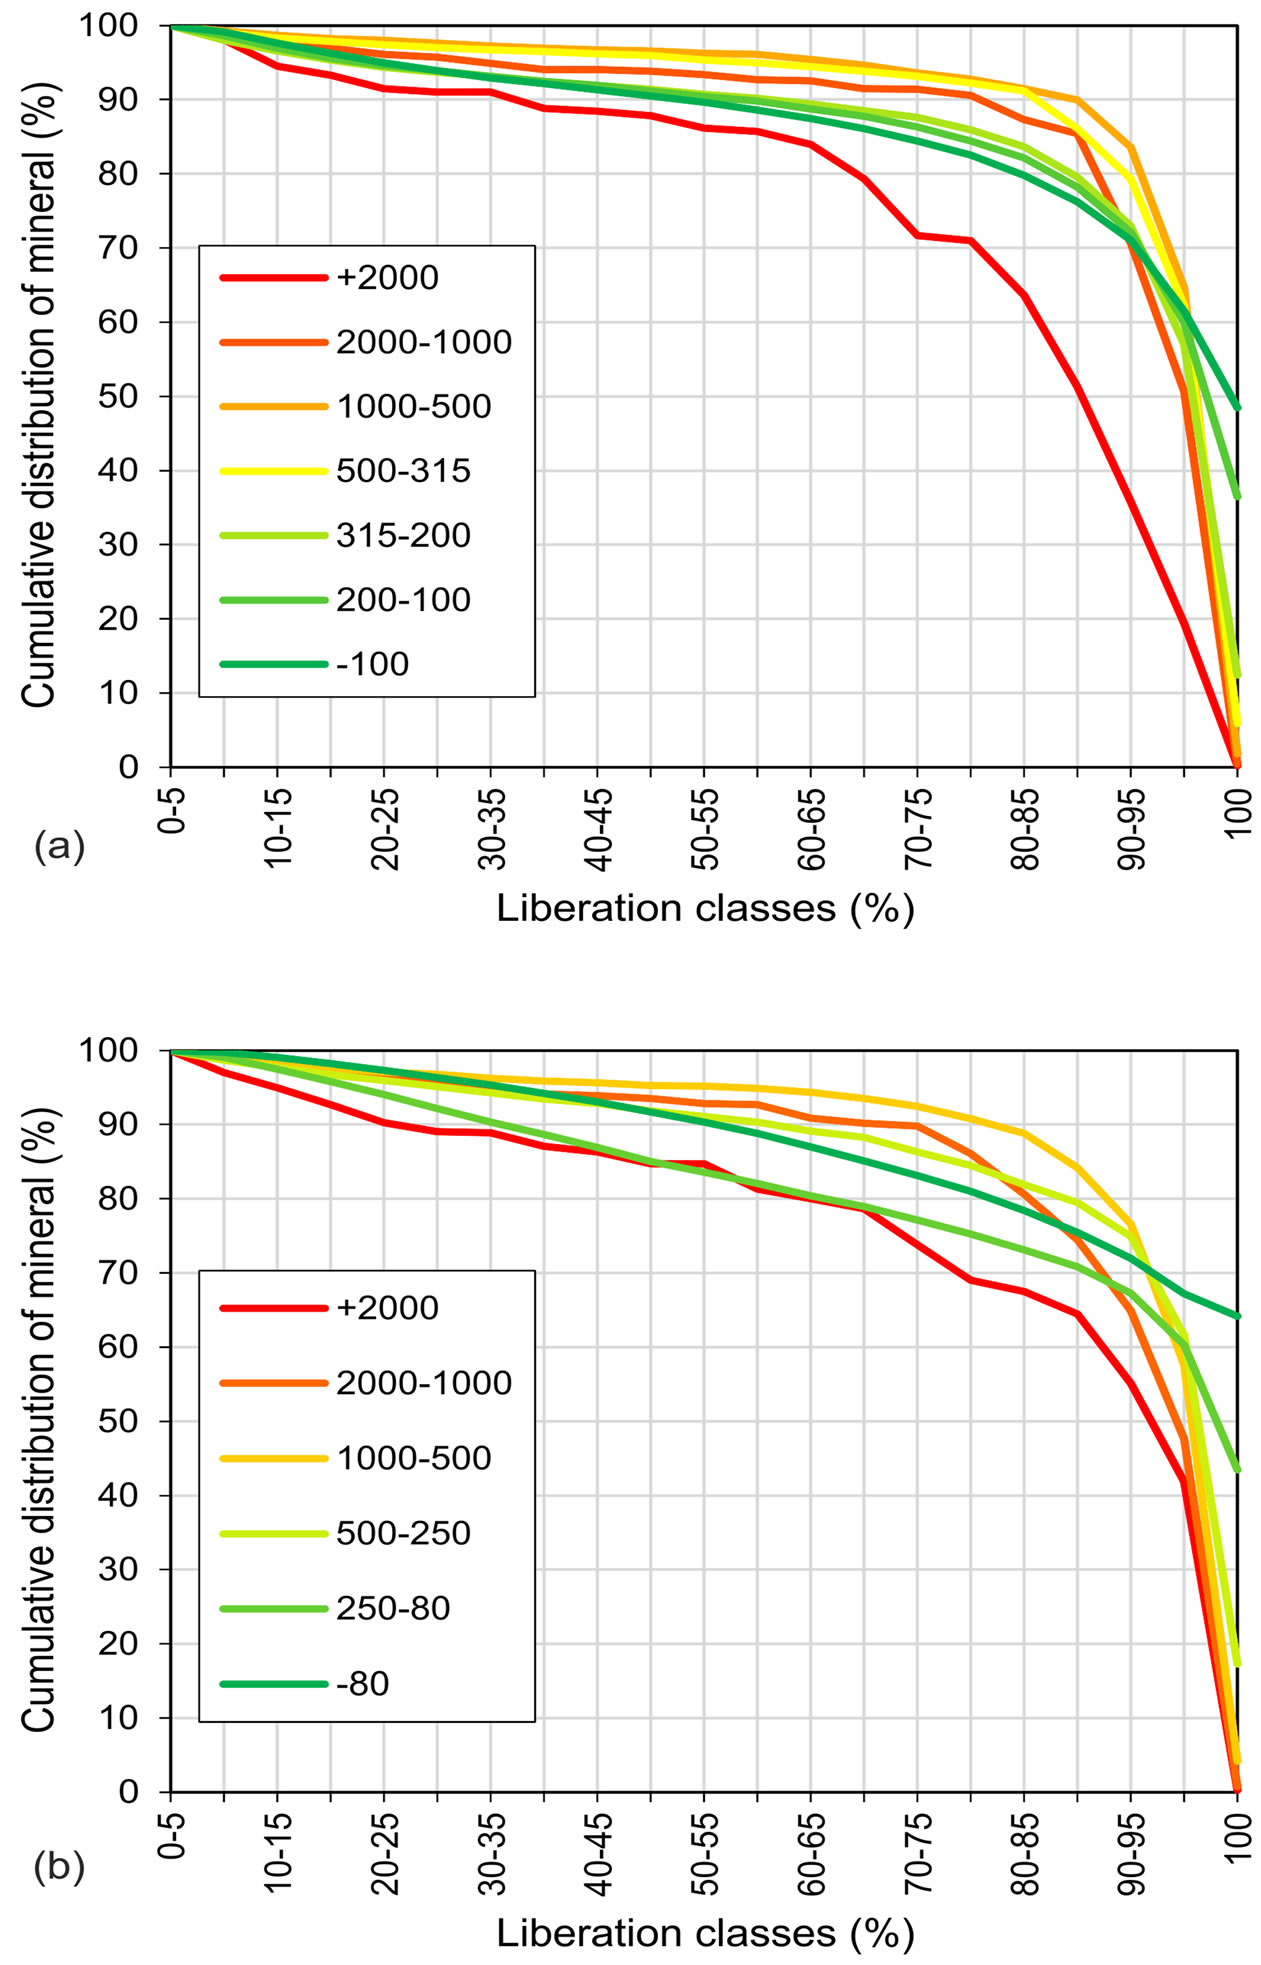
Figure 7. Mineral liberation by particle composition for zinnwaldite mineral grains in different sieve fractions from conventional comminution (a) and high voltage pulse power fragmentation subsamples (b).
The theoretical grade-recovery curves for zinnwaldite in Figure 8 give reason to expect best results for zinnwaldite recovery in the sieve fraction −1000 to +500 µm for both the conventional comminution subsample and the high voltage pulse power fragmentation subsample.
4. Conclusions
It has been shown that for zinnwaldite-bearing materials from a greisen, ore-type high recovery rates can be reached for both the high voltage pulse power fragmentation (SELFRAG technology) and the conventional particle comminution. From the grade recovery curves, it is obvious that optimal results for both processes could be achieved from the 1000 - 500 µm size fraction. Smaller and larger size fractions show poorer results for the zinnwaldite recovery. In contrast, the results of the zinnwaldite mineral association show a continuous decrease in associated minerals and an increasing amount of liberated zinnwaldite grains by the decline of particle size
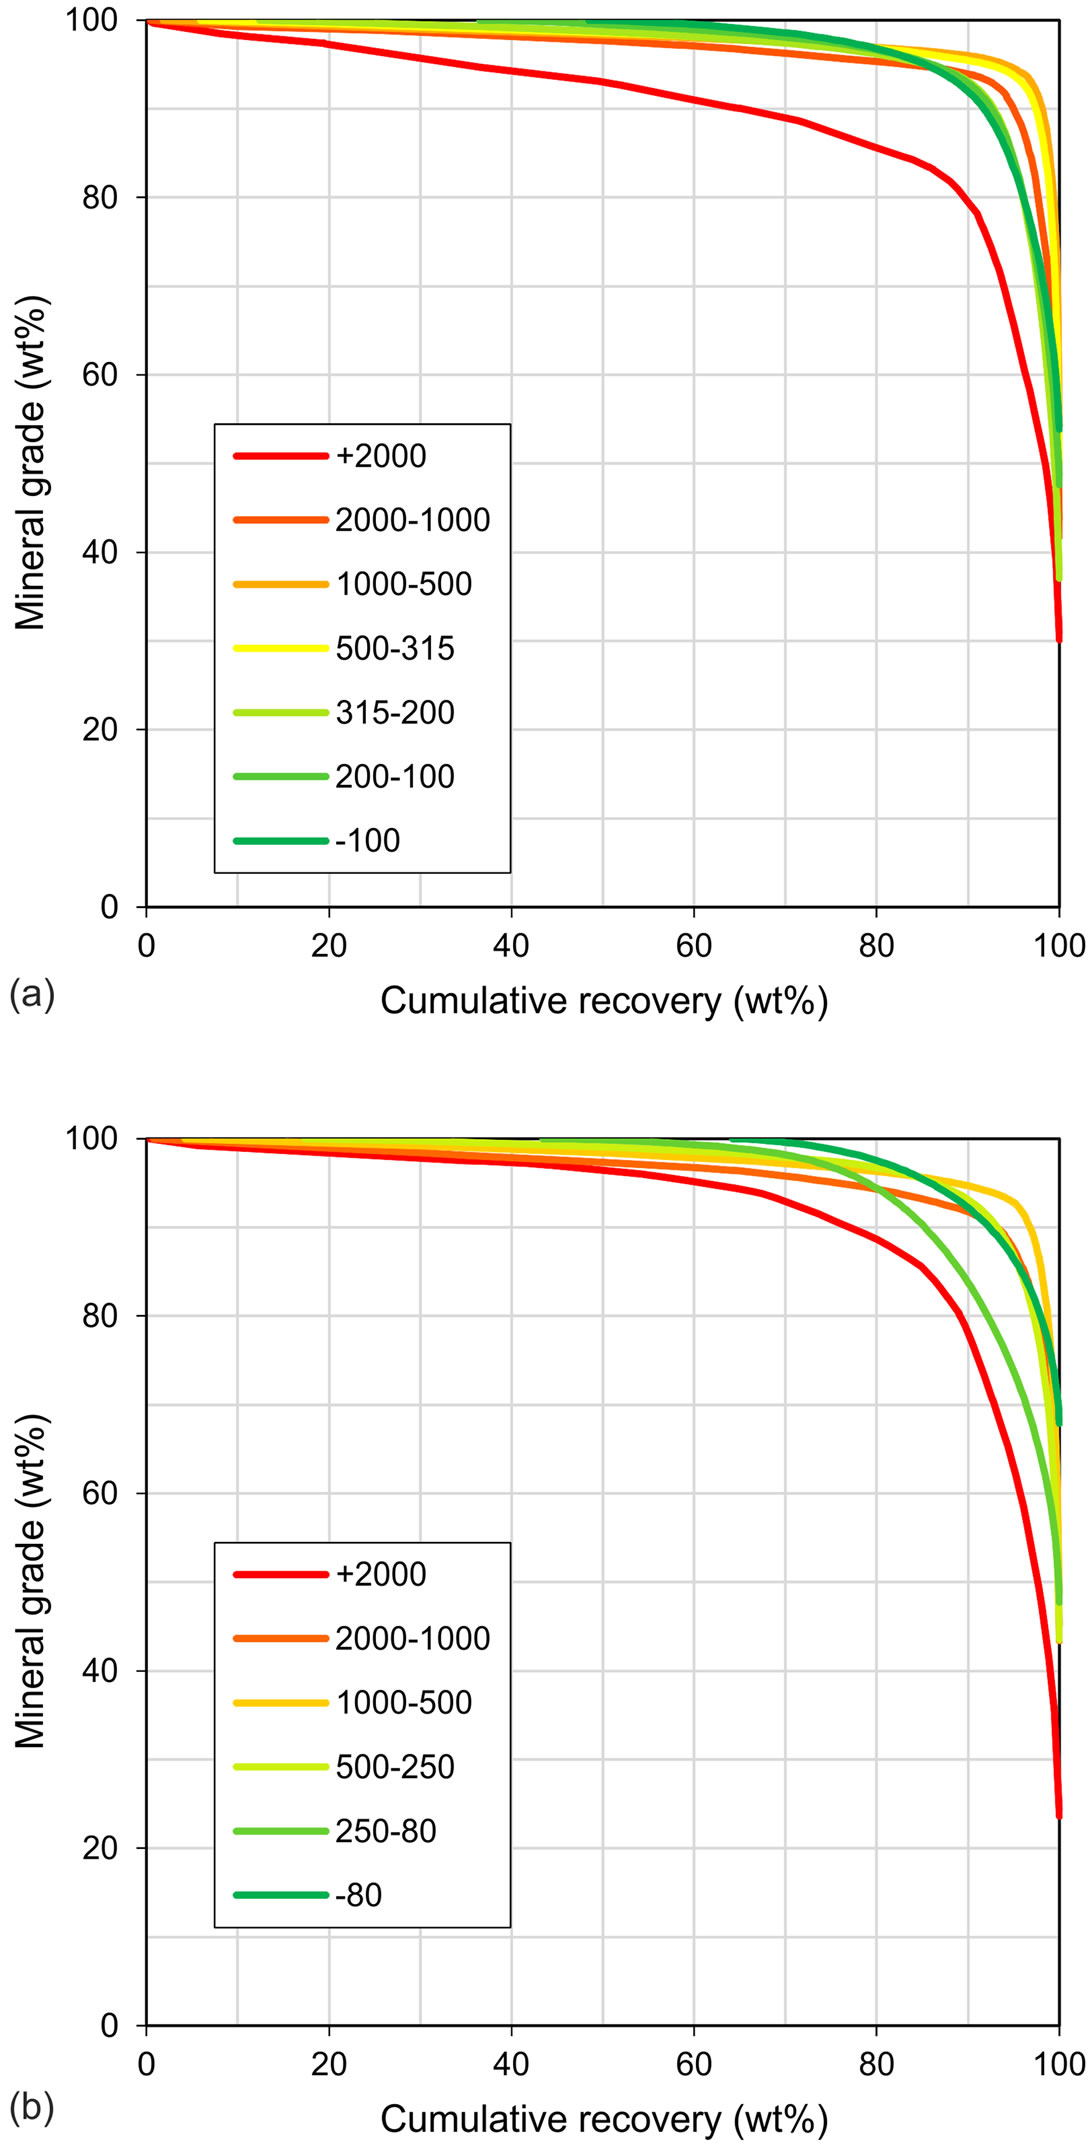
Figure 8. Theoretical grade recovery curve for zinnwaldite mineral grains in different sieve fractions from conventional comminution (a) and high voltage pulse power fragmentation subsamples (b).
fractions.
To further assess the quality of size and liberation/recovery data of this MLA study, 3D measurements could be useful. This has been studied for the example of phosphate samples by X-ray micro-computer tomography, with better results in comparison to a 2D analysis [20].
Due to the method setting of this study, it was not possible to conduct a direct comparison between the effectivity of the two comminution methods. However, a recent study by [21] indicates on the example of sulfide ores and PGM ores that high voltage pulse power fragmentation generates a coarser product with significantly less fines than the conventional mechanical comminution and that minerals of interest in the high voltage pulse power product are better liberated than that in the conventional product. It should be considered that various minerals can have a different behavior (depending on e.g., electric conductivity, mineral cleavage, discontinuities in the material and much more) at the high voltage pulse power fragmentation. Hence, the results of single studies should not be transferred to another type of material without a reinvestigation. For a decision between different comminution techniques, factors as throughput rates, processing time, energy costs or water consumption should be examined too as they will affect the processing efficiency and overall costs.
The present study demonstrates the capabilities of automated SEM-based image analysis systems, such as the Mineral Liberation Analyser (MLA), for the evaluation of industrial comminution processes. The obtained data provide valuable key information on quantitative mineralogy, mineral association, particle and mineral grain sizes, as well as mineral liberation and theoretical recovery data. Results illustrate that a MLA system can be used to constrain parameters relevant to assess comminution success in a fast and reproducible way.
5. Acknowledgements
The authors would like to thank Thomas Zschoge from the Department of Mechanical Process Engineering and Mineral Processing (TU Bergakademie Freiberg) for supporting the conventional comminution as well as Thomas Mütze and Thomas Leistner from the same department for fruitful discussions and helpful suggestions. For instruction in sample processing by high voltage pulse fragmentation, we thank Peter Segler from the Department of Geology (TU Bergakademie Freiberg). The preparation of polished grain mounts and the support during MLA measurement by Sabine Haser and Bernhard Schulz of the Department of Mineralogy, TU Bergakademie Freiberg is gratefully acknowledged. This study was supported by the Nordic Researcher Network on Process Mineralogy and Geometallurgy (ProMinNET) and was carried as part of a BMBF-funded research project (Hybride Lithiumgewinnung, Project No. 030203009).
REFERENCES
- L. Beloqui, J. M. Usategui, E. Wang, F. Shi and E. Manlapig, “Pre-Weakening of Mineral Ores by High Voltage Pulses,” Minerals Engineering, Vol. 24, No. 5, 2011, pp. 455-462. http://dx.doi.org/10.1016/j.mineng.2010.12.011
- R. Fandrich, Y. Gu, D. Burrows and K. Moeller, “Modern SEM-Based Mineral Liberation Analysis,” International Journal of Mineral Processing, Vol. 84, No. 1-4, 2007, pp. 310-320.
- Y. Gu, “Automated Scanning Electron Microscope Based Mineral Liberation Analysis an Introduction to JKMRC/ FEI Mineral Liberation Analyser,” Journal of Minerals and Materials Characterization and Engineering, Vol. 2, No. 1, 2003, pp. 33-41.
- P. Atanasova, “Mineralogy, Geochemistry and Age of Greisen Mineralization in the Li-Sn(-W) Deposit Zinnwald, Eastern Erzgebirge, Germany,” Master Thesis, Technische Universität Bergakademie, Freiberg, 2012.
- T. G. Goonan, “Lithium Use in Batteries,” U.S. Geological Survey Circular 1371, 2012.
- E. Siame and R. D. Pascoe, “Extraction of Lithium from Micaceous Waste from China Clay Production,” Minerals Engineering, Vol. 24, No. 14, 2011, pp. 1595-1602. http://dx.doi.org/10.1016/j.mineng.2011.08.013
- L. Baumann, E. Kuschka and T. Seifert, “Lagerstätten des Erzgebirges,” ENKE im Georg Thieme Verlag, Stuttgart, 2000.
- K. Govindaraju, I. Rubeska and T. Paukert, “Report on Zinnwaldite ZW-C Analysed by Ninety-Two GIT-IWG Member-Laboratories,” Geostandards Newsletter, Vol. 18, No. 1, 1994, pp. 1-42. http://dx.doi.org/10.1111/j.1751-908X.1994.tb00502.x
- H. Bluhm, W. Frey, H. Giese, P. Hoppé, C. Schultheiß and R. Sträßner, “Application of Pulsed HV Discharges to Material Fragmentation and Recycling,” IEEE Transactions on Dielectrics and Electrical Insulation, Vol. 7, No. 5, 2000, pp. 625-636. http://dx.doi.org/10.1109/94.879358
- E. Dal Martello, S. Bernardis, R. B. Larsen, G. Tranell, M. Di Sabatino and L. Arnberg, “Electrical Fragmentation as a Novel Route for the Refinement of Quartz Raw Materials for Trace Mineral Impurities,” Powder Technology, Vol. 224, 2012, pp. 209-216. http://dx.doi.org/10.1016/j.powtec.2012.02.055
- B. R. Jackson, A. F. Reid and J. C. Wittemberg, “Rapid Production of High Quality Polished Sections for Automated Image Analysis of Minerals,” Proceedings of the Australasian Institute for Mining and Metallurgy, Vol. 289, 1984, pp. 93-97.
- M. MacDonald, B. Adair, D. Bradshaw, M. Dunn and D. Latti, “Learnings from Five Years of On-Site MLA at Kennecott Utah Copper Corporation,” Proceedings of the 10th International Congress for Applied Mineralogy (ICAM), Trondheim, 1-5 August 2011, pp. 419-426.
- K. Bachmann, S. Haser, T. Seifert and J. Gutzmer, “Preparation of Grain Mounds of Heterogeneous Mineral Concentrates for Automated Mineralogy—An Example of Li-Bearing Greisen from Zinnwald, Saxony, Germany,” Schriftenreihe der Deutschen Gesellschaft für Geowissenschaften, Vol. 80, 2012, p. 395.
- N. Vlachos and I. T. H. Chang, “Graphical and Statistical Comparison of Various Size Distribution Measurement Systems Using Metal Powders of a Range of Sizes and Shapes,” Powder Metallurgy, Vol. 54, No. 4, 2011, pp. 497-506. http://dx.doi.org/10.1179/003258910X12707304455022
- H. Bolduan, A. Lächelt and F. Malasek, “Zur Geologie und Mineralisation der Lagerstätte Zinnwald (Cinovec),” Freiberger Forschungshefte, Vol. C218, 1967, pp. 35-52.
- M. Sala, “Geochemische und Mineralogische Untersuchungen an Alterierten Gesteinen aus dem Kuppelbereich der Lagerstaette Zinnwald (Osterzgebirge),” Ph.D. Thesis (Dissertation), Technische Universität Bergakademie, Freiberg, 1999.
- O. Seibel, “Kartierung Ausgewählter Profile im Grubenbereich Zinnwald unter Besonderer Berücksichtigung Paragenetischer und Struktureller Aspekte von Granithochlagen,” Master Thesis (Diplomarbeit), Bergakademie Freiberg, Freiberg, 1975.
- T. Leißner, T. Mütze, K. Bachmann, S. Rode, J. Gutzmer and U. A. Peuker, “Evaluation of Mineral Processing by Assessment of Liberation and Upgrading,” Minerals Engineering, Vol. 53, 2013, pp. 171-173. http://dx.doi.org/10.1016/j.mineng.2013.07.018
- Min Assist, “What Is a Theoretical Grade-Recovery Curve? An Example,” 2009. http://www.minassist.com.au/blog/what-is-a-theoretical-grade-recovery-curve-an-example/
- J. D. Miller, C. L. Lin, L. Hupka and M. I. Al-Wakeel, “Liberation-Limited Grade/Recovery Curves from X-ray Micro CT Analysis of Feed Material for the Evaluation of Separation Efficiency,” International Journal of Mineral Processing, Vol. 93, No. 1, 2009, pp. 48-53. http://dx.doi.org/10.1016/j.minpro.2009.05.009
- E. Wang, F. Shi and E. Manlapig, “Mineral Liberation by High Voltage Pulses and Conventional Comminution with Same Specific Energy Levels,” Minerals Engineering, Vol. 27-28, 2012, pp. 28-36. http://dx.doi.org/10.1016/j.mineng.2011.12.005
NOTES
*Corresponding author.