Food and Nutrition Sciences
Vol.07 No.07(2016), Article ID:67042,9 pages
10.4236/fns.2016.77051
Kinetic Determination of Urea in Milk Powder by Nonlinear Chemical Fingerprint Technique
Yongjie Ma1*, Wenbin Dong1, Hongliang Bao2, Cheng Fan3, Yue Fang4, Shipeng Wang4
1College of Chemistry and Chemical Engineering, Shaanxi University of Science and Technology, Xi’an, China
2Mathematical and Sciences College, Louyang Normal University, Luoyang, China
3Institute of Product Quality Supervision and Inspection in Shaanxi Province, Xi’an, China
4College of Food and Biological Engineering, Shaanxi University of Science and Technology, Xi’an, China

Copyright © 2016 by authors and Scientific Research Publishing Inc.
This work is licensed under the Creative Commons Attribution International License (CC BY).
http://creativecommons.org/licenses/by/4.0/


Received 8 May 2016; accepted 29 May 2016; published 2 June 2016
ABSTRACT
To detect urea content in milk powder, a nonlinear chemical fingerprint technique was developed. In our study, Belousov-Zhabotinsky oscillatory chemical reaction (B-Z) was performed using milk powder and malonic acid as main dissipative substances. The same dosage of milk powder with or without artificially added urea was introduced to “H+ + Ce4+ +  + malonic acid” oscillating system, respectively, and nonlinear chemical fingerprints of different milk powder were thus obtained. The proposed method was based on a linear relationship between inductive time of nonlinear chemical fingerprints and urea content in milk powder, which held when urea content in milk powder was in the range of 0 - 40 mg/g. A detection limit of 7.8 × 10⁻³ mg/g was also obtained. Our results showed that the method could be used to certify urea content in milk powder without pretreatment of samples, which was more simple and economical compared with traditional methods.
Keywords:
Adulteration, Milk Powder, Urea, Nonlinear Chemical Fingerprint

1. Introduction
Milk and dairy products are popular nutritional foods suitable for people of all ages. With the fast development of dairy processing industry in recent years, safety of dairy products was challenged by illegal adulterants such as urea, starch, whey, dextrin and melamine. Urea is a natural ingredient of milk in the range of 18.00 - 40.00 mg/dL [1] - [3] , is one of the most important parameters in analysis of milk and dairy products, and its concentration indicates product quality. The permissible level of urea in milk should be less than 70.00 mg/dL, according to related literatures [4] - [6] . When urea content in milk excesses the permissible range, many health problems may be caused, which include ulcer, cancers, indigestion, acidity and malfunctions of kidney [7] . Since urea is rich in nitrogen and relatively cheap, it has been adulterated in milk by unscrupulous merchants to earn huge profits. Therefore, detection and quantification of urea is of vital importance in dairy processing industry, food processing technology and clinical analysis.
Up to now, several methods have been reported to be used in detecting urea in milk, which include enzymatic determinations [8] , diacetylmonoxime assay [9] , infrared spectrometric techniques [10] , flow injection analysis- enzyme urease method [11] and gas chromatography-mass spectrometry method [1] . The use of Chemspec 150 instrument for the detection of urea in milk also has been reported [12] . Additionally, numerous types of urea sensors have been widely studied based on potentiometric, conductimetric, thermometric and optical methods like urea electrochemical sensor [13] and potentiometric biosensor [14] . Most of these methods show high sensitivity and meet the requirements for detection of maximum amount of urea allowed in milk and other related products. Recently, a nonlinear chemical fingerprint method was reported to analyze traditional Chinese medicine, for example, Glycyrrhiza [15] . Meanwhile, there are no nonlinear chemical fingerprint reported in analysis of urea in milk and milk powder.
Kinetic-catalytic reaction is one of the most simple and rapid analytical methods [16] . The Belousov-Zhabo- tinsky oscillatory chemical reaction (Belousov and Zhabotinsky were the names of two Russian scientists, who were the first ones to study the reaction) is a well-studied typical nonlinear chemical reaction system, and the reaction mechanism has been explained by many scholars using different kinetic models. The most famous one is Field, Körös and Noyes model, namely FKN model [17] [18] , which is successfully used in explanation of B-Z oscillatory reaction. The reaction phenomena are complex, involving chemical oscillation, chemical turbulence, chemical patterns and chemical waves [19] . Furthermore, the reaction mechanism and applications of chemical oscillation in single component detection have been investigated extensively and thoroughly by domestic and foreign scholars [17] - [20] . However, there has been little progress in studies on application of nonlinear chemical reaction in authenticity identification and quality evaluation of milk and dairy products. According to literatures [15] [21] , a nonlinear chemical fingerprint is a kinetic fingerprint involving abundant qualitative and quantitative information that reflects kinetic information of entire nonlinear chemical reactions. In nonlinear chemical reactions, reactant species and concentrations in samples have great influences on nonlinear chemical fingerprint, which varies with component and concentration [21] . Therefore, nonlinear chemical fingerprint is applied to rapid identification and evaluation of milk powder. In this study, we introduced milk powder with or without artificially added urea to “H+ + Ce4+ +  + malonic acid” oscillating system and the corresponding nonlinear chemical fingerprint was obtained. Urea content in milk powder was calculated according to the linear relationship between inductive time of nonlinear chemical fingerprints and urea content. Furthermore, the method developed provides a more simple and economical way for adulteration detection of urea in milk powder, which avoids the time-consuming and laborious process of separation and purification of samples.
2. Materials and Methods
2.1. Reagents and Materials
All chemicals used were of analytical grade. Sulfuric acid (1.00mol/L), malonic acid (1.00 mol/L), ceric ammo- nium sulfate (0.05 mol/L), sodium bromate (0.80 mol/L) and sodium bromide (0.01 mol/L) were purchased from Tianjin TianLi Chemical Reagents Ltd. (Tianjin, China). Solutions were kept at a constant temperature (50.0˚C) until used. Double distilled water was used throughout the experiments. Trichloroacetic acid and hydrochloric acid were purchased from Xinxiang PuLi Chemical Reagents Ltd.(Henan, China). Urea was obtained from Ningbo Chemical Reagent (Ningbo, China). In this work, two brands of milk powder provided by the Institute of Product Quality Supervision and Inspection in Shaanxi Province (Xi’an, Shaanxi, China) were referred to as milk powder 1# and milk powder 2#, respectively.
2.2. Instrumentation
A nonlinear chemical fingerprint instrument (Model MZ-1B-2) developed by Central South University and Xiangtan Ltd. (Hunan, China) was used. A Type 217 calomel electrode was used as reference electrode and a Type 213 platinum electrode was used as working electrode (both were purchased from Shanghai Precision & Scientific Instrument Co., China). Electronic balance (Model BS 224S) and azotometer (KDY-9820) were purchased from Shanghai Precision & Scientific Instrument Co., China and Beijing Electromechanical Technology Research Institute (Beijing, China), respectively.
2.3. Preparation of Samples
Each sample was spiked with known amounts of urea (0 mg, 5 mg, 10 mg, 20 mg, 30 mg and 40 mg) to obtain a series of milk powder with different urea content. In addition, a sample of pure milk powder was prepared for experiments. The total dosage of each milk powder sample with or without artificially added urea was 1 g. Milk powder 1# was referred to as standard milk powder and its urea content was determined by GB 21704-2008 (National Standards of PR China) method. The following procedure was used in all experiments. The nonlinear chemical reaction mixture was prepared by mixing 25 mL of 1.00 mol/L sulfuric acid, 10 mL of 1.00 mol/L malonic acid, 12 mL of 0.05 mol/L ceric ammonium sulfate, 1 ml of 0.01 mol/L sodium bromide, 15 mL of double distilled water and 1g of milk powder sample with or without artificially added urea. All components of reaction mixture was added into the reactor. The reactor cover with two injection holes, the electrodes and a thermometer was closed. The instrument was then turned on, with temperature and stirring rate adjusting to 50.0˚C and 800 r/min, respectively. After stirring for 3 minutes, 5 mL of sodium bromate solution was injected into the reactor. Electric potential-time (E-t) curve was immediately obtained and finished as soon as the potential oscillation disappeared.
2.4. Data Analysis
Data was analyzed using Excel 2010, and all quantitative parameters of nonlinear chemical fingerprint were analyzed using MATLAB ver.8.5 (The Math-Works, USA).
3. Results and Discussion
3.1. Essential Information of Nonlinear Chemical Fingerprint of Milk Powder
Nonlinear chemical fingerprint contained abundant qualitative and quantitative information due to its dynamic property. In this study, nonlinear chemical fingerprint (Figure 1) was obtained by adding 1g of pure milk powder into the reactor, which obviously showed that the essential characteristic information of nonlinear chemical fingerprint mainly included undulatory period ( ), undulatory life (
 ), inductive time (
 ), canyon potential (
 ), canyon time (
 ), peak top potential (
 ), peak top time (
 ), oscillatory end potential (
 ), oscillatory start potential (
 ), maximum amplitude (
 ), oscillatory end time (
 ), which were reported
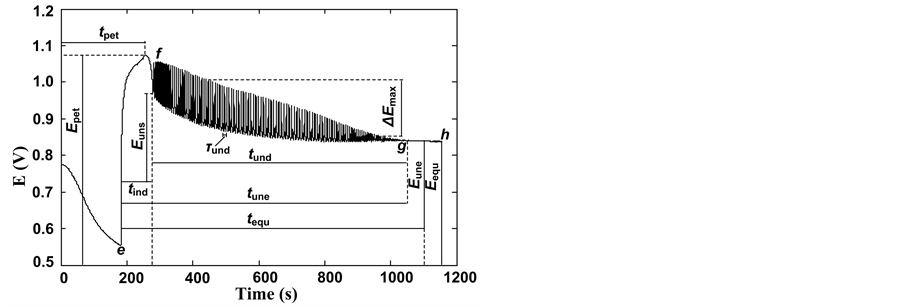
Figure 1. Basic characteristic information of nonlinear chemical fingerprint of milk powder. e-f: inductive curve; f-g: fluctuation curve; g-h: stop wave curve; e and h indicate the start and end points of reaction, respectively.
in details in other studies [22] . Oscillation wave shape of fingerprint reflects characteristics of complex samples, and quantitative information is of vital importance for distinguishing and evaluating milk powder. Therefore, inductive curve, oscillatory curve, oscillatory-end curve and a part of the equilibrium curve constituted the whole nonlinear chemical fingerprint [22] .
3.2. Basic Process of Nonlinear Chemical Fingerprint
Existing studies have reported kinetic and thermodynamic conditions of nonlinear chemical fingerprint, as well as entropy change laws and expression suitable for describing entropy change rates of any thermodynamic system [21] . It was demonstrated that an open system without complementarity of dissipative substances and a close system far from the equilibrium were suitable for studying nonlinear chemical fingerprint since the chemical reaction was able to be accomplished in a properly short period of time in these systems.
Process of a nonlinear chemical reaction is very complicated and involves oxidation-reduction reaction, precipitation reaction, neutralization reaction and free radical reaction [21] . Although B-Z oscillatory reaction includes complex kinetic steps like dozens of elementary reactions [23] , its mechanism can be summed into two main processes of inductive process and oscillatory process [23] . In this study, oscillatory process was explained by process A, B and C.
Process A:
 (1)
(1)
 (2)
(2)
 (3)
(3)
Process B:
 (4)
(4)
 (5)
(5)
 (6)
(6)
Process C:
 (7)
(7)
 (8)
(8)
 (9)
(9)
B-Z oscillating reaction is initiated by Br? [23] when the concentration of Br? in the reaction system is higher than [Br?]crit, namely, the critical concentration. In process A, Br? is consumed and Br2 is accumulated. With the reactions prolonging, the concentration of Br? gradually decreases [16] . When the concentration of Br? is lower than [Br?]crit, the whole oscillating reaction is dominated by process B, during which Ce4+ and HOBr are accumulated. HBrO2 is an important intermediate that operates the switch from process B to C. Accumulation of Br2, Ce4+ and HOBr initiates process C that regenerates Br?. Then the next new cycle will start as the concentration of Br? being accumulated. In this way, process A, B and C move in cycles and form the oscillating reaction.
According to process described above, nonlinear chemical reaction is highly sensitive to foreign substances such as variation of reactants and components in the medium. Effects of species and their concentrations in reaction system on quantitative information of nonlinear chemical reaction are influenced by many factors. Shape of nonlinear chemical fingerprint is changed with reaction condition, reactants, products and coexisting substances in reaction system. When pure milk powder is introduced to “H+ + Ce4+ +  + malonic acid” oscillating system, quantitative information including inductive time and undulatory period change with the amount of components in the reaction system. As shown in Table 1. Therefore, nonlinear chemical fingerprint of a sample is based on various degrees of all coexisting substances in the reaction system other than a single reaction substrate. This accounts for usage of adding a sample into reaction system to obtain its nonlinear chemical fingerprint. However, nonlinear chemical reaction mechanism is also affected by different chemical compositions and

Table 1. Effects of the dosages of reaction reagents in the reaction system on quantitative information of nonlinear chemical fingerprint of milk powder.
content in different samples, which may result in the change of entire nonlinear chemical reaction. Sample quality is thus analyzed and evaluated using the obtained different parameter information and shapes of nonlinear chemical fingerprint. In the cases of content of a single substance changing and the others remaining constant, quantitative parameter information (such as inductive time) of nonlinear chemical fingerprint changes indicate the variational substance content in reaction system.
3.3. Calibration Methods
The proposed method was used to determine urea content in milk powder. Samples of milk powder 1# were prepared and analyzed as described in the section of “Preparation of samples”. Effects of urea content on nonlinear chemical fingerprint of milk powder 1# were shown in Figure 2(a), which suggested a positive correlation between urea content and inductive time of nonlinear chemical fingerprint of the corresponding milk powder. Furthermore, different first peak time of each fingerprint resulted in different inductive time, which was shown in Figure 2(b) and Figure 2(c). A linear relationship between inductive time and urea content in milk powder 1# was thus obtained. The method also obtained linearity range for urea in spiked milk powder (0 - 40 mg/g). The p-value was 6.15 × 10⁻⁷, which is less than 0.0001, indicating that the curve fitting was highly significant. The fitted regression equation based on the least square method was given:
 (10)
(10)
Here  represents inductive time and C represents urea content in the corresponding milk powder 1#.
In our study, urea content in milk powder maintained in the range of 0 - 40 mg/g. This is because high urea content leads to deviation of effects on inductive time of nonlinear chemical fingerprint from the linear relationship in some cases. Quantitative analysis of urea content in different batches of the same brand of milk powder was determined by usage of the corresponding regression equation, which was firstly established by nonlinear chemical fingerprint and least square method and then used for calculation of urea content in milk powder. The established regression equation was only applied as a permanent calibration model for the same brand of milk powder. Since effects of other substances in milk powder on inductive time of nonlinear chemical fingerprint were included in the intercept of the linear regression equation, the interference experiment was then omitted. A limit of detection (LOD) based on the signal-to-noise ratio of 3 in response to blank sample was 7.8 × 10⁻³ mg/g. Our results showed that the proposed method meet the requirements for detection of urea content in milk powder.
3.4. Recovery of Urea in Milk Powder
In order to evaluate feasibility of the method in detecting urea added in milk powder, recovery was calculated with samples of milk powder 1# spiked with five different amounts of urea. The proposed method was validated using GB method and six repeated measurements of each sample were carried out. Urea content in milk powder 1# was calculated by Equation (10), and the result was presented in Table 2. The recovery was 95.41% - 100.75%, confirming that the method could be applied to detection of urea in milk powder and further indicating that it provided references for evaluation and detection of other components in milk and dairy products.
3.5. Reproducibility and Precision of Nonlinear Chemical Fingerprint of Milk Powder
Reproducibility of nonlinear chemical fingerprint was estimated by measuring the known content of urea in milk powder 1#. Eight groups of urea of different amounts were selected and repeated eight times each. The precision
 (a)
(a) (b) (c)
Figure 2. Effects of urea content on nonlinear chemical fingerprints of milk powder 1#. Urea content in milk powder 1# was 1 - 0 mg/g, 2 - 5 mg/g, 3 - 10 mg/g, 4 - 20 mg/g, 5 - 30 mg/g and 6 - 40 mg/g, respectively. The first peak for each fingerprint was indicated by a black arrow. (a): Integral graphics; (b) and (c): Corresponding local graphics.
Table 2. Results of the determination of urea in milk powder 1# (n = 6).
and reproducibility of the method were evaluated by relative standard deviation (RSD). As observed from Table 3, RSD of all samples was less than or equal to 2.66%, indicating a good reproducibility for different urea content in milk powder 1#. The results confirmed that the proposed method was of good reproducibility and precision.
3.6. Validation of Method
To further verify and investigate the feasibility and reliability of the proposed method, milk powder 2# was added with different amounts of urea. Different species and content of coexisting substances in different brands of milk powder might lead to differences of quantifiable parameters and nonlinear chemical fingerprint shapes. Thus, the regression equation might be different for different brands of milk powder. Effects of urea content on inductive time of nonlinear chemical fingerprint of milk powder 2# were shown in Figure 3. Urea content showed a linear relationship with inductive time of nonlinear chemical fingerprint in the range of 0 - 40 mg/g. The fitted regression equation based on the least square method was given:
 (11)
(11)
The obtained p-value of 1.37 × 10⁻⁶ was less than 0.0001, indicating that the curve fitting was significant. Urea content in milk powder 2# was calculated by Equation (11). The results provided evidences for the applica- tion of the method in analyzing urea content in different milk powder samples.
 (a) (b)
Figure 3. Effects of urea content on nonlinear chemical fingerprints of milk powder 2#. Urea content in milk powder 2# was 1 - 0 mg/g, 2 - 5 mg/g, 3 - 10 mg/g, 4 - 20 mg/g, 5 - 30 mg/g and 6 - 40 mg/g, respectively. The first peak for each fingerprint was indicated by a black arrow. (a): Integral graphics; (b): Corresponding local graphics.
Table 3. Reproducibility of nonlinear chemical fingerprint for urea in milk powder 1# (n = 8).
4. Conclusion
A nonlinear chemical fingerprint method was developed for detection of urea in milk powder. Nonlinear chemical fingerprint is a kinetic fingerprint based on potential change with time, which is determined by all components in milk powder. The proposed method provided a detection limit of 7.8 × 10⁻³ mg/g. The results further provided evidences for the application of nonlinear chemical fingerprint including massive qualitative and quantitative information in detection and quantification of urea in milk powder more economically and conveniently. In the study, nonlinear chemical fingerprint technique was proved to be valuable in detecting urea content in milk powder. In addition, the method omitted sample pretreatment, such as separation or purification and provided reference for studies on methods for determination of other components in milk and milk products.
Acknowledgements
Our research was supported by National Science & Technology Program the Twelfth Five-Year Plan Period in rural areas of China (Project No. 2012BAD12B07), Projects of Science and Technology Coordinating Innovative Engineering in Shaanxi Province of China (Project No. 2011KTCQ03-08), Special Fund of Shaanxi Provincial Education Department for Local Development (Project No. 15JF009) and Technology Transfer Demonstration Project of Science and Technology Bureau of in Xi’an of China (Project No. CXY1513 (7)).
Cite this paper
Yongjie Ma,Wenbin Dong,Hongliang Bao,Cheng Fan,Yue Fang,Shipeng Wang, (2016) Kinetic Determination of Urea in Milk Powder by Nonlinear Chemical Fingerprint Technique. Food and Nutrition Sciences,07,495-503. doi: 10.4236/fns.2016.77051
References
- 1. Dai, X., Fang, X., Su, F., Yang, M., Li, H., Zhou, J. and Xu, R. (2010) Accurate Analysis of Urea in Milk and Milk Powder by Isotope Dilution Gas Chromatography-Mass Spectrometry. Journal of Chromatography B, 878, 1634-1638.
http://dx.doi.org/10.1016/j.jchromb.2010.04.005 - 2. Hof, G., Vervoorn, M.D., Lenaers, P.J. and Tamminga, S. (1997) Milk Urea Nitrogen as a Tool to Monitor the Protein Nutrition of Dairy Cows. Journal of Dairy Science, 80, 3333-3340.
http://dx.doi.org/10.3168/jds.S0022-0302(97)76309-4 - 3. Naik, P.P., Mishra, G.K., Danielsson, B. and Bhand, S. (2015) Android Integrated Urea Biosensor for Public Health Awareness. Sensing and Bio-Sensing Research, 3, 12-17.
http://dx.doi.org/10.1016/j.sbsr.2014.11.001 - 4. Jonker, J.S., Kohn, R.A. and Erdman, R.A. (1998) Using Milk Urea Nitrogen to Predict Nitrogen Excretion and Utilization Efficiency in Lactating Dairy Cows. Journal of Dairy Science, 81, 2681-2692.
http://dx.doi.org/10.3168/jds.S0022-0302(98)75825-4 - 5. Mishra, G.K., Mishra, R.K. and Bhand, S. (2010) Flow Injection Analysis Biosensor for Urea analysis in Adulterated Milk Using Enzyme Thermistor. Biosensors and Bioelectronics, 26, 1560-1564.
http://dx.doi.org/10.1016/j.bios.2010.07.113 - 6. Sharma, R., Rajput, Y.S., Kaur, S. and Tomar, S.K. (2008) A Method for Estimation of Urea Using Ammonia Electrode and Its Applicability to Milk Samples. Journal of Dairy Research, 75, 466-470.
http://dx.doi.org/10.1017/S0022029908003488 - 7. Trivedi, U.B., Lakshminarayana, D., Kothari, I.L., Patel, N.G., Kapse, H.N., Makhija, K.K., Patel, P.B., et al. (2009) Potentiometric Biosensor for Urea Determination in Milk. Sensors and Actuators B: Chemical, 140, 260-266.
http://dx.doi.org/10.1016/j.snb.2009.04.022 - 8. Reis Lima, M.J., Fernandes, S.M.V. and Rangel, A.O.S.S. (2004) Enzymatic Determination of Urea in Milk by Sequential Injection with Spectrophotometric and Conductometric Detection. Journal of Agricultural and Food Chemistry, 52, 6887-6890.
http://dx.doi.org/10.1021/jf0488312 - 9. Kauffman, A.J. and St-Pierre, N.R. (2001) The Relationship of Milk Urea Nitrogen to Urine Nitrogen Excretion in Holstein and Jersey Cows. Journal of Dairy Science, 84, 2284-2294.
http://dx.doi.org/10.3168/jds.S0022-0302(01)74675-9 - 10. Stoop, W.M., Bovenhuis, H. and Van Arendonk, J.A.M. (2007) Genetic Parameters for Milk Urea Nitrogen in Relation to Milk Production Traits. Journal of Dairy Science, 90, 1981-1986.
http://dx.doi.org/10.3168/jds.2006-434 - 11. Mishra, G.K., Sharma, A., Deshpande, K. and Bhand, S. (2014) Flow Injection Analysis Biosensor for Urea Analysis in Urine Using Enzyme Thermistor. Applied Biochemistry and Biotechnology, 174, 998-1009.
http://dx.doi.org/10.1007/s12010-014-0985-0 - 12. Park, Y.K., Koo, H.C., Kim, S.H., Hwang, S.Y., Jung, W.K., Kim, J.M., Shin, S., Kim, R.T. and Park, Y.H. (2007) The Analysis of Milk Components and Pathogenic Bacteria Isolated from Bovine Raw Milk in Korea. Journal of Dairy Science, 90, 5405-5414.
http://dx.doi.org/10.3168/jds.2007-0282 - 13. Lian, H.T., Liu, B., Chen, Y.P. and Sun, X.Y. (2012) A Urea Electrochemical Sensor Based on Molecularly Imprinted Chitosan Film Doping with CdS Quantum Dots. Analytical Biochemistry, 426, 40-46.
http://dx.doi.org/10.1016/j.ab.2012.03.024 - 14. Ramesh, R., Puhazhendi, P., Kumar, J., Gowthaman, M.K., D’Souza, S.F. and Kamini, N.R. (2015) Potentiometric Biosensor for Determination of Urea in Milk Using Immobilized Arthrobacter creatinolyticus Urease. Materials Science and Engineering: C, 49, 786-792.
http://dx.doi.org/10.1016/j.msec.2015.01.048 - 15. Fang, X., Zhang, T., Zhao, Z., Xiang, F., Liang, Y., Wang, M., Zhang, R., Chen, S. and Qiao, J. (2010) Application of Nonlinear Chemical Fingerprinting to Identification, Evaluation and Clinical Use of Glycyrrhiza. Chinese Science Bulletin, 55, 2937-2944.
http://dx.doi.org/10.1007/s11434-010-3285-2 - 16. Gao, J., Wei, X., Yang, W., Lv, D., Qu, J., Chen, H. and Dai, H. (2007) Determination of 1-Naphthylamine by Using Oscillating Chemical Reaction. Journal of Hazardous Materials, 144, 67-72.
http://dx.doi.org/10.1016/j.jhazmat.2006.09.093 - 17. Field, R.T., Körös, E. and Noyes, R.M. (1972) Oscillation in Chemical System. II. Thorough Analysis of Temporal Oscillation in the Bromate-Cerium-Malonic Acid System. Journal of the American Chemical Society, 94, 8649-8664.
http://dx.doi.org/10.1021/ja00780a001 - 18. Field, R.J. and Schneider, F.W. (1989) Oscillating Chemical Reactions and Nonlinear Dynamics. Journal of Chemical Education, 66, 195.
http://dx.doi.org/10.1021/ed066p195 - 19. Wang, J., Yang, S., Cai, R., Lin, Z. and Liu, Z. (2005) A New Method for Determination of Uric Acid by the Lactic Acid-Acetone-BrO3--Mn2+-H2SO4 Oscillating Reaction Using the Analyte Pulse Perturbation Technique. Talanta, 65, 799-805.
http://dx.doi.org/10.1016/j.talanta.2004.08.008 - 20. Gan, N., Cai, R. and Lin, Z. (2002) Determination of Ascorbic Acid Based on a Peroxidase Oscillator Reaction. Analytica Chimica Acta, 466, 257-260.
http://dx.doi.org/10.1016/S0003-2670(02)00495-6 - 21. Zhang, T., Zhao, Z., Fang, X., Qiao, J., Xiang, F., Zhu, R., Liang, Y. and Ding, F. (2012) Determining Method, Conditional Factors, Traits and Applications of Nonlinear Chemical Fingerprint by Using Dissipative Components in Samples. Science China Chemistry, 55, 285-303.
http://dx.doi.org/10.1007/s11426-011-4384-x - 22. Zhou, J.F., Fang, X.Q., Zhang, T.M., Zhao, Z., Zhu, R., Xiang, F.Q. and Qiao, J.X. (2011) Quantitative Similarity Assessment of Non-Linear Chemical Fingerprint of Traditional Chinese Medicine by Similarity System Theory. Journal of Central South University Of Technology, 18, 343-352.
http://dx.doi.org/10.1007/s11771-011-0702-x - 23. Zhang, T., Zhao, Z., Fang, X., Qiao, J., Xiang, F., Zhu, R., Liang, Y. and Ding, F. (2012) Principle of Nonlinear Chemical Fingerprint by Using Dissipative Components in Samples as Well as Calculation and Evaluation of Similarity. Science China Chemistry, 55, 304-322.
http://dx.doi.org/10.1007/s11426-011-4385-9
NOTES

*Corresponding author.