Food and Nutrition Sciences
Vol.4 No.1(2013), Article ID:26453,5 pages DOI:10.4236/fns.2013.41001
Mass Modeling of Sweet Cherry (Prunus avium L.) Fruit with Some Physical Characteristics
![]()
Faculty of Agriculture, Lorestan University, Khoramabaad, Iran.
Email: *shahbazi.f@lu.ac.ir
Received October 22nd, 2012; revised November 22nd, 2012; accepted November 30th, 2012
Keywords: Sweet Cherry; Physical Characteristics; Mass Prediction
ABSTRACT
Horticultural crops with the similar weight and uniform shape are in high demand in terms of marketing value that used as food. The knowledge on existing relationship among the mass, length, width, thickness, volume and projected areas of fruits is useful for proper design of grading machines. A part of this research was aimed to present some physical properties of cherry fruit. In addition, in this study the mass of cherry fruit was predicted with using different physical characteristics in four models including: Linear, Quadratic, S-curve, and Power. According to the results, all properties considered in the current study were found to be statistically significant at the 1% probability level. The best and the worst models for mass prediction of cherry fruit were based on geometric mean diameter and thickness of the cherry with determination coefficients (R2) of 0.938 and 0.484, respectively. At last, mass model of cherry fruit based on first projected area from economical standpoint is recommended.
1. Introduction
The sweet cherry (Prunus avium L.) has become a more sought produce on internal and world markets. It can be consumed as fresh fruit and juice. According to FAO dates, the world sweet cherry production ranges between 1.3 - 1.5 million tones, in abundant years exceeds 1.6 million tons [1]. In Iran, the soil and climatic condition are ideal for cantaloupe production and it is cultivated on 25,700 ha with an annual production of about 218,584 tones [1,2].
Knowledge about physical properties of agricultural products and their relationships is necessary for the design of handling, sorting, processing and packaging systems. Among these properties, the dimensions, mass, volume and projected area are the most important ones in the design of grading system [3,4]. Consumers prefer fruits with equal weight and uniform shape. Mass grading of fruit can reduce packaging and transportation costs, and also may provide an optimum packaging configuration [5]. Fruits are often classified based on the size, mass, volume and projected areas. Electrical sizing mechanisms are more complex and expensive. Mechanical sizing mechanisms work slowly. Therefore it may be more economical to develop a machine, which grades fruits by their mass. Besides, using mass as the classification parameter is the most accurate method of automatic classification for more fruits. Therefore, the relationships between mass and length, width and projected areas can be useful and applicable [6-8]. A number of studies have been conducted on mass modeling of fruits based upon their physical properties. Tabatabaeefar et al. [9] found 11 models for the prediction of orange mass based upon dimensions, volume and surface areas. AlMaiman and Ahmad [10] studied the physical properties of pomegranate and found models of predicting fruit mass while employing dimensions, volume and surface areas. Tabatabaeefar and Rajabipour [11], determined a quadratic equation (M = 0.08c2 + 4.74c + 5.14, R2 = 0.89) to calculate apple mass based on its minor diameter. Lorestani and Tabatabaeefar [12] determined models for predicting mass of Iranian kiwi fruit by its dimensions, volumes, and projected areas. They reported that the intermediate diameter was more appropriate to estimate the mass of kiwi fruit. Also Khanali et al. [13] achieved models for tangerine. Some researchers modeled the mass of pomegranate fruit [14-16]. Lorestani and Ghari [17] concluded that the best model for prediction the mass of Fava bean among the dimensional models was linear based on width and the best model for prediction the mass of Fava bean was based on third projected area which perpendicular to L direction of Fava bean and it was Power form.
No detailed studies concerning mass modeling of sweet cherry fruit have yet been performed. The aims of this study were to determine the most suitable model for predicting cherry fruit mass by its physical attributes and study some physical properties of Iranian cherry fruit to form an important database for other investigators.
2. Materials and Methods
Fresh harvested cherry fruits in May 2012, of Siah Mshad cultivar obtained from Lorestan province Iran, were used in this study. In order to determine the physical properties, 150 cherry fruits were randomly selected. Selected samples were healthy and free from any injuries. Samples of fruits were weighed and dried in an oven at a temperature of 78˚C for 48 hours then weight loss on drying to a final constant weight was recorded as moisture content. Cherry fruit mass (M) was determined with an electronic balance with 0.01 g sensitivity. To determine the average size of the samples, three linear dimensions namely as length, width and thickness were measured by using a digital caliper with 0.01 mm sensitivity (Figure 1). Actual volume (Vm) was determined by the water displacement method [18]. The geometric mean diameter (Dg) and surface areas (S) were determined by using following equations [18], respectively:
 (1)
(1)
 (2)
(2)
where L is length (mm), W is width (mm) and T is thickness of cherry fruit (mm), S is surface area (mm2) and Dg is geometric mean diameter (mm). In addition, projected areas (PA1, PA2 and PA3) in three perpendicular directions of the fruit were measured by a  area-meter, MK2 model device with 0.1 cm2 accuracy and then criteria projected area (CPA) calculated as follows [18]:
 (3)
(3)
where PA1, PA2 and PA3 are first, second and third projected areas (mm2).
In order to estimate mass models of cherry fruits, the following models were considered:
1) Single variable regression of cherry fruit mass based on cherry fruit dimensional characteristics: length (L), width (W), thickness (T), and geometric mean diameter (Dg).
2) Single or multiple variable regressions of cherry fruit mass based on projected areas (PA1, PA2 and PA3), surface area (S) and criteria projected area (CPA).
3) Single regression of cherry mass based on measured volume (Vm), volume of the fruit assumed as oblate spheroid (Vosp) and ellipsoid shapes (Vellip).
In the case of the third classification, to achieve models which can predict the fig fruit mass on the basis of volume, three volume values were either measured or calculated. At first, measured volume (Vm) as stated earlier was measured and then the fig fruit shape was assumed as a regular geometric shape, i.e. oblate spheroid (Vosp) and ellipsoid (Vellip) shapes, and their volume was thus calculated as:
 (4)
(4)
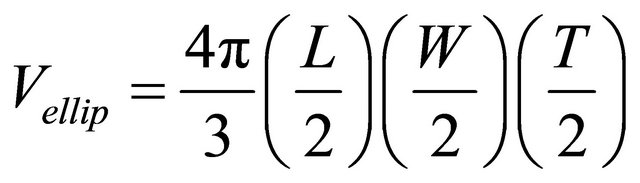 (5)
(5)
In all cases, the results which were obtained from experiments were fitted to Linear, Quadratic, S-curve, and Power models which are presented as following equations, respectively:
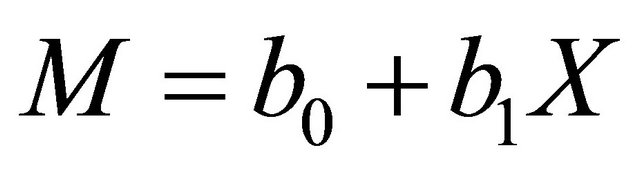 (6)
(6)
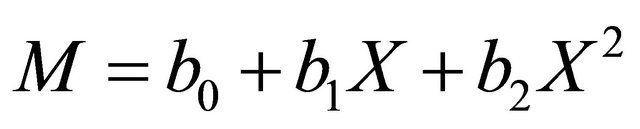 (7)
(7)
 (8)
(8)
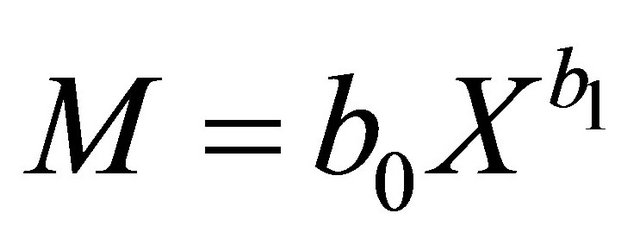 (9)
(9)
where M is mass (g), X is the value of a independent (physical characteristics) parameter which want to find its relationship with mass, and b0, b1, and b2 are curve fitting parameters which are different in each equation. One evaluation of the goodness of fit is the value of the coefficient of determination. For regression equations in general, the nearer R2 is to 1.00, the better the fit [19]. SPSS 15, software was used to analyze the data and determine regression models between the physical characteristics.
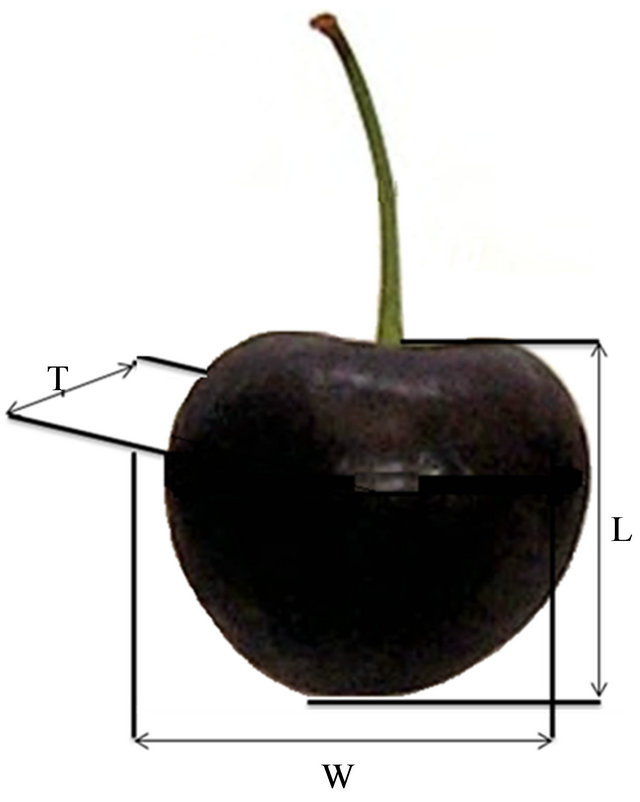
Figure 1. Dimensional characteristics of sweet cherry fruit: L, length; W, width; T, thickness.
3. Results
3.1. Physical Properties of Cherry Fruits
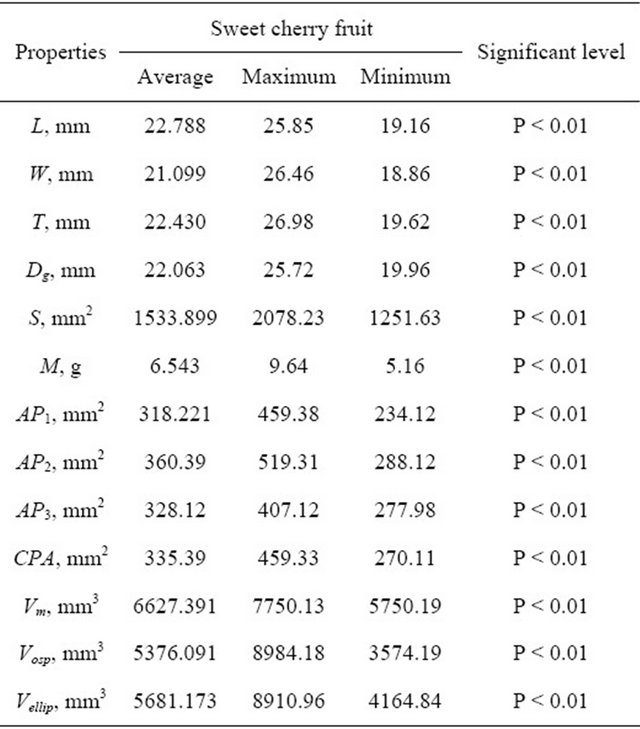
A summary of the physical properties of studied sweet cherry fruits is shown in Table 1. These properties were found at specific moisture contents about 80.13% wet basis. As seen in Table 1, all properties which were considered in the current study were found to be statistically significant at 1% probability level. According to the results, the mean values of properties which were studied in this research (length, width, thickness, geometric mean diameter, surface area, mass, first area, second, third area, criteria projected area, measured volume, oblate spheroid volume and ellipsoid shapes volume) were 22.788 mm, 21.099 mm, 22.430 mm, 22.063 mm, 1533.899 mm2, 6.543 g, 318.221 mm2, 360.390 mm2, 328.121 mm2, 335.39 mm2, 6627.391 mm3, 5376.091 mm3 and 5681.173 mm3, respectively.
3.2. Mass Modeling
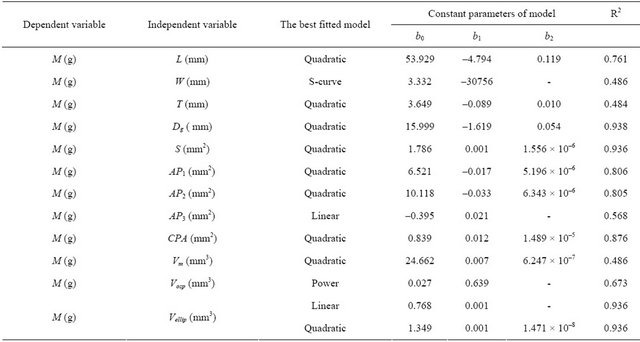
Mass models and their coefficient of determination (R2) that obtained from the data for sweet cherry fruits are shown in Table 2. All of the models coefficients were analyzed with F-test and t-test in SPSS 15 Software. The results showed that all of them were significant at 1% probability level.
3.2.1. Modeling Based on Dimensions
The results of mass modeling of sweet cherry fruit based on dimensional characteristics including length (L), width
Table 1. Some physical properties of sweet cherry fruit.
(W) thickness (T) and geometric mean diameter (Dg), showed that Quadratic model to calculate mass of cherry fruit based on geometric mean diameter, had the highest R2 among the others as:
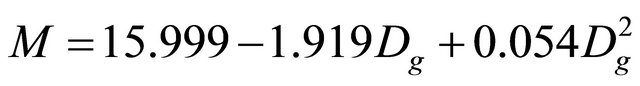 R2 = 0.938 (10)
However, measurement of three diameters of cherry fruit is needed for calculating the geometric mean diameter (Dg) to use this model, which makes the sizing mechanism more tedious and expensive. Among three dimensions including length (L), width (W) and thickness (T), Quadratic model which expresses the length (L) as independent variable had the highest R2 among the others (Table 2). Therefore, the mass model of sweet cherry fruit based on length is given as Quadratic form:
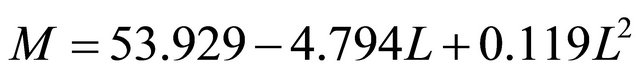 R2 = 0.761 (11)
Whereas, this model can predict the relationships between the mass with width (W) and thickness (T) with R2 values of 0.475 and 0.484, respectively. Therefore, sizing cherry fruit based on length is recommended. Tabatabaeefar et al. [9] suggested a nonlinear model for orange mass based on fruit width too. Their recommended model was with the following values: M = 0.069b2 − 2.95b − 39.15, R2 = 0.97. Eleven models for predicting mass of apples based on geometrical attributes were recommended by Tabatabaeefar and Rajabipour [11]. They recommended an equation for calculating apple mass on the basis of minor diameter as: M = 0.08c2 − 4.74c + 5.14, R2 = 0.89. Ghabel et al. [20] recommended a nonlinear model for onion mass determination based on length as: M = 0.035a2 – 1.64a + 36.137, R2 = 0.96.
3.2.2. Modeling Based on Areas
Among the investigated classification models based on projected areas (PA1, PA2, PA3 and CPA), Quadratic model of the criteria projected area (CPA), shown in Table 2, had the highest value of R2 as:
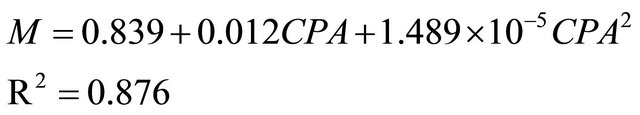 (12)
(12)
But, if this model was used for the classification of fruits in grading system, all three projected areas will be required for cherry fruit. Therefore, the costs of sorting and grading will be increased while the speed of system will be decreased. Then it is evident that one of projected areas must be selected. Among the PA1, PA2 and PA3 areas, Quadratic model of PA1 was preferred because of the highest value of R2 as:
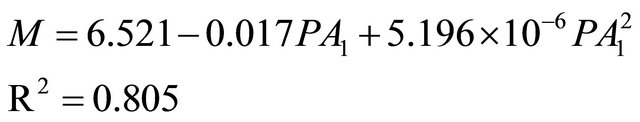 (13)
(13)
For prediction of the mass of the cherry fruit based on surface area the best model was Quadratic with R2 = 0.936:
Table 2. The best models for prediction the mass of sweet cherry fruit with some physical characteristics.
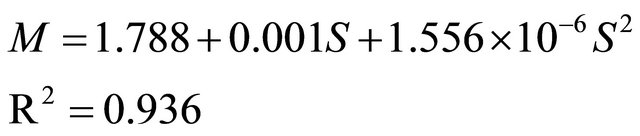 (14)
(14)
However, measurement of three defamations of cherry fruit is needed for calculating the geometric mean diameter (Dg) and then calculating surface areas (S) to use this model, which makes the sizing mechanism more tedious and expensive.
3.2.3. Modeling Based on Volumes
According to the results, for prediction of the mass of the cherry fruit based on volumes (Vm, Vosp and Vellip), shown in Table 2, Linear and Quadratic models based on volume of assumed ellipsoid shape (Vellip) with R2 = 0.936, were the best models as:
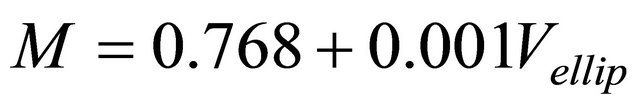 R2 = 0.936 (15)
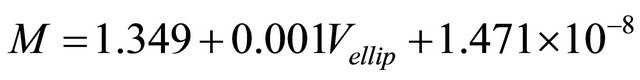 R2 = 0.936 (16)
According to the results obtained in this study, the Quadratic model could predict the relationships among the mass and some physical properties of cherry fruit with proper value for determination coefficient. So we suggest the Quadratic model based on first projected area (PA1) for prediction the mass of cherry fruit because we need one camera and it is applicable and economical method.
4. Conclusions
Some physical properties and their relationships of mass of cherry fruit are presented in this study. From this study it can be concluded that:
All properties considered in the current study were found to be statistically significant at the 1% probability level.
The best model for prediction the mass of cherry fruit based on the fruit dimensional characteristics was Quadratic form based on length of fruit as:
 , R2 = 0.761.
The best model for prediction the mass of cherry fruit was based on three projected areas was Quadratic form based on first projected area (AP1) which is perpendicular to L direction of cherry as:
 , R2 = 0.876.
Linear and Quadratic models based on volume of assumed ellipsoid shape (Vellip) with R2 = 0.936, were the best models for prediction of the mass of the cherry fruit based on volumes as:

 .
.
At last, from economical standpoint of view, mass model based on the first projected area is recommended to design and development of grading systems.
REFERENCES
- FAOSTAT, “FAO Statistics Data Base on the World Wide Web,” 2011. http://faostat.fao.org
- Ministry of Agriculture, “Statistical Yearbook,” Ministry of Agriculture, Tehran, 2006, pp. 14-20.
- M. A. Safwat, “Theoretical Prediction of Volume, Surface Area, and Center of Gravity for Agricultural Products,” Transactions of the ASAE, Vol. 14, 1971, pp. 549- 553.
- K. Peleg and Y. Ramraz, “Optimal Sizing of Citrus Fruit,” Transactions of the ASAE, Vol. 18, 1975, pp. 1035-1039.
- K. Peleg, “Produce Handling, Packaging and Distribution,” The AVI Publishing Company, Inc., Westport, 1985, pp. 20-90.
- F. Khoshnam, A. Tabatabaeefar, M. G. Varnamkhasti and A. Borghei, “Mass Modeling of Pomegranate (Punica granatum L.) Fruit with Some Physical Characteristics,” Scientia Horticulturae, Vol. 114, No. 1, 2007, pp. 21-26. doi:10.1016/j.scienta.2007.05.008
- R. Stroshine and D. Hamann, “Physical Properties of Agricultural Materials and Food Products,” Department of Agricultural and Biological Engineering, West Lafayette, 1995, pp. 30-89.
- J. P. Marvin, G. M. Hyde and R. P. Cavalieri, “Modeling Potato Tuber Mass with Tuber Dimensions,” Transactions of the ASAE, Vol. 30, No. 4, 1987, pp. 1154-1159.
- A. Tabatabaeefar, A. Vefagh-Nematolahee and A. Rajabipour, “Modeling of Orange Mass Based on Dimensions,” Journal of Agricultural Science and Technology, Vol, 2, No. 4, 2000, pp. 299-305.
- S. Al-Maiman and D. Ahmad, “Changes in Physical and Chemical Properties during Pomegranate (Punica granatum L.) Fruit Maturation,” Food Chemistry, Vol. 76, No. 4, 2002, pp. 437-441. doi:10.1016/S0308-8146(01)00301-6
- A. Tabatabaeefar and A. Rajabipour, “Modeling the Mass of Apples by Geometrical Attributes,” Scientia Horticulturae, Vol. 105, No. 3, 2005, pp. 373-382. doi:10.1016/j.scienta.2005.01.030
- A. N. Lorestani and A. Tabatabaeefar, “Modeling the Mass of Kiwi Fruit by Geometrical Attributes,” International Agrophysics, Vol. 20, No. 2, 2006, pp. 135-139.
- M. Khanali, M. G. Varnamkhasti, A. Tabatabaeefa and H. Mobli, “Mass and Volume Modelling of Tangerine (Citrus reticulate) Fruit with Some Physical Attributes,” International Agrophysics, Vol. 21, No. 4, 2007, pp. 329- 334.
- A. Kaya and N. Sozer, “Rheological Behaviour of Sour Pomegranate Juice Concentrates (Punica granatum L.),” International Journal of Food Science and Technology, Vol. 40, 2005, pp. 223-227. doi:10.1111/j.1365-2621.2004.00897.x
- A. Fadavi, M. Barzegar, M. H. Azizi and M. Bayat, “Physicochemical Composition of Ten Pomegranate Cultivars (Punica granatum L.) Grown in Iran,” Food Science and Technology, Vol. 11, No. 2, 2005, pp. 113-119. doi:10.1177/1082013205052765
- A. R. P. Kingsly, D. B. Singh, M. R. Manikantan and R. K. Jain, “Moisture Dependent Physical Properties of Dried Pomegranate Seeds (Anardana),” Journal of Food Engineering, Vol. 75, No. 4, 2006, pp. 492-496. doi:10.1016/j.jfoodeng.2005.04.033
- A. N. Lorestani and M. Ghari, “Mass Modeling of Fava Bean (Vicia faba L.) with Some Physical Characteristics,” Scientia Horticulturae, Vol. 133, No. 6, 2012, pp. 6-9. doi:10.1016/j.scienta.2011.10.007
- N. N. Mohsenin, “Physical Properties of Plant and Animal Materials,” Gordon and Breach Sci. Publications, New York, 1986, pp. 20-89.
- R. Stroshine, “Physical Properties of Agricultural Materials and Food Products,” Course Manual, Purdue University, West Lafayette, 1998, pp. 30-89.
- R. Ghabel, A. Rajabipour, M. Ghasemi-Varnamkhasti and M. Oveisi, “Modeling the Mass of Iranian Export Onion (Allium cepa L.) Varieties Using Some Physical Characteristics,” Research in Agricultural Engineering, Vol. 56, No. 21, 2010, pp. 33-40.
NOTES
*Corresponding author.