Food and Nutrition Sciences
Vol.5 No.14(2014), Article ID:48535,10 pages
DOI:10.4236/fns.2014.514141
Commercial Bakery, Fast-Food, and Soft Drink Consumption and Quality of Life in the SUN Project
Cristina Ruano1,2, Patricia Henríquez1,2, Miguel Ruiz-Canela2,3, Miguel Ángel Martínez-González2,3, Maira Bes-Rastrollo2,3, Almudena Sánchez-Villegas1,2,3
1Nutrition Research Group, Research Institute of Biomedical and Health Sciences, University of Las Palmas de Gran Canaria, Las Palmas de Gran Canaria, Spain
2CiberObn Physiopathology of Obesity and Nutrition, Institute of Health “Carlos III”, Madrid, Spain
3Department of Preventive Medicine and Public Health, University of Navarra, Pamplona, Spain
Email: cruano@proyinves.ulpgc.es
Copyright © 2014 by authors and Scientific Research Publishing Inc.
This work is licensed under the Creative Commons Attribution International License (CC BY).
http://creativecommons.org/licenses/by/4.0/


Received 16 May 2014; revised 24 June 2014; accepted 5 July 2014
ABSTRACT
Objective: Few studies have related nutritional factors with quality of life in healthy populations. Our aim was to analyze the relationship between commercial bakery, fast food or soft drinks consumption and mental and physical quality of life. Study Design: This analysis included 8335 participants from the "Seguimiento Universidad de Navarra" (SUN) Project (a multipurpose, dynamic cohort). Methods: The consumption of commercial bakery, fast food and soft drinks was assessed through a validated food-frequency questionnaire at baseline. Quality of life was measured after 4 years of follow-up with the Short-Form 36 (SF-36) Health Survey. Generalized Linear Models were fit to assess the regression coefficients (b) and their 95% confidence intervals (95% CI) for the association between commercial bakery, fast food and soft drinks consumption and each domain and the two standardized measures of the SF-36. Results: As compared to the participants in the lowest quintile of consumption, those participants in the highest quintile of consumption of commercial bakery, fast food and soft drinks showed a score significantly lower (>2 points) for vitality (b = −2.14, 95% CI = −3.31 to −0.96), role emotional (b = −2.23, 95% CI = −4.33 to −0.13), and role physical (b = −2.31, 95% IC = −4.26 to −0.36) domains with statistically significant dose-response relationships (p for trend < 0.05). When the food groups were analysed separately, significant inverse associations were found only for commercial bakery and fast-food consumption. Conclusions: The results suggest that high consumption of commercial bakery, fast-food and soft drinks at baseline was associated with worse scores on self-perceived quality of life. This association was stronger for the mental domains of the SF-36.
Keywords: Commercial Bakery, Fast-Food, Soft Drink, Dynamic Cohort, Epidemiology, Quality of Life

1. Introduction
Population ageing is increasing the worry for obtaining a better health-related quality of life (HRQOL). The concept of “well-being” or “quality of life” relates the ability to function well (both physically and mentally) and to have a positive mood state. Health-related quality of life is a multidimensional concept that refers to the physical, psychological and social domains of health [1] .
Epidemiological studies have shown the influence of different factors such as smoking, obesity or physical activity [2] -[5] , but few longitudinal studies have analyzed the influence of the diet on the quality of life of healthy populations [6] -[8] . Several studies have found that the adherence to a Mediterranean dietary pattern rich in fruits and vegetables, legumes, fish and olive oil, was associated with higher scoring for self-perceived health [9] [10] . On the other hand, the detrimental effects of a “Western-type” dietary pattern rich in processed and red meats, refined grains and commercial baked goods on cardiovascular risk and obesity are well known [11] -[13] . The Western dietary pattern is the common diet in Northern Europe and the USA. In recent years, however, southern European countries, which used to eat a traditional Mediterranean diet, have also been adopting a more Western-style diet [14] . Concomitant with this trend, prevalence rates of overweight and obesity have considerably increased in these countries [15] , as well as cardiovascular diseases, type 2 diabetes [16] and mental disorders like depression and anxiety [17] , becoming a public health concern. A previous study in our cohort reported a direct association between fast-food consumption and weight gain [18] and depression [19] , and recent studies have also found a detrimental effect of this dietary pattern on depressive symptoms [20] -[23] .
However, the particular effects on quality of life of some of these specific food groups, such us commercial bakery, fast foods and sugar-sweetened drinks are not well defined yet.
From a public health perspective, it is necessary to identify the factors that could increase the quality of life and health status of the population. The aim of the present study was to assess if the consumption of commercial bakery, fast food and soft drinks was associated with self-perceived health-related mental and physical quality of life in the “Seguimiento Universidad de Navarra” (SUN) Project.
2. Ease of Use Materials and Methods
2.1. Study Population
The “Seguimiento Universidad de Navarra” (SUN) Project is a dynamic cohort study including only university graduates initiated in December 1999 in Spain. Its methods have been previously described elsewhere [24] [25] .
Information on exposures and outcomes is gathered by postal mailed or web-based questionnaires collected biannually. Participants answer a baseline questionnaire assessing multiple exposures such as nutritional habits, physical exercise, medical conditions and other risk factors. Every two years they answer the follow-up questionnaires assessing changes in exposures and new events of interest.
Up to November 2010, 15,089 participants had responded to the baseline and to the 4-years follow-up questionnaire. As the recruitment is permanently open, with approximately 2000 new participants each year, only those entering the cohort before 2005 could be followed-up for 4 years. The overall retention rate is 92%. From those participants who were assessed after 4-year (15,094), we excluded those who reported extremely low or high values for total energy intake (less than 800 Kcal/day or more than 4000 Kcal/day in men and less than 500 Kcal or more than 3500 Kcal/day in women [26] ), those who reported diabetes, dyslipidemia and cardiovascular disease at baseline, and those without or with incorrect data regarding quality of life. Finally, 8335 participants were included in this analysis.
The study was approved by the Human Research Ethical Committee at the University of Navarra. Voluntary completion of the first questionnaire was considered to imply informed consent. Our Research Ethics Committee specifically approved this consent process.
2.2. Exposure Assessment
Dietary intake was assessed at baseline using a semi-quantitative food frequency questionnaire (136 food items) [27] . Validity and reproducibility of this questionnaire has been recently re-evaluated [28] . Nutrient intakes of these 136 food items were calculated as frequency multiplied by nutrient composition of specified portion size for each food item, using an ad hoc computer program specifically developed for this aim. A trained dietician updated the nutrient data bank using the latest available information included in the food composition table for Spain [29] [30] .
Baseline consumption of commercial bakery included muffins (1 serving/day = 45 g), doughnuts (1 serving/ day = 50 g), croissants and other commercial baked goods (1 serving/day = 50 g). The baseline consumption of hamburgers (1 serving/day = 100 g), sausages (1 serving/day = 50 g), pizza (1 serving/day = 200 g) and French fries (1 serving/day = 100 g) was summed-up to calculate total fast-food consumption. Baseline consumption of soft drinks (1 serving/day = 200 cc) included all sugar-sweetened beverages.
The baseline consumption (servings/day) of commercial bakery, fast-food and soft drinks was merged and jointly analysed after categorizing the quantitative variable into quintiles. Moreover, the consumption of each food groups (commercial bakery, fast food and soft drinks) was analyzed separately as a quantitative variable (servings per day).
Adjustments were made for total energy intake using the residual method proposed by Willet [31] .
2.3. Outcome Assessment
The Short-Form 36 (SF-36) is a general health scale widespread used and thoroughly validated [32] . Quality of life was assessed after 4-year follow-up with the validated Spanish version of the SF-36 Health Survey. The questionnaire contains 36 items which measure eight multi-item parameters of health status: physical functioning, role limitations due to physical health problems (role-physical), bodily pain, general health perceptions, vitality, social functioning, role limitations due to emotional problems (role emotional) and mental health. The first four domains deal with physical aspects, and the next four reflect psychological features. For each parameter, scores are coded, summed and transformed to a scale from 0 (the worst possible condition) to 100 (the best possible condition). For example, for bodily pain a score of 100 means a complete tolerance to pain.
Two standardized summary measures from the 8 dimensions: Physical Component Score (PCS) and Mental Component Score (MCS) were also calculated. The mean scores and standard deviations for these components are standardized performing linear transformation to transform scores to a mean of 50 and standard deviation of 10, in the general Spanish population [33] .
2.4. Covariate Assessment
The baseline assessment gathered information on socio-demographic variables (e.g., sex, age and marital status, employment status), anthropometric variables (e.g., weight and height), lifestyle and health-related habits (e.g., smoking status), and medical history (e.g., chronic diseases) [25] . Body Mass Index (BMI) was calculated as weight (in kilograms) divided by the square of height (in meters). Self-reported anthropometrics were previously been validated in a subsample of the cohort [34] .
Participants also completed a validated physical activity questionnaire at baseline that collects information about 17 activities [34] . Leisure-time activities were computed by assigning an activity metabolic equivalent (MET) score to each activity, multiplied by the time spent in each activity and summing up all activities [35] .
Information about alcohol intake was obtained through the semi-quantitative food frequency questionnaire included in the baseline questionnaire.
Adherence to the Mediterranean diet was assessed combining 9 items (fruits and nuts, vegetables, fish, legumes, cereals, meat and meat products, dairy and alcohol intake and the ratio MUFA/SFA). Finally we built a score with a range from 0 (no adherence at all) to 9 (maximum adherence) [36] .
2.5. Statistics
Generalized Linear Models were used to calculate the regression coefficients (b) and their 95% confidence intervals (95% CI) for the 8 domains of SF-36 Health Survey according to successive quintiles of the joint exposure of commercial bakery, fast-food, and soft drinks consumption. Tests of linear trend across successive quintiles were calculated assigning the medians to each quintile and treating this consumption as a continuous variable.
Multiple regression models were used to separately assess the relationship between commercial bakery, fastfood, and soft drinks consumption (serving per day) and each domain of the SF-36 Health Survey as well as the MCS and the PCS.
Age (years, continuous), sex, BMI at baseline (Kg/m2), total energy intake (Kcal/day, continuous), physical activity during leisure time (METS-h/week, continuous), smoking (never, ex-smokers and current smokers), marital status, unemployment status and the adherence to the Mediterranean diet score were considered as potential confounders in all the models.
The SPSS software package for Windows version 18.0 (SPSS Inc., Chicago, IL) was used for statistical analyses.
3. Results
The main characteristics of the participants according to quintiles of commercial bakery, fast food and soft drinks consumption are presented in Table1 Younger participants, men and single subjects were more likely to be in the highest level of consumption (Q5). Participants in Q5 were also less active compared to those in the lowest quintile (Q1). The percentage of current smokers was higher in Q5 than in Q1.
The median of consumption of fast-food in our cohort was 0.4 serving per day (range from 0 to 3.3 serv./day). For the commercial bakery consumption the median was 0.3 serving per day (range from 0 to 6.9 serv./day), in the case of soft drinks the median was 0.2 serving/day (range from 0 to 6.9 serv./day), and finally if we considered the three food groups together the median of consumption is 0.9 serving per day (range from 0 to 7.6 serv./day).
Table 2 shows the association between quintiles of baseline consumption of the sum of commercial bakery, fast-food, and soft drinks and the 8 domains of the SF-36. The multivariate-adjusted model revealed a statistically significant inverse association between the joint consumption of the three food items and most of the mental domains (vitality, social functioning and role emotional). For example: b = −2.14, 95% CI = −3.31 to −0.96 (Q5 vs. Q1) and b = −1.47, 95 CI% = −2.63 to −0.3 (Q4 vs. Q1) for the vitality domain. Moreover, except for social functioning, a significant dose-response relationship was found (p for trend < 0.05) for each of them. For the physical domains, an inverse association was found for role physical, b = −2.31 (95% CI = −4.26 to −0.36) (Q5 vs. Q1) with a statistically significant dose-response relationship (p for trend < 0.05).
Table 3 shows the multiple regression coefficients and their 95% CI for the association between commercial bakery consumption (serving per day), fast-food consumption (serving per day), and soft drinks consumption (serving per day) separately, and the 8 domains of the SF-36. A statistically significant inverse relationship was found for commercial bakery consumption and most of the mental domains (social functioning, role emotional and mental health) and the role physical domain. The role emotional domain showed the lowest regression coefficient, (b = −2.66, 95% CI = −4.21 to −1.10) per each additional serving. Thus, an increment of two servings/ day in the consumption of commercial bakery was associated to a decrease in 5.3 points (p < 0.001) in the role emotional score, which is considered clinically significant.
Also a statistically significant inverse relationship was found for fast-food consumption and the vitality domain (b = −1.35, 95% CI = −2.70 to −0.10). No statistically significant associations were found for soft drinks consumption and the mental or the physical domains.
Regression coefficients (b) and their 95% CI for the standardized measures: MCS and PCS of the SF-36 according to commercial bakery consumption (serving per day), fast-food consumption (serving per day), and soft drinks consumption (serving per day) separately are shown in Figure 1. The multivariate-adjusted model revealed a significant inverse association between commercial bakery consumption and the MCS, b = −0.92 (−1.41 to −0.44).
4. Discussion
The present study showed an inverse association between baseline consumption of the sum of commercial bakery, fast-food or soft drinks and the SF-36 domains, specially the mental ones, measured after 4 years of follow-up.
When each food group was separately analysed, commercial bakery consumption appeared to be more related with mental quality of life. Fast-food consumption was related to less vitality and soft drinks consumption seemed to have no statistical relationship with the SF-36 quality of life dimensions.
According to the results participants with higher consumption of the sum of these food items perceive themselves more tire and worn out, with social and role disability due to emotional problems and physical health problems, and with less vitality and energy than the participants with the lowest consumption. Although these are perceived health measures rather than biological measures, self-related heath status has been shown to be a powerful predictor of mortality at long term [37] .

Table 1. Baseline characteristics of participants according to quintiles of baseline joint consumption of commercial bakery, fast food and soft drinks.
*p value from χ2 test; †p value from student t test.
Table 2. Regression coefficients (b) and 95% Confidence Intervals (CI) for the association between quintiles of baseline joint consumption of commercial bakery, fast-food and soft drinks and the SF-36 health status questionnaire after 4 years of follow-up.
Adjusted for age (years continuous), sex, body mass index (Kg/m2), smoking status (non-smoker, current, ex-smoker and missing value), leisure-time physical activity (in quintiles of METs-h/wk score), total energy intake (Kcal/day), adherence to the Mediterranean diet score, marital status and unemployment status. Physical functioning: grade in which health problems can interfere with physical activities such as walking, self-care or weight lifting. Role physical: grade in which physical health problems can interfere with work activity or with other daily activities; Bodily pain: pain intensity and its effect on work inside and outside home; General health: personal belief regarding current health and future perspectives regarding health; Vitality: vitality and energy feelings against tiredness or exhaustion; Social functioning: grade in which mental health problems can interfere with habitual social life; Role emotional: grade in which mental health problems can interfere with work activity or with other daily activities; Mental health: general mental health including depression, anxiety, emotional and behaviour control and general positive effect.
There is a debate on how to define meaningful differences on the SF-36 scores in a clinical setting. Changes in 3-, 5-, and 10-points have been suggested as being clinically significant for clinical populations [38] . Given the characteristics of our cohort that did not include patients, but healthy and relatively young adults, the
Table 3 . Regression coefficients (b) and 95% Confidence Intervals (CI) for the association between baseline consumption of commercial bakery, fast food and soft drinks (per one additional serving/day) and the SF-36 domains after 4-y follow-up.
Adjusted for age (years continuous), sex, body mass index (Kg/m2), smoking status (non smoker, current, ex-smoker and missing value), leisure-time physical activity (in quintiles of METs-h/wk score), total energy intake (Kcal/day), adherence to the Mediterranean diet score, marital status, unemployment status, and additionally fast-food and soft drinks consumption (commercial bakery consumption model) or soft drinks and commercial bakery consumption (fast-food model) or commercial bakery and fast-food consumption (soft drinks model).
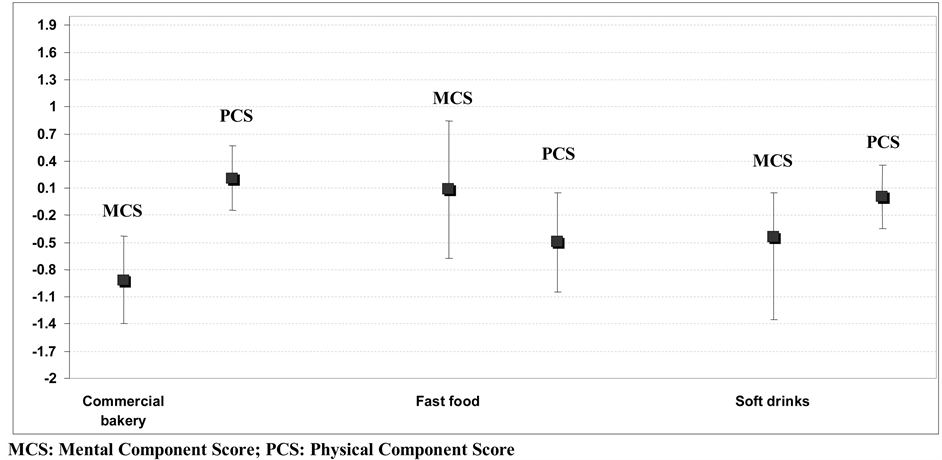
Figure 1. Regression coefficients (b) and 95% confidence intervals (CI) for the association between baseline consumption of commercial bakery, fast-food and soft drinks (per one additional serving/day) and the SF-36 mental (SF36 MCS) and physical (SF36 PCS) component score after 4-y follow-up. Adjusted for age (years continuous), sex, body mass index (Kg/m2), smoking status (non smoker, current, ex-smoker and missing value), leisure-time physical activity (in quintiles of METs-h/wk score), total energy intake (Kcal/day), adherence to the Mediterranean diet score, marital status, unemployment status, and additionally fast-food and soft drinks consumption (commercial bakery consumption model) or soft drinks and commercial bakery consumption (fast-food model) or commercial bakery and fast-food consumption (soft drinks model).
practical significance of these differences could be even higher. Although few studies have examined this issue directly, several investigators have raised the question of whether individuals with more severe impairments in HRQOL require a greater change to be considered meaningful than those with less severe impairments [39] .
Commercial bakery, fast food, and soft drinks are the most extreme example of what has become the typical Western dietary pattern, a food pattern described in several large American cohort studies [11] . Epidemiological studies have reported a detrimental effect of the consumption of these kinds of products on weight gain, obesity and insulin resistance [40] [41] . Moreover, the Western pattern has been also associated with the risk of Cardio Vascular Disease (CVD), endothelial dysfunction and higher level of pro-inflammatory cytokines [42] [43] . The high content of fats, especially Transunsaturated Fatty Acids (TFA), and refined sugars usually present in these products are probably the responsible agents for the reported associations [44] .
On the other hand, commercial bakery products are usually rich in carbohydrates with a high glycemic index (GI). Few epidemiological studies have addressed the long-term health impact of high-sugar foods, but diets with low glycemic load have been associated with a decreased risk of coronary heart disease [45] , lower level of pro-inflammatory cytokines and a better lipid profile [46] .
With regard to mental quality of life, several studies have associated the adherence diet high in fats and refined sugars and the specific consumption of these food items to the risk of depression and anxiety or the presence of mental symptoms [21] [23] . A possible explanation for this finding is that the consumption of high-fat, refined sugars foods could decrease the levels of the Brain-Derived Neurotrophic Factor (BDNF) within a short period of time as some animal studies have shown [47] . In fact, the Western dietary pattern is able to increase the production of pro-inflammatory cytokines that inhibit the production of this neurothophin. BDNF is a crucial mediator of neuronal vitality and function [48] . Therefore, it is likely that a dietary pattern rich in commercial bakery, sugary beverages and fast-food could increase the vulnerability to some mental or neurological disorders or act negatively on mental quality of life.
Although these physiological mechanisms could explain the reported results, our findings are modest. The relative low consumption of commercial bakery, fast-food or soft drinks in our cohort and the small degree of variability in the assessed exposure could explain the low to moderate magnitude of the reported associations. In fact, participants in the highest quintile of total consumption of fast-food, soft drinks and commercial bakery showed a frequency of consumption lower than 2 servings per day. Paradoxically and in contrast with the last data reported from the European Union regarding commercial bakery and fast food consumption [14] [49] , the consumption of commercial bakery, fast food and soft drinks was very low in our cohort. Therefore, the impact of these findings might be really important in other populations such as the American in which commercial bakery, fast-food, and soft drink consumption is far higher comparing to our population.
Several limitations in our study have to be addressed. Although diet was ascertained at baseline and quality of life after 4-years of follow-up, we acknowledge that baseline scores in quality of life were unknown. Consequently, in spite of the fact that the follow-up of participants allows a sufficient long induction period, it could still be possible to speculate that a poor-quality in diet may be a result of mental health symptoms, rather than a causal factor.
Our indicator for fast-food consumption was the sum of 4 food items (hamburgers, pizza, sausages and French fries). We used this sum as a proxy variable to quantify exposure to fast food consumption. We acknowledge this limitation of our assessment, and it could be possible that the hamburgers, pizza, sausages and French fries consumed at home may have a healthier composition than the same food items consumed in cafeterias, snack-bars, or fast-food restaurants. This fact may have hindered our ability to find stronger associations. Moreover, other foods not included in this group labelled fast-food could have been omitted.
Another concern might be that the association reported could be due to a not controlled residual confounding because of an unhealthier overall lifestyle among those participants with a higher consumption of commercial bakery, fast-food and soft drinks. However, adjustment for several proxies of a healthy life-style (smoking status, physical activity and adherence to the Mediterranean dietary score) did not substantially change the observations for the crude associations. Therefore, we do not consider residual confounding as the most likely explanation of our results.
Also, it is generally accepted that socio-economic status influences dietary habits as well as human health. We acknowledge that we have no data of variability in income among the participants of the cohort. However, the participants in our cohort were restricted to university graduates (responsible, highly motivated, and many of them former students of a private university). So, we considered that the sample is homogeneous regarding socio-economic status (medium-high). Moreover, restriction is an excellent technique for preventing or at least reducing confounding by known factors, and it is recommended by methodologists because restriction is usually more effective than multivariable adjustment to control for potential confounding [50] .
On the other hand, quality of life is a complex concept with various dimensions. Nevertheless, the use of the SF-36 questionnaire for evaluating the physical and mental dimensions of quality of life is generally accepted, and its validity and reliability have been demonstrated in many population-based studies [32] .
Some strengths of our study also deserve to be mentioned. They include its large sample size, its long-term follow-up, the multiple adjustments of our estimates for a variety of major potential confounders, the existence of published validation studies of our assessments, and the restriction to highly educated participants, which provides a better validity to the self-reported data.
5. Conclusion
In conclusion, our results suggest an inverse relationship between high consumptions of commercial bakery, fast-food and soft drinks and several quality of life domains. This association was stronger for the mental domains than for the physical domains of the SF-36 with commercial bakery being the most important contributor to the reported associations. Nevertheless, replication of these findings in longitudinal studies, including also a baseline determination on quality of life scores is required in order to confirm the reported associations and their direction.
Acknowledgements
We are indebted to the participants of the SUN Study for their continued cooperation and participation. We thank to other members of the SUN Group: Alonso A, Basterra-Gortari FJ, Benito S, Beunza JJ, Delgado-Rodriguez M, De Irala J, De la Fuente C, Guillen-Grima F, Krafka J, Llorca J, Lopez del Burgo C, Marti A, Martinez JA, Nuñez-Cordoba JM, Pimenta AM, Sanchez D, Segui-Gomez M, Serrano-Martínez M, and Vazquez Z.
References
- Testa, M.A. and Simonson, D.C. (1996) Assessment of Quality of Life Outcomes. New England Journal of Medicine, 334, 835-840. http://dx.doi.org/10.1056/NEJM199603283341306
- Gutierrez-Bedmar, M., Seguí-Gomez, M., Gomez-Gracia, E., Bes-Rastrollo, M. and Martinez-Gonzalez, M.A. (2009) Smoking Status, Changes in Smoking Status and Health-Related Quality of Life: Findings from the SUN (Seguimiento Universidad de Navarra) Cohort. International Journal of Environmental Research and Public Health, 6, 310-320.http://dx.doi.org/10.3390/ijerph6010310
- Serrano-Aguilar, P., Muñoz-Navarro, S.R., Ramallo-Fariña, Y. and Trujillo-Martin, M.M. (2009) Obesity and Health Related Quality of Life in the General Adult Population of the Canary Islands. Quality of Life Research, 18, 171-177.http://dx.doi.org/10.1007/s11136-008-9427-1
- Corica, F., Corsonello, A. and Apolone, G. (2008) Metabolic Syndrome, Psychological Status and Quality of Life in Obesity: The QUOVADIS Study. International Journal of Obesity, 32,185-191. http://dx.doi.org/10.1038/sj.ijo.0803687
- Sanchez-Villegas, A., Ara, I., Dierssen, T., De la Fuente, C., Ruano, C. and Martínez-González, M.A. (2001) Physical Activity during Leisure Time and Quality of Life in the SUN Project. British Journal of Sports Medicine, 46, 443-448.http://dx.doi.org/10.1136/bjsm.2010.081836
- Hislop, T.G., Bajdik, C.D., Balneaves, L.G., Holmes, A., Chan, S., Wu, E., Abanto, Z.U. and Butler, A.L. (2006) Physical and Emotional Health Effects and Social Consequences after Participation in a Low-Fat, High-Carbohydrate Dietary Trial for More than 5 Years. Journal of Clinical Oncology, 24, 2311-2317.http://dx.doi.org/10.1200/JCO.2005.04.3042
- Plaisted, C.S., Lin, P.H., Ard, J.D., McClure, M.L. and Svetkey, L.P. (2006) The Effects of Dietary Patterns on Quality of Life: A Substudy of the Dietary Approaches to Stop Hypertension Trial. Journal of the American Dietetic Association, 99, 84-89. http://dx.doi.org/10.1016/S0002-8223(99)00421-6
- Pisinger, C., Toft, U., Aadahl, M., Glümer, C. and Jorgensen, T. (2009) The Relationship between Lifestyle and Self-Reported Health in a General Population: The Inter99 Study. Preventive Medicine, 49, 418-423.http://dx.doi.org/10.1016/j.ypmed.2009.08.011
- Sofi, F., Cesari, F., Abbate, R., Gensini, G.F. and Casini, A. (2008) Adherence to Mediterranean Diet and Health Status: Meta-Analysis. BMJ, 337, a1344. http://dx.doi.org/10.1136/bmj.a1344
- Muñóz, M.A., Fíto, M., Marrugat, J., Covas, M.I. and Schröeder, H. (2009) Adherence to the Mediterranean Diet Is Associated with Better Mental and Physical Health. British Journal of Nutrition, 101, 1821-1827. http://dx.doi.org/10.1017/S0007114508143598
- Heidemann, C., Schulze, M.B., Franco, O.H., Van Dam, R.M., Mantzoros, C.S. and Hu, F.B. (2008) Dietary Patterns and Risk of Mortality from Cardiovascular Disease, Cancer, and All Causes in a Prospective Cohort of Women. Circulation, 118, 230-237. http://dx.doi.org/10.1161/CIRCULATIONAHA.108.771881
- Fung, T.T., Rimm, E.B., Spiegelman, D., Rifai, N., Tofler, G.H., Willet, W.C. and Hu, F.B. (2001) Association between Dietary Patterns and Plasma Biomarkers of Obesity and Cardiovascular Disease Risk. American Journal of Clinical Nutrition, 73, 61-67.
- Hu, F.B., Rimm, E.B., Stampfer, M.J., Ascherio, A., Spiegelman, D. and Willet, W.C. (2000) Prospective Study of Major Dietary Patterns and Risk of Coronary Heart Disease in Men. American Journal of Clinical Nutrition, 72, 912-921.
- Garcia-Closas, R., Berenguer, A. and González, C.A. (2006) Changes in Food Supply in Mediterranean Countries from 1961 to 2001. Public Health Nutrition, 9, 53-60. http://dx.doi.org/10.1079/PHN2005757
- Seidell, J.C. (2005) Epidemiology of Obesity. Seminars in Vascular Medicine, 5, 3-14. http://dx.doi.org/10.1055/s-2005-871737
- World Health Organization (WHO) (2003) Diet, Nutrition and the Prevention of Chronic Disease. Report of a World Health Organization/FAO Expert Consultation, Geneva.
- World Health Organization (WHO) (2008) The Global Burden of Disease 2004 Update. WHO, Geneva.
- Bes-Rastrollo, M., Sánchez-Villegas, A., Gómez-Gracia, E., Martínez, J.A., Pajares, R.M. and Martínez-González, M.A. (2006) Predictors of Weight Gain in a Mediterranean Cohort: The Seguimiento Universidad de Navarra Study. American Journal of Clinical Nutrition, 83, 362-370.
- Sánchez-Villegas, A., Toledo, E., De Irala, J., Ruiz-Canela, M., Pla-Vidal, J. and Martínez-González, M.A. (2012) Fast-Food and Commercial Bebed Goods Consumption and the Risk of Depression. Public Health Nutrition, 15, 424-432.
- Jacka, F.N., Pasco, J.A., Mykletun, A., Williams, L.J., Hodge, A.M., O’Reilly, S.L., Nicholson, G.C., Kotowicz, M.A. and Berk, M. (2010) Association of Western and Traditional Diets with Depression and Anxiety in Women. American Journal of Psychiatry, 167, 305-311. http://dx.doi.org/10.1176/appi.ajp.2009.09060881
- Akbaraly, T.N., Brunner, E.J., Ferrie, J.E., Marmot, M.G., Kivimaki, M. and Singh-Manoux, A. (2009) Dietary Pattern and Depressive Symptoms in Middle Age. British Journal of Psychiatry, 195, 408-413. http://dx.doi.org/10.1192/bjp.bp.108.058925
- Jeffery, R.W., Linde, J.A., Simon, G.E., Ludman, E.J., Rohde, P., Ichikawa, L.E. and Finch, E.A. (2009) Reported Food Choices in Older Women in Relation to Body Mass Index and Depressive Symptoms. Appetite, 52, 238-240. http://dx.doi.org/10.1016/j.appet.2008.08.008
- Ernersson, A., Hollman, G., Sepa-Frostell, A., Nyström, F. and Lindström, T. (2010) An Obesity Provoking Behaviour Negatively Influences Young Normal Weight Subjects Health Related Quality of Life and Causes Depressive Symptoms. Eating Behaviors, 11, 247-252. http://dx.doi.org/10.1016/j.eatbeh.2010.05.005
- Martinez-Gonzalez, M.A., Sanchez-Villegas, A., De Irala, J., Marti, A. and Martínez, J.A. (2002) Mediterranean Diet and Stroke: Objectives and Design of the SUN Project. Seguimiento Universidad de Navarra. Nutritional Neuroscience, 5, 65-73. http://dx.doi.org/10.1080/10284150290007047
- Segui-Gomez, M., De la Fuente, C., Vazquez, Z., De Irala, J. and Martínez-González, M.A. (2006) Cohort Profile: The “Seguimiento Universidad de Navarra” (SUN) Study. International Journal of Epidemiology, 35, 1417-1422. http://dx.doi.org/10.1093/ije/dyl223
- Willet, W.C. (1998) Issues in Analysis and Presentation of Dietary Data. Nutritional Epidemiology. 2nd Edition, Oxford University Press, New York.
- Martin-Moreno, J.M., Boyle, P., Gorgojo, L., Maisonneuve, P., Fernadez-Rodiguez, J.C., Salvini, S. and Willet, W.C. (1993) Development and Validation of a Food Frequency Questionnaire in Spain. International Journal of Epidemiology, 22, 512-519. http://dx.doi.org/10.1093/ije/22.3.512
- De la Fuente-Arrillaga, C., Vázquez, Z., Bes-Rastrollo, M., Sampson, L. and Martínez-Gonzalez, M.A. (2010) Reproducibility of a Food Frequency Questionnaire (FFQ) Validated in Spain. Public Health Nutrition, 131, 364-372.
- Mataix Verdú, J. (2003) Tabla de composición de alimentos españoles (Food Composition Tables). 4th Edition, Universidad de Granada, Granada. (in Spanish)
- Moreiras, O., Carbajal, A. and Cabrera, L. (2005) Tablas de composición de alimentos [Food Composition Tables]. 9th Edition, Pirámide, Madrid. (in Spanish)
- Willet, W.C., Howe, G.R. and Kushi, L.H. (1997) Adjustment for Total Energy Intake in Epidemiologic Studies. American Journal of Clinical Nutrition, 65, 1220-1221.
- Ware, J.E. and Gandek, B. (1998) Overview of the SF-36 Health Survey and the International Quality of Life Assessment (IQOLA) Project. Journal of Clinical Epidemiology, 51, 903-912. http://dx.doi.org/10.1016/S0895-4356(98)00081-X
- Vilagut, G., Valderas, J.M., Ferrer, M., Garin, O., LópezGarcía, E. and Alonso, J. (2008) Interpretación de los cuestionarios de salud SF-36 y SF-12 en España: Componentes físico y mental. Medicina Clínica, 130, 726-735. http://dx.doi.org/10.1157/13121076
- Martinez-Gonzalez, M.A., López-Fontana, C., Varo, J.J., Sanchez-Villegas, A. and Martínez, J.A. (2005) Validation of the Spanish Version of the Physical Activity Questionnaire Used in the Nurses’ Health Study and the Health Professionals’ Follow-Up Study. Public Health Nutrition, 8, 920-927. http://dx.doi.org/10.1079/PHN2005745
- Bes-Rastrollo, M., Perez Valdivieso, J.R., Sanchez-Villegas, A., Alonso, A. and Martinez-Gonzalez, M.A. (2005) Validación del peso e índice de masa corporal auto-declarados de los participantes de una cohorte de graduados universitarios. Revista Española de Obesidad, 3, 183-189.
- Trichopoulou, A., Costacou, T., Bamia, C. and Trichopoulos, D. (2003) Adherence to a Mediterranean Diet and Survival in a Greek Population. New England Journal of Medicine, 348, 2599-2608. http://dx.doi.org/10.1056/NEJMoa025039
- Wannamethee, G. and Shapher, A.G. (1991) Self-Assessment of Health Status and Morbidity and Mortality in Middle-Aged British Men. International Journal of Epidemiology, 2, 239-245. http://dx.doi.org/10.1093/ije/20.1.239
- Samsa, G., Edelman, D., Rothman, M.L., Williams, G.R., Lipscomb, J. and Matchar, D. (1999) Determining Clinically Important Differences in Health Status Measures: A General Approach with Illustration to the Health Utilities Index Mark II. PharmacoEconomics, 15, 141-155.
- Crosby, R.D., Kolotkin, R.L. and Williams, G.R. (2003) Defining Clinically Meaningful Change in Health-Related Quality of Life. Journal of Clinical Epidemiology, 56, 395-407. http://dx.doi.org/10.1016/S0895-4356(03)00044-1
- Isganaitis, E. and Lustig, R.H. (2005) Fast Food, Central Nervous System, Insulin Resistance, and Obesity. Arteriosclerosis, Thrombosis, and Vascular Biology, 25, 2451-2462. http://dx.doi.org/10.1161/01.ATV.0000186208.06964.91
- Pereira, M.A., Kartashov, A.I., Ebbeling, C.B., Van Horn, L., Slattery, M.L., Jacobs, D.R. and Ludwig, D.S. (2005) Fast-Food Habits, Weight Gain and Insulin Resistance (the CARDIA Study): 15-Year Prospective Analysis. Lancet, 365, 36-42. http://dx.doi.org/10.1016/S0140-6736(04)17663-0
- Lopez-García, E., Sculze, M.B., Fung, T.T., Meigs, J.B., Rifai, N., Manson, J.E. and Hu, F.B. (2004) Major Dietary Patterns Are Related to Plasma Concentrations of Markers of Inflammation and Endothelial Dysfunction. American Journal of Clinical Nutrition, 80, 1029-1035.
- Hu, F.B., Rimm, E., Smith-Warner, S.A., Feskanich, D., Stampfer, M.J., Ascherio, A., Sampson, L. and Willet, W.C. (1999) Reproducibility and Validity of Dietary Patterns Assessed with a Food Frequency Questionnaire. American Journal of Clinical Nutrition, 69, 243-249.
- Fernández-San Juan, P.M. (2009) Trans Fatty Acids (tFA): Sources and Intake Levels, Biological Effects and Content in Commercial Spanish Food. Nutrición Hospitalaria, 24, 515-520.
- Barclay, A.W., Petocz, P., McMillan-Price, J., Flood, V.M., Prvan, T., Mitchell, P. and Brand-Miller, J.C. (2008) Glycemic Index, Glycemic Load, and Chronic Disease Risk—A Meta-Analysis of Observational Studies. American Journal of Clinical Nutrition, 87, 627-637.
- Levitan, E.B., Cook, N.R., Stampfer, M.J., Ridker, P.M., Rexrode, K.M., Buring, J.E., Manson, J.E. and Liu, S. (2008) Dietary Glycemic Index, Dietary Glycemic Load, Blood Lipids, and C-Reactive Protein. Metabolism-Clinical and Experimental, 57, 437-443. http://dx.doi.org/10.1016/j.metabol.2007.11.002
- Molteni, R., Barnard, R.J., Ying, Z., Roberts, C.K. and Gomez-Pinilla, F. (2002) A High-Fat, Refined Sugar Diet Reduces Hippocampal Brain-Derived Neurotrophic Factor, Neuronal Plasticity, and Learning. Neuroscience, 112, 803-814. http://dx.doi.org/10.1016/S0306-4522(02)00123-9
- Castrén, E., Berninger, B., Leingärtnerand, A. and Lindholm, D. (1998) Regulation of Brain-Derived Neurotrophic Factor Levels in Hippocampus by Neuronal Activity. Progress in Brain Research, 117, 57-64. http://dx.doi.org/10.1016/S0079-6123(08)64007-8
- Euromonitor International (2009) Global Consumer Foodservice: Fast Casual Dining Set for Global Expansion.
- Rothman, K.J., Greenland, S. and Lash, T.L. (2008) Modern Epidemiology. 3rd Edition, Lippincott Williams, Philadelphia.