Food and Nutrition Sciences
Vol. 3 No. 9 (2012) , Article ID: 22293 , 4 pages DOI:10.4236/fns.2012.39156
A Comparative Study of the Fatty Acid Composition of Dairy Products and Margarines with Reduced or Substituted Fat Content
![]()
Chemistry and Toxicology Research Unit, Finnish Food Safety Authority Evira, Helsinki, Finland.
Email: tiina.ritvanen@evira.fi
Received July 5th, 2012; revised August 5th, 2012; accepted August 12th, 2012
Keywords: Cream; Fatty Acid Profile; Margarine; Reduced-Fat Cheese; Shortening; Trans Fatty Acid; Vegetable Fat
ABSTRACT
The objective of this study was to survey the fatty acid profiles of fat spreads, margarines, shortenings, vegetable fat ice creams, vegetable fat milk-based cream substitutes, vegetable fat cheese substitutes, and reduced-fat cheeses on the Finnish market. The evaluation of the nutritional quality of fat in these products is of significance to dieticians and to the development of fat products with enhanced nutritional value. Remarkable differences between fatty acid profiles of vegetable fat products were found. Vegetable fat ice creams may have a lot of saturated fat and, in addition, the proportion of polyunsaturated fatty acids may be very low. Vegetable fat half creams had, in general, less saturated fat and more polyunsaturated fatty acids than cream. The spreads and shortenings studied contained less than 2% trans fatty acids of total fatty acids. Consumption of reduced-fat cheese in place of full-fat cheese does not negatively affect the nutritional quality of the consumed fat.
1. Introduction
Dietary fat is a topic of intense discussion, mostly from the point of view of energy reduction. In a recent study, fat content was the most important motivator in the choice of calorie-reduced dairy products. Furthermore, the healthiness was important as well [1]. Reduced-fat cheeses are considered to be a healthier alternative to full-fat cheeses, for their lower fat content.
Milk fat is a significant source of saturated fat. In addition, dairy products typically contain 3% - 6% trans fatty acids (TFA) per gram of fat [2], with vaccenic acid (C18:1 trans-11) as the main TFA. TFAs raise LDL-cholesterol and lower HDL-cholesterol level. In addition, they increase the ratio of total cholesterol to HDL-cholesterol and triglyceride levels [2]. While industrially produced TFAs are well-known for their negative effects on human health, some researchers propose that ruminant TFAs have dissimilar effects on cardiovascular disease risk factors [3,4]. Furthermore, it is suggested [5] that moderate intake of TFA from milk fat is safe.
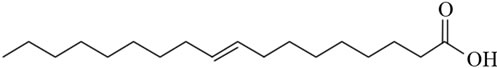
Another interesting group of ruminant fatty acids are the conjugated linoleic acids (CLA), which are widely studied for their possible beneficial effects on health [6-8]. The double bonds in CLA might be cis or trans geometric isomers, yet there is no methylene group between double bonds, thus the double bonds are conjugated instead of methylene-interrupted (Figure 1). Dairy products are the main source of CLA in the human diet. Milk contains on average 0.4% - 1.7% CLA of total fatty acids [9].
In contrast, vegetable fats and oils generally contain more essential fatty acids, linoleic acid LNA and alfa-linolenic acid ALA, than dairy fat. The proportion of saturated fatty acids (SFA) is also usually lower and polyunsaturated fatty acids (PUFA) higher than in animal fat; thus the fatty acid profile is considered to be healthier. However, this is not always the case. For instance, coconut oil
 (a)
(a)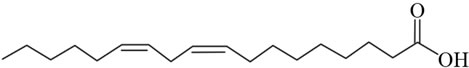 (b)
(b)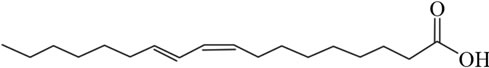 (c)
(c)
Figure 1. The diagram showing the structures of (a) Elaidic acid C18:1 trans-9; (b) Linoleic acid C18:2 cis-9, cis-12; and (c) Conjugated linoleic acid C18:2 cis-9, trans-11.
has 86.5% SFA and 1.8% PUFA, and palm oil has 49.3% SFA (http://ndb.nal.usda.gov/ndb/-foods/list). Olive oil and rapeseed oil are considered more beneficial with 13.8% and 5.7% SFA, and 10.5% and 33.0% PUFA, respectively (http://ndb.nal.usda.gov/ndb/foods/list, http://www.fineli.fi/). Indeed, replacing dairy fat with rapeseed oil has been shown to have a beneficial effect on hyperlipidaemia [10].
However, the hydrogenating and deodorising processes used in the fat industry may generate harmful trans fatty acids in the vegetable oil. Many studies have shown that levels of TFA have, in general, decreased recently in different food items [11-13]. However, edible oils with more than 2% TFA are still found [14].
Margarines, spreads, shortenings, and vegetable fat milkbased products are consumed mainly for their fatty acid profile. These products are generally considered to have less SFA and more PUFA, consequently to be better for cardiovascular health. Labelling the fat content is mandatory in foods. However, labelling the amounts of saturated and unsaturated fat is mandatory in Finland only when a nutritional claim is stated (decree of Ministry of Agriculture and Forestry on nutritional labelling of food 29.7.2009/588). Thus, the labelling information on fat quality might be far from comprehensive. In addition, a review in a market-place revealed that hydrogenated vegetable fat is occasionally used in the production of vegetable fat ice cream and vegetable fat half creams. Several studies show that margarines and spreads may contain TFA in the EU [12,13]. However, there is no recent publication for these products in the Nordic market. The aim of this study was to survey the fatty acid profile of these reduced-fat or substituted-fat dairy products from a nutritional aspect.
2. Materials and Methods
2.1. Laboratory
All analyses were done in the Chemistry and Toxicology Research Unit of Evira, a laboratory accredited by FINAS (Finnish Accreditation Service) according to ISO 17025.
2.2. Reagents
The reference FAME standards were purchased from NuChek Prep Inc. (Elysian, USA). All reagents were of analytical grade.
2.3. Samples
The most commonly consumed cheese varieties were selected. Hard ripened cheese (Edam, Emmental, and Havarti-type) and rapeseed oil cheese substitutes with different fat levels were purchased from local supermarkets. The primary criterion for choosing was market share in Finland, but brands with several fat levels were favoured. One package (size 300 - 900 g) of each sample was selected. The cheeses (n = 20) were categorised according to their variety and measured fat content.
The products that were presumed to include TFA were selected. Margarines and spreads (n = 18), milk-based vegetable fat half creams (n = 11), and vegetable fat ice creams (n = 12) were purchased from local supermarkets. All the margarines and spreads available and all milk-based cream substitutes and vanilla-flavoured ice creams were included in the study. Four of the ice creams were cones including chocolate sauce or jelly. One package (size 400 - 600 g for spreads and size 200 - 1000 g for ice creams) of each product was selected, with the exception of cones, for which one batch including 3 to 6 cones was included. The wafer part of the cone was excluded from the analysis. Two double creams and four half creams were analysed as comparable products.
2.4. Fat Content
The fat content of cheeses was analysed using the SchmidBondzynski-Ratzlaff method, as described in standard ISO-IDF 5 [15]. Samples were first digested with hydrochloric acid. The solution was extracted with diethyl ether and light petroleum after ethanol addition. Solvents were removed by evaporation, and the mass of the extracted material was calculated.
The fat content of margarines, spreads, and shortenings with less than 75% fat was analysed using the RöseGottlieb method, as described in standard IDF 16C [16]. Samples were first digested with ammonia. The solution was extracted with diethyl ether and light petroleum after ethanol addition. Solvents were removed by evaporation, and the mass of the extracted material was calculated. The fat content of shortenings with more than 75% fat was analysed by direct extraction, as described in standard ISO 17189 IDF 194 [17]. The fat was extracted with petroleum ether. The solvent phase was transferred into a fatcollecting vessel. Solvents were removed by evaporation, and the mass of the extracted material was calculated.
Samples were analysed in duplicate.
2.5. Fat Extraction and Methyl Esterification
Fat from shortenings and spreads with more than 40% fat was separated using the ISO 14156 IDF 172 method [18]. The sample was warmed in a 50˚C water bath and filtered through paper (597 HY, Schleicher & Schuell GmbH, Dassel, Germany). Fat from the other products was separated using the DPS detergent method [19] with some modifications. The detergent was a mixture of sodium hexametaphosphate (NaPO3)6 (BDH Laboratory Supplies, Poole, England) and Triton-X-100 (Fluka Chemie GmpH, Buchs, Switzerland) diluted in water. A homogenised or well-mixed sample was mixed with a sesqui-fold volume of DPS detergent and boiled for 15 minutes. The extracted fat was separated and centrifuged before further processing.
Methyl esterification was achieved by base-catalysed transesterification with 2 mol·L–1 methanolic sodium hydroxide [20]. Prepared fatty acid methyl esters (FAME) were dried with calcium chloride and diluted with hexane. Samples were analysed in duplicate.
2.6. Fatty Acid Analysis
The gas-chromatographic method for FAME analysis was validated for Agilent GC model 6890 equipped with mass selective detector 5973 Network and Enhanced ChemStation software (Agilent, USA). The analytical column was J&W Scientific DB-23 (60 m × 0.25 mm × 0.15 μm) for cheeses, creams, margarines, spreads, and shortenings, and J&W Scientific HP-88 (100 m × 0.25 mm × 0.20 μm) for vegetable fat ice creams and cream substitutes. The experimental conditions were: split ratio 55:1 for DB-23 and 20:1 for HP-88, helium as carrier gas and constant pressure mode 180 kPa for DB-23 and 250 kPa for HP-88. The oven temperature program for DB-23 was: initial oven temperature 45˚C, then 25˚C·min–1 to 175˚C and 1.5˚C to 230˚C, and the oven temperature program for HP- 88 was: initial oven temperature 50˚C, then 15˚C·min–1 to 175˚C and 1.0˚C to 240˚C. The MSD parameters were: scan 40 - 400 amu, threshold 100. The retention time for methyl oleate was locked at 15.8 minutes for DB-23. Peak identification was based on retention time correlation with reference standards and mass spectra. Data are expressed as percentages of total FAME content.
2.7. Statistics
One-way ANOVA (factor: cheese variety or solidity of shortening or fat content of spread), Tukey’s Honestly Significant Difference, and Pearson correlation were performed with the SPSS Statistics (18.0.0, SPSS Inc., USA).
3. Results
3.1. Cheeses
The fat content of the reduced-fat cheeses varied from 5.2% to 17.5%, and that of the full-fat cheeses from 23.8% to 30.1%.
The fatty acid profiles of the cheeses categorised by fat content and cheese type are presented in Figure 2. In all samples, the most abundant fatty acids were palmitic (C16:0) acid, stearic (C18:0) acid, and oleic (C18:1 cis-9) acid. Unidentified fatty acids made up less than 0.1% of total fatty acids. These peaks were identified as FAME by their typical mass spectra, but identifications could not be made at isomer level. The proportion of total TFA in individual cheeses varied from 2.09% to 3.37%. The most abundant TFA was vaccenic acid (C18:1 trans-11).
The proportions of four saturated (C6:0, C10:0, C13:0, C14:0) and three monounsaturated (C18:1 cis-9, C18:1 iso, and C18:1 anteiso) fatty acids correlated (p < 0.05) with the fat content (data not shown). In addition, SFA correlated with fat content (p < 0.05). All these correlations were positive except for that of oleic acid C18:1 cis-9. The proportions of CLA and TFA and of every individual trans fatty acid were all independent of the fat content.
We used ANOVA to check if the fatty acid profile varied with cheese variety. There were no significant differences between reduced-fat cheese varieties. We also studied the differences between full-fat and reduced-fat cheeses, taking all varieties together. Reduced-fat cheeses had greater proportions of LNA and MUFA but a smaller proportion of SFA and lower n-6/n-3 (p < 0.05).
3.2. Spreads and Shortenings
Light spreads had a fat content ranging from 29.1% to 41.1%, and fat spreads and margarines from 59.9% to 79.9% (data not shown). 4 of 9 light spreads and 5 of 9 fat spreads were fat mixtures consisting of vegetable fat or oil and butter. The source of vegetable fat or oil was not defined in one product and in 12 products only partly. 17 products contained rapeseed oil. The other fat sources were camelina oil (n = 6), sunflower oil (n = 3), and linseed oil (n = 3). The main fatty acid profiles of spreads and shortenings are presented in Table 1 and the n-6/n-3 ratios in Figure 3. Light spreads had smaller proportions of CLA and TFA than the fattier spreads and margarines. Neither the proportion of LNA, ALA, SFA, MUFA, or PUFA, nor n-6/n-3 ratios showed any significant differences between light spreads and spreads.
Shortenings were generally mixtures of vegetable fats and oils. The fat contents of solid shortenings ranged from

Figure 2. Fatty acid composition (%) and n-6/n-3 ratio of cheese varieties and creams with variable fat content.
56.2% to 82.8% (data not shown). 16 products included rapeseed oil and 10 products included unspecified vegetable fat or oil. The other fat sources were sunflower oil (n = 5), linseed oil (n = 4), and palm oil (n = 1). One liquid shortening also included butter. Of all products, 6 liquid shortenings had a marking of hardened rapeseed oil or vegetable oil. Solid shortenings had less LNA, ALA, MUFA, and PUFA and, in addition, more SFA than liquid shortenings. None of the shortenings had TFA in detectable amounts. The n-6/n-3 ratios varied remarkably, especially in solid shortenings.
3.3. Vegetable Fat Dairy Products
The products were half creams, ice creams and cheese substitutes manufactured with a variable source of fat. Nonetheless, all the products were milk-based. The main fatty acid profiles are presented in Table 1 and the n-6/n-3 ratios in Figure 3.
The fat content of vegetable fat half creams (cream substitutes for cooking with reduced fat content) were claimed to be in the range of 4% to 15%. 3 products consisted of rapeseed oil only. One product included coconut powder as the fat source. The other products included butter milk powder or milk powder (n = 8), unspecified vegetable fat and oil (n = 6), butter milk (n = 2), and palm oil (n = 1). 2 products had a marking of hydrogenated vegetable fat. The mean values were 28.3% for SFA, 49.6% for MUFA, and 21.9% for PUFA (Table 1). However, variations were as large as expected from variable ingredients. All the products had negligible amounts of TFA; the highest proportion was 0.44%. The n-6/n-3 ratios did not vary as much as expected from LNA and ALA variations.
The fat content of vegetable fat ice creams was claimed to be in the range of 5% to 14%. All the vegetable fat ice creams consisted mainly of unspecified vegetable fat. 8 products included whey powder and one cone also included butter oil and vegetable oil. 4 products had a marking of hydrogenated vegetable fat. The mean values were 70.9% for SFA, 24.0% for MUFA, and 4.93% for PUFA (Table 1). All the products had negligible amounts of TFA; the highest proportion was 0.38%. The n-6/n-3 ratios varied between 5.21 and 11.5.
The vegetable fat cheese substitutes contained 12.3% and 19.3% fat. The fat source in cheese substitutes was rapeseed oil. Vegetable fat cheese substitutes contained 7.51% SFA, 64.4% MUFA, and 28.0 PUFA (Table 1). The main fatty acids were oleic acid C18:1 n-9, linoleic acid C18:2 n-6 LNA, and α-linolenic acid C18:3 n-3 ALA (data not shown).
Double creams with 35% fat and half creams with 10% to 15% fat were analysed for a nutritional reference to vegetable fat products. The fatty acid profiles of these products are presented in Figure 2.
4. Discussion
4.1. Cheeses
The fatty acid profiles are in good agreement with those reported for cheeses elsewhere [21,22]. Interestingly, two of the reduced-fat cheeses contained a fatty acid that was not found in the other cheeses. Unspecified isomers of C18:1 and C20:1 cis-11 were detected in one reduced-fat cheese. One possible explanation is that the fatty acids are generated during cheese production by divergent lipid metabolism of a starter culture [21]. Many microorganisms, including lactic acid bacteria, propionibacteria, and bifidobacteria, have been studied for their ability to produce CLA, and differences between strains have indeed been found [23]. It is probable that the productivity of other fatty acid isomers differs correspondingly.

Figure 3. Mean and variation of n-6/n-3 ratio of variable fat products and vegetable fat dairy products. The maximum recommended level (9) according to Nordic Nutrition Recommendations [24] is marked by a line.
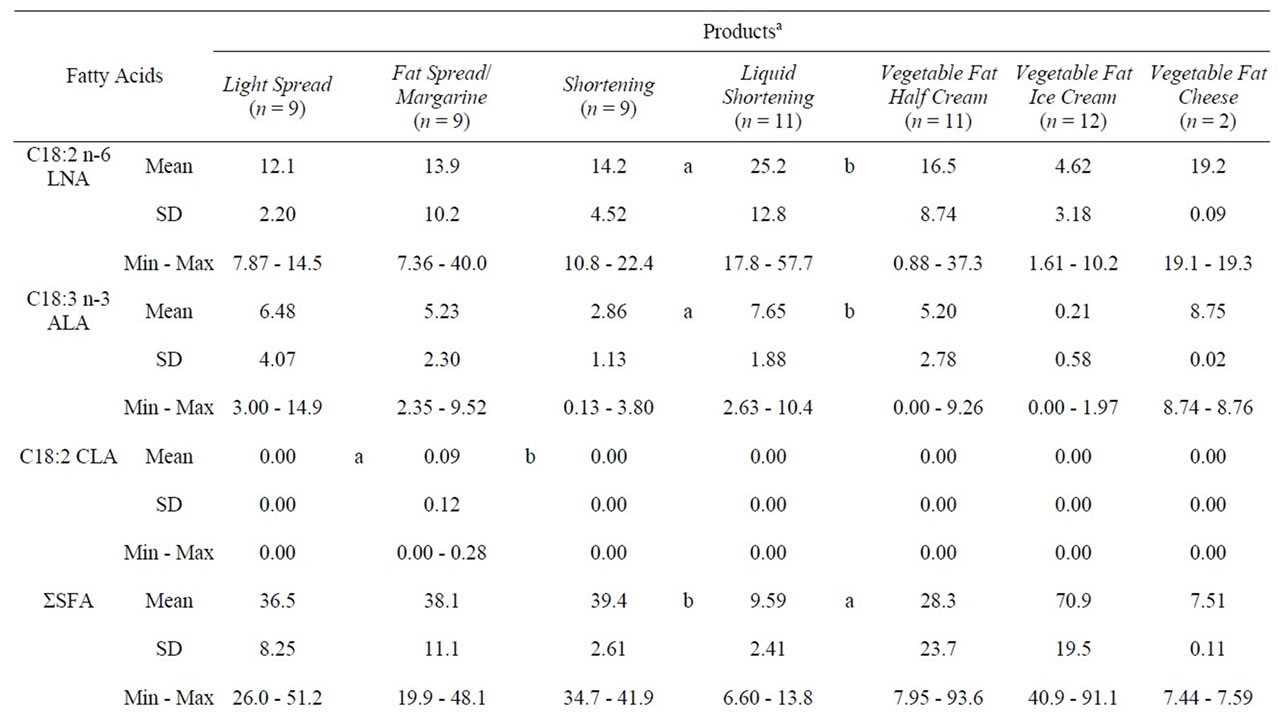
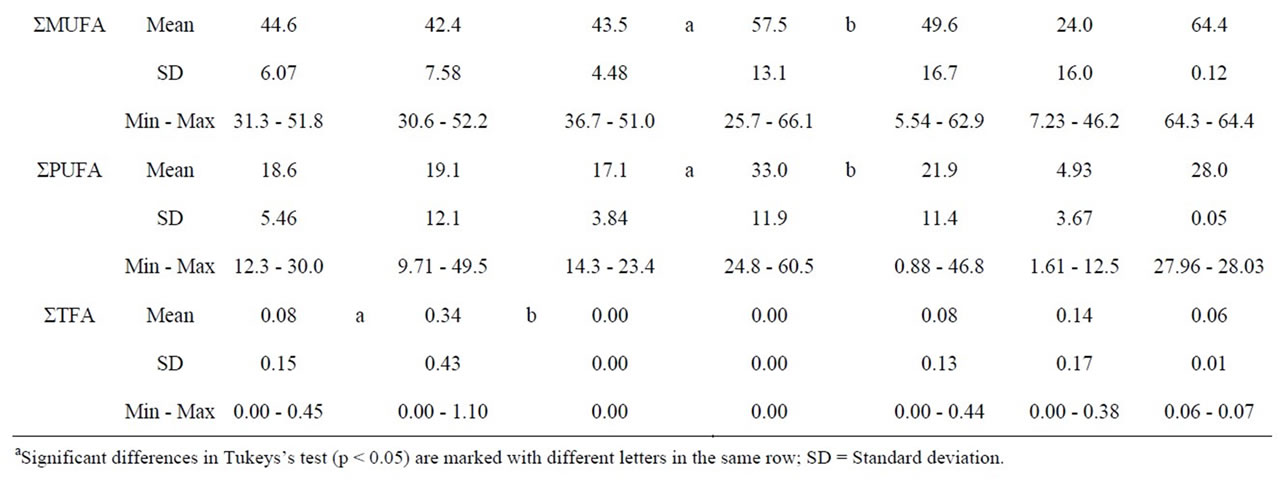
Table 1. Fatty acid composition (%) of variable fat products and vegetable fat dairy products.
Only one isomer of CLA was detected: C18:2 cis-9, trans-11, which is the main isomer in milk [9]. The proportions of CLA in the individual cheeses varied from 0.23% to 0.58%. These values are well within the ranges reported for Swedish hard cheeses [25] and American Cheddar [21], but lower than the values reported for cheese elsewhere [26-29].
TFA values were slightly lower than those reported for cow milk [9,22] and Emmental [30]. In addition, the proportions of vaccenic acid (data not shown) were lower than those reported for different cheese varieties [31], although similar to those reported for cheese elsewhere [32]. The fatty acid composition of milk is affected by several factors, which creates variability from country to country [33]. Feeding regime and genetic composition are two important factors.
The proportion of SFA was lower and the proportion of LNA was higher in the reduced-fat cheeses than in the full-fat cheeses (p < 0.05), and the lower values enhance the positive effect of fat reduction. Contrary to our finding, Nelson and Barbano [34] observed a slight increase in the proportion of SFA in reduced-fat cheese when using a novel fat removal process. However, total fat content must always be taken into consideration when estimating the health effect. Thus, although the proportion of LNA was highest in the reduced-fat cheeses, the total amount was lower because of the lower fat content.
We found some differences in individual fatty acids between the cheese varieties. CLA content has been found to differ between cheese varieties [31]. It was stated in a review [23] that processing usually has no effect on the CLA content of cheese, whereas ripening time sometimes has an effect. The season of the year has an effect on the fatty acid profile of cheese [26]. The sampling was not suitable to ascertain whether the variance found here originnates from milk or from cheese production. However, the differences found here are not remarkable from the view of healthiness.
4.2. Spreads and Shortenings
The fatty acid profiles varied remarkably between products. In general, liquid shortenings contained more PUFA and MUFA and essential fatty acids LNA and ALA than solid shortenings. Fattier spreads contained more TFA than light spreads. However, none of the shortenings and only one spread contained more than 1% TFA. Industrial TFA is not separated from ruminant TFA in Table 1. Only the spreads with butter contained TFA (data not shown). Thus, it can be concluded that spreads and shortenings have very little TFA in Finland, and it is mostly from ruminant origin. Studies from Austria [12] showed 3.37% ± 6.15% TFA in margarines and fats, and in Switzerland [13] 3.86% TFA in margarines and shortenings. Household margarines tend to have less TFA than industrial fats. However, very recent publications (less than 3 years old) were not found. So far, Denmark is the only country where there is a limit for TFA in fats and oils in legislation. The TFA contents found here were less than the regulation limit of 2 g per 100 g of oil or fat in Denmark (Order no. 160 of 11 March 2003 on the content of trans fatty acids in oils and fats). In view of this survey, regulations considering TFA content are not needed in Finland.
The n-6/n-3 ratio is recommended to be between 3 and 9 by Nordic Nutrition Recommendations [24]. Spreads in general had lower n-6/n-3 ratios than recommended, and shortenings higher ratios than recommended. Although it has been stated [35] that this ratio has no meaning for the risk of cardiovascular disease, some studies [36] conclude that the long-chain PUFA status can be improved by increasing n-3 intake and decreasing n-6 intake, meaning lower n-6/n-3 ratios. Consumers must be very conscious about different fatty acids and their relevance to health when selecting these products. The awareness of the difference between saturated and unsaturated fat is not adequate in the USA, where only half of consumers knew whether fats are “good” or “bad” [37]. In the UK, the understanding of nutrition information on food labels was 87.5% [38]. However, in the same study, only 27% of shoppers were found to have looked at nutrition information on the label. Considering the fact that PUFA is seldom labelled, and n-3 fatty acids even more rarely, the task is not easy.
4.3. Vegetable Fat Dairy Products
The fatty acid profiles of creams were similar to those reported for milk-fat [9,39]. CLA content was lower than reported for Swedish whipping cream [25] and Swiss cream [23], but at the same level as reported for Dutch milk in spring-time [39]. Creams in this study were collected during a corresponding period. Milk fat is a remarkable source of SFA in the diet. The n-6/n-3 ratio is at the recommended level, though concentrations of LNA and ALA are low.
A few vegetable fat ice creams and half creams contained little TFA, however the proportion was less than 1% in every case. Compared to cream, vegetable fat half creams in general contained less SFA and more PUFA. The product with coconut powder contained the highest proportion of SFA. The mean value for SFA in vegetable fat ice creams was almost the same as in cream; nevertheless, the large variation means that products with more SFA than cream are common. Against the general presupposition, it can be concluded that consuming vegetable fat ice cream instead of real ice cream may increase SFA intake. Levels of LNA and ALA in vegetable fat ice creams and half creams also varied considerably, presumably according to the fat source. However, they contain more LNA than cream. The n-6/n-3 ratios in vegetable fat half creams were, in general, at the recommended level of between 3 and 9, and no exceeding values were detected. However, one half cream and 10 ice creams with vegetable fat did not have detectable amounts of ALA, so the ratio could not be calculated and can be considered to exceed the recommended level. The obligatory labelling for products without a nutritional claim is very restricted; only fat content must be labelled. Consumers should have good knowledge about vegetable fats and oils to be able to distinguish the product with the best fatty acid profile for health.
The fatty acid profiles of cheese substitutes corresponded to rapeseed oil, according to the Finnish food composition database (http://www.fineli.fi/food.php?foodid=535&lang=en). Cheese with rapeseed oil contains a lot more LNA and ALA, and less SFA, than cheese with milk-fat. The n-6/n-3 ratio is not at the recommended level; however, high oleic acid, LNA, and ALA content makes dairy products with rapeseed oil healthy [10]. Vegetable fat products do not contain CLA. On the other hand, in a review by Collomb, et al. [8], the beneficial effects of CLA could not be established.
5. Conclusions
Fat reduction in cheese had an influence on the proportions of LNA, SFA, and MUFA and, in addition, the proportion of SFA correlated positively with the fat content. However, we can conclude that consumption of reduced-fat cheese in place of full-fat cheese does not negatively affect the quality of the consumed fat.
Liquid shortenings in general have a better fatty acid profile for health than solid shortenings. Shortenings, spreads and margarines, vegetable fat half creams, and vegetable fat ice creams on the Finnish market have only negligible amounts of TFA. There are differences between the fatty acid profiles of light spreads and fattier spreads, however, both groups include products with the recommended n-6/n-3 ratio. Vegetable fat half creams are generally healthier than cream. In contrast, vegetable fat ice creams may have more SFA and a higher n-6/n-3 ratio than cream. Dairy products with vegetable fat have variable fatty acid profiles. A lot of knowledge about different fats and oils is needed by the consumer to be able to distinguish the product with the healthiest fat. The mandatory labelling is inadequate in many cases. It can be concluded that TFA is not a problem in Finland, but more information on fat quality on the label is needed.
6. Acknowledgements
This study was funded by the Finnish Food Safety Authority Evira. The authors wish to thank Susanna Eerola (now at Roal Ltd.) for inspiration, Tiina Soininen and Kirsi Tynjälä for their practical work in the laboratory, and Jonna Pelanti (now at Labquality Ltd.) for her technical help with the GC-MS “Timo”.
REFERENCES
- S. B. Johansen, T. Næs and M. Hersleth, “Motivation for Choice and Healthiness Perception of Calorie-Reduced Dairy Products. A Cross-Cultural Study,” Appetite, Vol. 56, No. 1, 2011, pp. 15-24. doi:10.1016/j.appet.2010.11.137
- European Food Safety Authority, “Opinion of the Scientific Panel on Dietetic Products, Nutrition and Allergies on a Request from the Commission Related to the Presence of Trans Fatty Acids in Foods and the Effect on Human Health of the Consumption of Trans Fatty Acids,” EFSA Journal, Vol. 81, 2004, pp. 1-49.
- J. M. Chardigny, et al., “Do Trans Fatty Acids from Industrially Produced Sources and from Natural Sources Have the Same Effect on Cardiovascular Disease Risk Factors in Healthy Subjects? Results of the Trans Fatty Acid Collaboration (TRANSFACT) Study,” American Journal of Clinical Nutrition, Vol. 87, 2008, pp. 558-566.
- International Dairy Federation, “Trans Fatty Acids: Scientific Progress and Labelling,” Bulletin of IDF, Vol. 393, 2005, pp. 1-25.
- A. Motard-Bélanger, et al., “Study of the Effect of Trans Fatty Acids from Ruminants on Blood Lipids and Other Risk Factors for Cardiovascular Disease,” American Journal of Clinical Nutrition, Vol. 87, 2008, pp. 593-599.
- P. W. Parodi, “Conjugated Linoleic Acid and Other Anticarcinogenic Agents of Bovine Milk Fat,” Journal of Dairy Science, Vol. 82, No. 6, 1999, pp. 1339-1349. doi:10.3168/jds.S0022-0302(99)75358-0
- L. D. Whigham, M. E. Cook and R. L. Atkinson, “Conjugated Linoleic Acid: Implications for Human Health,” Pharmacological Research, Vol. 42, No. 6, 2000, pp. 503-510. doi:10.1006/phrs.2000.0735
- M. Collomb, A. Schmid, R. Sieber, D. Wechsler and E.-L. Ryhänen, “Conjugated Linoleic Acids in Milk Fat: Variation and Physiological Effects,” International Dairy Journal, Vol. 16, No. 11, 2006, pp. 1347-1361. doi:10.1016/j.idairyj.2006.06.021
- P. J. Moate, W. Chalupa, R. C. Boston and I. J. Lean, “Milk Fatty Acids. I. Variation in the Concentration of Individual Fatty Acids in Bovine Milk,” Journal of Dairy Science, Vol. 90, No. 10, 2007, pp. 4730-4739. doi:10.3168/jds.2007-0225
- D. Iggman, I.-B. Gustafsson, L. Berglund, B. Vessby, P. Marckmann and U. Risérus, “Replacing Dairy Fat with Rapeseed Oil Causes Rapid Improvement of Hyperlipidaemia: A Randomized Controlled Study,” Journal of Internal Medicine, Vol. 270, No. 4, 2011, pp. 356-364. doi:10.1111/j.1365-2796.2011.02383.x
- D. Saunders, S. Jones, G. J. Devane, P. Scholes, R. J. Lake and S. M. Paulin, “Trans Fatty Acids in the New Zealand Food Supply,” Journal of Food Composition and Analysis, Vol. 21, No. 4, 2008, pp. 320-325. doi:10.1016/j.jfca.2007.12.004
- K.-H. Wagner, E. Plasser, C. Proell and S. Kanzler, “Comprehensive Studies on the Trans Fatty Acid Content of Austrian Foods: Convenience Products, Fast Food and Fats,” Food Chemistry, Vol. 108, No. 3, 2008, pp. 1054- 1060. doi:10.1016/j.foodchem.2007.11.038
- E. K. Richter, K. A. Shawish, M. R. L. Scheeder and P. C. Colombani, “Trans Fatty Acid Content of Selected Swiss Foods: The TransSwissPilot Study,” Journal of Food Composition and Analysis, Vol. 22, No. 5, 2009, pp. 479- 484. doi:10.1016/j.jfca.2009.01.007
- J.-C. Hou, F. Wang, Y.-T. Wang, J. Xu and C.-W. Zhang, “Assessment of Trans Fatty Acids in Edible Oils in China,” Food Control, Vol. 25, No. 1, 2012, pp. 211-215. doi:10.1016/j.foodcont.2011.10.044
- ISO-IDF, “Cheese and Processed Cheese Products— Determination of Fat Content—Gravimetric Method (Reference Method),” Standard ISO 1735/IDF 5, International Dairy Federation, Brussels, 2004.
- International Dairy Federation, “Cream—Determination of Fat Content (Röse-Gottlieb Reference Method),” Standard IDF 16C, International Dairy Federation, Brussels, 1987.
- ISO-IDF, “Butter, Edible Oil Emulsions and Spreadable Fats—Determination of Fat Content—(Reference Method),” Standard ISO 17189/IDF 194, International Dairy Federation, Brussels, 2003.
- ISO-IDF, “Milk and Milk Products—Extraction Methods for Lipids and Liposoluble Compounds,” Standard ISO 14156/IDF 172, International Dairy Federation, Brussels, 2001.
- H. V. Atherton and J. A. Newlander, “Chemistry and Testing of Dairy Products,” 4th Edition, The Avi Publishing Company Inc., Westport, 1977, p. 396.
- M. A. Prevot, E. Gantoi, M. Holand and M. Rosset, “Methode Rapide de Dosage de l’acide Erucique dans les Graines de Colza,” Revue Française des Corps Gras, Vol. 22, 1975, pp. 211-215.
- H. Lin, T. D. Boylston, L. O. Luedecke and T. D. Shultz, “Conjugated Linoleic Acid Content of Cheddar-Type Cheeses as Affected by Processing,” Journal of Food Science, Vol. 64, No. 5, 1999, pp. 874-878. doi:10.1111/j.1365-2621.1999.tb15931.x
- L. M. Rodríguez-Alcala, F. Harte and J. Fontecha, “Fatty Acid Profile and CLA Isomers Content of Cow, Ewe and Goat Milks Processed by High Pressure Homogenization,” Innovative Food Science and Emerging Technologies, Vol. 10, No. 1, 2009, pp. 32-36. doi:10.1016/j.ifset.2008.10.003
- W. Bisig, P. Eberhard, M. Collomb and B. Rehberger, “Influence of Processing on the Fatty Acid Composition and the Content of Conjugated Linoleic Acid in Organic and Conventional Dairy Products—A Review,” Lait, Vol. 87, No. 1, 2007, pp. 1-19. doi:10.1051/lait:2007001
- European Food Safety Authority, “Scientific Opinion on Dietary Reference Values for Fats, Including Saturated Fatty Acids, Polyunsaturated Fatty Acids, Monounsaturated Fatty Acids, Trans Fatty Acids, and Cholesterol,” EFSA Journal, Vol. 8, 2010, pp. 1-107.
- J. Jiang, L. Björck and R. Fondén, “Conjugated Linoleic Acid in Swedish Dairy Products with Special Reference to the Manufacture of Hard Cheeses,” International Dairy Journal, Vol. 7, No. 12, 1997, pp. 863-867. doi:10.1016/S0958-6946(98)00004-1
- G. Zeppa, M. Giordano, V. Gerbi and M. Arlorio, “Fatty Acid Composition of Piedmont ‘Ossolano’ Cheese,” Lait, Vol. 83, No. 2, 2003, pp. 167-173. doi:10.1051/lait:2003007
- A. K. Seçkin, O. Gursoy, O. Kinik and N. Akbulut, “Conjugated Linoleic Acid (CLA) Concentration, Fatty Acid Composition and Cholesterol Content of Some Turkish Dairy Products,” LWT—Food Science and Technology, Vol. 38, 2005, pp. 909-915.
- A. Prandini, S. Sigolo, G. Tansini, N. Brogna and G. Piva, “Different Level of Conjugated Linoleic Acid (CLA) in Dairy Products from Italy,” Journal of Food Composition and Analysis, Vol. 20, No. 6, 2007, pp. 472-479. doi:10.1016/j.jfca.2007.03.001
- J. C. Nunes and A. G. Torres, “Fatty Acid and CLA Composition of Brazilian Dairy Products, and Contribution to Daily Intake of CLA,” Journal of Food Composition and Analysis, Vol. 23, No. 8, 2010, pp. 782-789. doi:10.1016/j.jfca.2010.03.023
- V. Briard-Bion, P. Juaneda, R. Richoux, E. Guichard and C. Lopez, “Trans-C18:1 Isomers in Cheeses Enriched in Unsaturated Fatty Acids and Manufactured with Different Milk Fat Globule Sizes,” Journal of Agricultural and Food Chemistry, Vol. 56, No. 13, 2008, pp. 9374-9382. doi:10.1021/jf801333j
- J. Domagała, M. Sady, T. Grega, H. Pustkowiak and A. Florkiewicz, “The Influence of Cheese Type and Fat Extraction Method on the Content of Conjugated Linoleic Acid,” Journal of Food Composition and Analysis, Vol. 23, No. 3, 2010, pp. 238-243. doi:10.1016/j.jfca.2009.11.002
- P. Bergamo, E. Fedele, L. Iannibelli and G. Marzillo, “Fat-Soluble Vitamin Contents and Fatty Acid Composition in Organic and Conventional Italian Dairy Products,” Food Chemistry, Vol. 82, No. 4, 2003, pp. 625-631. doi:10.1016/S0308-8146(03)00036-0
- H. C. Schönfeldt, N. G. Hall and L. E. Smit, “The Need for Country Specific Composition Data on Milk,” Food Research International, Vol. 47, No. 2, 2012, pp. 207-209. doi:10.1016/j.foodres.2011.05.018
- B. K. Nelson and D. M. Barbano, “Reduced-Fat Cheddar Cheese Manufactured Using a Novel Fat Removal Process,” Journal of Dairy Science, Vol. 87, No. 4, 2004, pp. 841-853. doi:10.3168/jds.S0022-0302(04)73228-2
- B. A. Griffin, “How Relevant is the Ratio of Dietary n-6 to n-3 Polyunsaturated Fatty Acids to Cardiovascular Disease Risk? Evidence from the OPTILIP Study,” Current Opinion in Lipidology, Vol. 19, No. 1, 2008, pp. 57-62. doi:10.1097/MOL.0b013e3282f2e2a8
- J. T. Brenna, N. Salem Jr., A. J. Sinclair and S. C. Cunnane, “α-Linolenic Acid Supplementation and Conversion to n-3 Long-chain Polyunsaturated Fatty Acids in Humans,” Prostaglandins, Leukotrienes and Essential Fatty Acids, Vol. 80, No. 2, 2009, pp. 85-91. doi:10.1016/j.plefa.2009.01.004
- C. Diekman and K. Malcolm, “Consumer Perception and Insights on Fats and Fatty Acids: Knowledge on the Quality of Diet Fat,” Annals of Nutrition and Metabolism, Vol. 54, Supp.1, 2009, pp. 25-32. doi:10.1159/000220824
- K. G. Grunert, J. M. Wills and L. Fernández-Celemín, “Nutrition Knowledge, and Use and Understanding of Nutrition Information on Food Labels among Consumers in the UK,” Appetite, Vol. 55, No. 2, 2010, pp. 177-189. doi:10.1016/j.appet.2010.05.045
- J. M. L. Heck, H. J. F. van Valenberg, J. Dijkstra and A. C. M. van Hooijdonk, “Seasonal Variation in the Dutch Bovine Raw Milk Composition,” Journal of Dairy Science, Vol. 92, No. 10, 2009, pp. 4745-4755. doi:10.3168/jds.2009-2146