Food and Nutrition Sciences
Vol. 3 No. 3 (2012) , Article ID: 17954 , 5 pages DOI:10.4236/fns.2012.33041
Nutritional Status, Food Consumption at Home, and Preference-Selection in the School
![]()
Educación para la Salud, FES Iztacala, Universidad Nacional Autónoma de México, México City, México.
Email: lopezg@campus.iztacala.unam.mx
Received December 17th, 2011; revised February 18th, 2012; accepted February 25th, 2012
Keywords: Food Preferences; Diet; Schoolchild; Nutritional Status
ABSTRACT
To assess the relationship between food consumption at home, nutritional status, gender preference and the preference-selection of natural products (fruits and vegetables) and industrialized (candies and chips) in a situation of free access for a population of Mexican schoolchildren. 115 children participated in the test, 59 boys and 56 girls from second, fourth and sixth grade of elementary school. We have taken measures of weight, size and the 24-hour consumption record during over five days, at which time also we evaluated the preference and selection of a group of ten products (naturals and industrialized). According to the results 60% of children had normal weight, 23.47% overweight, 14.8% risk of overweight an 1.73% underweight. There were no significant differences with X2 test between nutritional status and gender. Multivariate analysis was applied between gender, consumption by food groups and nutritional status, the interaction was significant in all cases. The Pearson correlation between preference and food choice in the situation of open access is high in the school students at risk of overweight. The preferred and selected products for consumption are those with the highest content of saturated fat, sugars and salt, the less preferred and selected products were fruits and vegetables. We could conclude that the population is at risk for their low consumption of fruits and vegetables; situation that is reflection of the home consumption this document.
1. Introduction
In Mexico, as in other countries of the world, the bad nutrition appears like a public health problem, the deficiencies or excesses in the food consumption are recognized like factors that take part, on one hand, in the process of infectious diseases, and chronic degenerative by the other hand. The children constitute a vulnerable population to the bad nutrition, for that reason, the study and monitoring of their nutritious status has been constituted in center of governmental policies and investigation in the health sector. In the case of the Mexican schoolchildren a study [1] made with 324 children of public schools reported, that, respect to the indicators of weight and height for age, the slight undernourishment affected more to the men than the women between the 6 and 10 years of age, while the overweight and the obesity affect to the 8% of the total population. In the indicator weight and height for age, 24% of the students they had slight undernourishment, 8.3% moderate and normal for the rest of the population. It is interesting to mention that the predominance of the serious malnutrition in this study was less frequent than the slight one or moderate one, reason why the authors conclude that the slight and moderate malnutrition is located mainly in the early stages of the life. These findings are confirmed the results in other studies done in the Mexican National Health and Nutrition Survey 2006 [2].
The overweight and the obesity have been increased in the two last decades. According to the National Survey of Chronic Diseases [3], 21% of the habitants of urban zones in our country presented obesity, in the case of the smaller children of five years [4]; the obesity has increased from 6.1% in 1988 to 7.6% in 2006, and appears to have stabilized in the last seven years.
In the case of the schoolchildren of the urban zones the prevalence of overweight and obesity, according to its body mass index, was of 31.1% and in the 20% in the rural zones. Moreover, there is evidence that children have low consumption of fruits and vegetables and high consumption of foods rich in fats, sugars and salts, which harm nutritional status [5-8].
The children regularly ingests what the responsible adult provides to him for his feeding: the mother or caregiver, nevertheless, most of them has the option to choose freely foods in the school, behavior that can be regulated by the repeated exhibition to certain products through massive mass media [9], the experiences obtained during the early childhood, mainly in the home[10], or by the attitudes and knowledge that the students have of nutrition [11] affecting the preferences and the selections that they make in this context.
The food that the children ingest in the home and the consumption that make in the school contribute to their nutritious state. If a scholarship learned to consume certain type of products in the home this learning will be reflected in a situation of free election of nourishing products, but the factors that affect their preference and selection are of another nature like publicity, presentation, packing, availability, nutritious state or sort, will be observed differences with respect to the food consumption in the home, for that reason, the objective of this work is to evaluate the relation between the food consumption in house, the nutritious state, sort and the preference and selection of products natural (fruits and vegetables) and industrialized (candies and chips) in a situation of free access of a population of Mexican students.
2. Materials and Methods
2.1. Participants
115 children of 6 intact groups: 56 girls, 14 attended the second year of elementary education, 21 the fourth and 21 sixth; 59 boys, 14 of second, 25 of fourth and 17 of sixth degree of primary. All the children were selected from a public school located in the metropolitan zone of the city of Mexico. The ages of the students fluctuated of the seven to the 13 years. The consent informed into the scholastic authorities, the professors and the parents of family was obtained. The students who participated in the study were selected intentionally and assigned by the educative authority’s reason why the sample was not probabilistic.
2.2. Situation
The study was made in the school in an area of the central schoolyard; that was prepared for the aims of the study: the measuring tape was placed in a wall alongside and the scale for the measures of weight; the nourishing products arranged in a table without a location predetermined for each one of them.
2.3. Apparatuses and Materials
Were used scales and measuring tape to take anthropometric measures; nourishing industrialized products (chips, popcorn with chili, flour chips, lollipop with chili and lollipop with chili and chewing gum) and natural products (apples, pears, oranges, yam bean with lemon and chili and carrots with lemon and chili) for the evaluation of nourishing product preference and selection. The products were classified in industrialists (process) or naturals (vegetal and fruits).
2.4. Instruments
In order to evaluate the food ingestion of the scholar children in the familiar nucleus, was used the 24-hour consumption record, for being a practical and reliable method to assent the ingestion of food consumed by children [12,13]. In this one included the registry of the general performances of each one of the students (age, sort, scholastic degree) and the obtained anthropometric measures were written down. Also a record format was used to collect the data of the preference and the nourishing product selection in the scholastic scope.
2.5. Procedure
In the first day of the study, measures were taken from weight and carves to each participant student in the study as well as its general performances, later a same record of 24 hours was applied that was repeated by a period of 5 days. In both cases the people who collected the data were previously trained.
After the application of the 24-hour consumption record we show to each one of the participants five Industrialized products and five natural ones, asking to him the kid who ordered them from the 1 to the 10 according to his preference (the 1 for most preferred and 10 less preferred or rejected). Made this, the children had to select one of the products for his/her personal consumption. The data were collected by means of an occurrence registry during five days.
3. Results
3.1. Nutritional Status
To establish the nutritious state of the students, we took like reference the tables from the National Center of Health Statistics [14] and for the statistical analysis program SPSS was used (version 15). Of the total of the studied population it is possible to be observed (Table 1) that practically does not have scholar children of low weight because were found two cases that represent the 1.7% of the total. The rest of the students was distributed in standard weight (60%) who conform the greatest proportion followed by that they have overweight (23.4%) and those that is in overweight risk (14.8%).
In the analysis of nutritional status by gender data were very similar for both genders although slightly higher in the case of overweight of boys and increased risk of girls with overweight, however, we can say that there are no differences gender in relation to nutritional status, which was confirmed through square a Ji test where X2 (3, 115) = 2.80, p > 0.05.
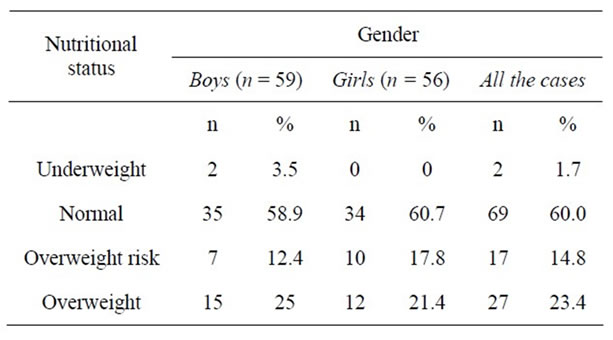
Table 1. Nutritional status by gender.
3.2. Intake the Foods and Nutritional Status
The relation between nutritional status and feeding type that the students ingest in their homes obtained from the data of the 24-hour consumption record applied during five days. The information was organized by food groups according to the following classification [15]: vegetables and fruits; integral grains; animals products; oils and starches; saturated fats and sugars.
We calculated the consumption frequency of each one of the nourishing groups by nutritional status and the corresponding percentage. Found that the consumption by food group in the population of students is very similar, to the margin of its nutritional status and sort: exist a low consumption of fruits and vegetables and high consumption of saturated fats and sugars (Table 2).
Multivariate analysis was applied to determine if the consumption by food group were or non significant with respect to the gender and nutritious state (Table 3). The statistical relation between the food consumption and the sort confirmed the non significant differences in relation fruits and vegetables, but in the other groups of food, either nutritional status or gender.
3.3. Food Preference, Food Choice and Nutritious State Relation
The percentage of natural products calculated that the children preferred and selected for their consumption and it was related to his nutritious state and gender, also calculated the coefficient of correlation of Pearson between the preference and food selection. When Pearson Test was used with all children, without separating nutritional status, there are high correlations. By separating by nutriational status, the highest correlations were for the normal weight group, both girls and boys (Table 4).
Both genders prefer and select the industrialized products over the natural ones, particularly the underweight children (Figures 1 and 2).
3.4. Food Consumption at Home and School
To see if there was association between home consumption and consumption in a situation of free access to the school also implemented the Pearson correlation coefficient of nutritional status the Pearson correlation coefficient by nutritional state was applied to see if there was
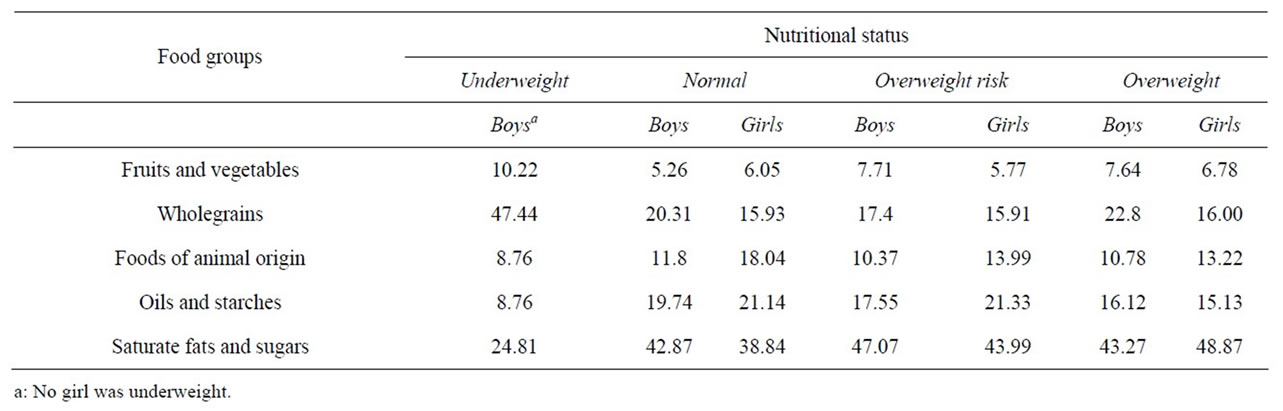
Table 2. Percentage of children consuming foods of differents groups.
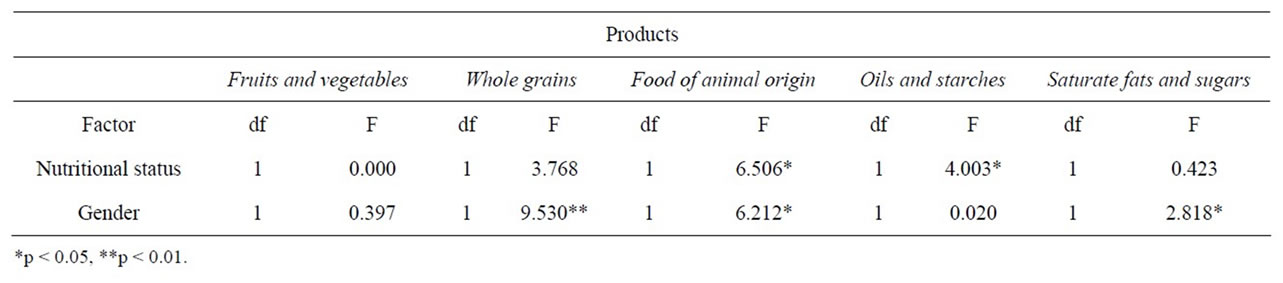
Table 3. Intake by food group, nutritional status and gender.
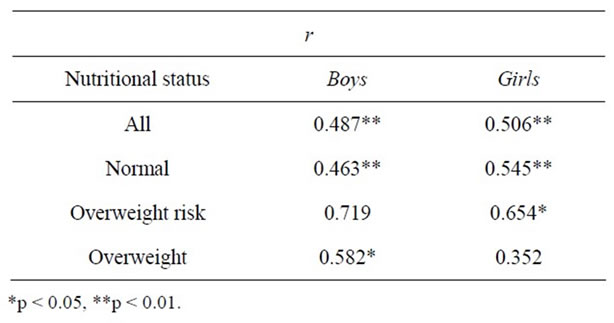
Table 4. Pearson coefficient in natural food preferenceselection by gender.
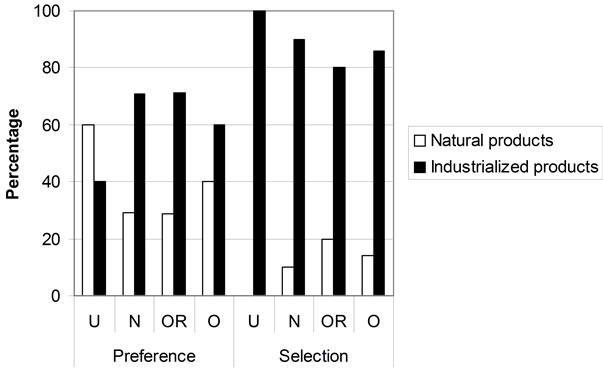
Figure 1. Preference and selection by nutritional status (boys). U: Underweight, N: Normal, OR: Overweight Risk, O: Overweight.
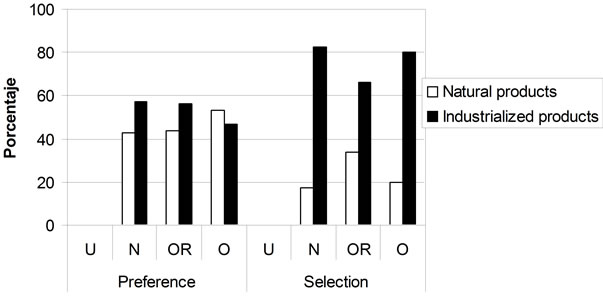
Figure 2. Preference and selection by nutritional status (girls). U: Underweight, N: Normal, OR: Overweight Risk, O: Overweight.
partnership between domestic consumption and consumption in a situation of free access to school also. The correlation in all cases was minors to r = 0.1 proving not be significant.
4. Discussion
Although the results show that most of the children have a normal weight, it appears that a third of this population shows trend overweight and obesity, these data are consistent with those reported in national surveys in Mexico [2,16].
The differences in the nutritional status can be explained only in terms of intake of grains, animal products and oils and starches and that there were no differences in the consumption of fruits and vegetables, fats saturated sugars, however, it is also important to consider differences in physical activity performed by schoolchildren, which was not assessed and should considered in future work.
The consumption of food both at home and in the situation of free access addresses the group with a higher content of food oils and starches, fats saturated sugars, food groups is recommended to eat less proportion according to the Mexican Official Standard [17] for the promotion and education in food matter and show low consumption of fruits and vegetables that are considered an important element in the daily food intake, as other studies show [18,19].
Food intake of children in the home and its link with the preference and selection of products in a situation where the school defines ingest, allowing assess the influence of family preference and selection of food students performed at a free selection. It was noted that they prefer and select fewer products consumed at home and just over those eat at home.
Probably the organoleptic characteristics as they are accustomed to the taste are an important guides your choice and selection. Notably, as in other studies the preference in this population of students is a reliable indicator of your choice [10].
The schoolchild population is considered at risk of acquiring any diseases associated with overweight and obesity such as diabetes mellitus, atherosclerosis, high blood pressure and some cancers [20,21] so develop and implement a program of nutritional education and physical activity would reduce the risks. The link found between fat intake sugars and saturated in the household with the preference and selection of products in a free food for school children, shows that families play a important role in shaping eating habits, where the scents and flavors, as the underlying food, condition and strengthen both the preference as the choice of products that contain them. To emphasize the strong association preference selection in schoolchildren whose nutritional status is at risk because it can be an indicator strongly established habits. In the light of the results, it is important to consider physical activity for evaluation in future studies because this may be one factor explaining the differences in nutritional status regardless of the daily intake of food.
REFERENCES
- T. Shamah-Levy and R. C. Vázquez, “Evaluación de la Orientación Alimentaria en Escolares a Través de la Vigilancia Nutricional,” Boletín Médico del Hospital Infantil de México, Vol. 55, No. 1, 1998, pp. 314-322.
- G. Olaíz-Fernández, J. Rivera-Dommarco, T. ShamahLevy, R. Rojas, S. Villalpando-Hernández, M. Hernández-Ávila and J. Sepúlveda-Amor, “Encuesta Nacional de Salud y Nutrición 2006,” Instituto Nacional de Salud Pública, Cuernavaca, México, 2006.
- Ministry of Health, “Encuesta Nacional de Enfermedades Crónicas,” Dirección General de Epidemiología, México, 1993.
- T. González de Cossío, J. A. Rivera, D. González-Castell, M. Unar-Munguía and E. Monterrubio, “Child Malnutrition in Mexico in the Last Two Decades: Prevalence Using The New WHO-2006 Growth Standards,” Salud Pública de México, Vol. 51, No. S4, 2009, pp. 494-506.
- A. E. Evans, M.K. Sawyer-Morse and A. Betsinger, “Fruit and Vegetable Consumptions among MexicanAmerican College Students,” Journal of the American Dietetic Association, Vol. 100, No. 1, 2000, pp. 1399- 1402. doi:10.1016/S0002-8223(00)00388-6 http://www.sciencedirect.com/science/article/pii/S0002822300003886#sec2
- S. Domel, T. Baranowski, H. Davis, W. Thompson, S. Leonard, P. Riley, J. Baranowski, V. Dudovitz and M. Smyth, “Development and Evaluation of School Intervention to increase Fruit and Vegetable Consumption among 4th and 5th Grade Students,” Journal of Nutrition Education, Vol. 25, No. 6, 1993, pp. 345-349.
- S. Domel, W. Thompson and H. Davis, “Fourth-Grade Children’s Observed Consumption of, and Preferences for, School Lunch Foods,” Nutrition Research, Vol. 20, No. 3, 2000, pp. 439-443.
- J. Ward, D. Hoelscher and M. Briley, “Food Choices of Third-Grade Children in Texas,” Journal of the American Dietetic Association, Vol. 102, No. 3, 2002, pp. 409-412. doi:10.1016/S0002-8223(02)90095-7
- L. Birch and J. O. Fisher, “Development of Eating Behaviors among Children and Adolescents,” Pediatrics, Vol. 101, No. 3, 1998, pp. 539-549.
- L. Birch, “Psychological Influences on the Childhood Dietetic,” Journal of Nutrition, Vol. 128, No. 2, 1998, pp. 407S-410S.
- Y. Wong, Y. Ch. Huang, S. L. Chen and S. Yamamoto, “Is de College Environment Adequate for Accessing to Nutrition Education: A Study in Taiwan,” Nutritional Research, Vol. 19, No. 9, 1999, pp. 1327-1337. http://www.sciencedirect.com/science/article/pii/S0271531799000901
- C. Ribbeck, A. Pinheiro and E. Atalah, “Comparación de los Resultados de dos Métodos de Encuestas Alimentarias,” Archivos Latinoamericanos de Nutrición, Vol. 53, No. 2, 2003, pp. 172-177.
- M. Zamora and V. Valverde, “El Puntaje Dietético Co-mo Metodología Simplificada Para Procesar y Analizar Datos de Consumo de Alimentos,” Archivos Latinoame-ricanos de Nutrición, Vol. 33, No. 4, 1983, pp. 843-858.
- National Center of Health Statistics, UF Department of Health and Human Services, “Growth Charts. Children 2 to 20 Years (5th-95th Percentile)”, 2000. http://www.cdc.gov/growthcharts/clinical_charts.htm#Set1
- A. Chávez and M. Chávez, “La Nueva Alimentación,” Editorial Pax, México, 1998.
- J. Rivera-Dommarco, T. Shamah-Levy, S. VillalpandoHernández, T. González de Cossío, B. Hernández-Prado B. and J. Sepúlveda, “Encuesta Nacional de Nutrición 1999. Estado Nutricio de Niños y Mujeres en México,” Instituto Nacional de Salud Pública Cuernavaca, Morelos, México, 2001.
- Ministry of Health, “Norma Oficial Mexicana NOM- 042-SSA2-2005, Servicio Básicos de Salud. Promoción Para la Salud en Materia Alimentaria. Crite-rios Para Brindar Orientación,” Diario Oficial de la Federación, 2006, pp. 32-49.
- L. Douglas, “Children’s Food Choice,” Nutrition & Food Science, Vol. 98, No. 1, 1998, pp. 14-18. doi:10.1108/00346659810196273
- E. Romero, O. Campollo, J. F. Castro, R. Cruz and E. Vázquez, “Hábitos de Alimentación e Ingestión de Calorías en un Grupo de Niños y Adolescentes Obesos,” Boletín Médico del Hospital Infantil de México, Vol. 6, No. 3, 2006, pp. 187-194.
- J. Aranceta, C. Pérez, L. Ribas and L. Serra, “EpideMiología y Factores Determinantes de la Obesidad Infan-til y Juvenil en España,” Revista Pediatría de Aten-ción Primaria, Vol. 7, Suppl. 1, 2005, pp. 13-20. http://www.aepap.org/pdf/obesidad_epidemiologia.pdf
- M. Bacardí-Gascón, A. Jiménez-Cruz, E. Jones and V. Guzmán-González, “Alta Prevalencia de Obesidad y Obesidad Abdominal en Niños Escolares Entre 6 y 12 Años de Edad,” Boletín Médico del Hospital Infantil de México, Vol. 64, No. 6, 2007, pp. 362-369.