Food and Nutrition Sciences
Vol. 2 No. 6 (2011) , Article ID: 6608 , 10 pages DOI:10.4236/fns.2011.26074
Nutritional Status and Physical Activities among Army Trainees in Public Institutions of Higher Education in Malaysia
![]()
1Food Science Program, School of Chemical Sciences and Food Technology, Faculty of Science and Technology, Universiti Kebangsaan Malaysia, Bangi, Malaysia; 2Department of Computer Science, Faculty of Science and Defense Technology, Universiti Pertahanan Nasional Malaysia, Kem Sungai Besi, Kuala Lumpur, Malaysia.
Email: wawm@ukm.my
Received January 24th, 2011; revised March 25th, 2011; accepted April 5th, 2011.
Keywords: Anthropometry, Energy, Military training, Nutritional status, Physical activities
ABSTRACT
This study was conducted to evaluate the nutritional status and physical activities of university students that enrolled in military training with the age range of 20 - 34 years. Nutritional status assessment was based on eating habit questionnaires, anthropometric measurements with body mass index (BMI) and waist-to-hip ratio (WHR), food intake records for three days and also food frequency questionnaire (FFQ). Assessment of physical activities was carried out using physical activities records. Food intake and physical activities data were analyzed using the Nutri-Antro Web (NAW) software. Generally, the subjects were found to have good nutrition knowledge and food intake habits, except for having an irregular meal time (85.0%). Based on BMI studies, 80.0% of male subjects and 78.6% of female subjects were within normal range with the average of 22.94 ± 2.97 kg/m2 and 21.40 ± 3.06 kg/m2 respectively. None of the subjects had WHR above the cut-off point of 1.0 for men and 0.85 for women. The average energy intake for male and female was 2589 ± 687 kcal and 1959 ± 460 kcal respectively. Overall, nutrient intake of both genders fulfilled Malaysia Recommended Nutrient Intake 2005 (RNI) except for the average energy intake of the female subjects. The daily physiccal activities patterns revealed that 73.6% was used for light activities, 19.7% for moderate while 7.4% for heavy activities. The average daily energy expenditure for male subjects (3161 ± 444 kcal) was higher than the female subjects (2492 ± 388 kcal). Both male and female subjects have negative energy balance of −572 kcal and −533 kcal respecttively. Majority of the subjects were categorized as physically active (77.9%). Pearson correlation test showed that physical activities were positively correlated (p < 0.05) with BMI, WHR and nutrient intakes except for the intake of vitamin C. In conclusion, nutritional status and physical activity level of subjects were satisfactory.
1. Introduction
Determination of nutritional status and energy expenditure from physical activities is an important aspect in food requirement assessment. Balanced food intake is essential to maintain good health [1]. According to Brown et al. [2], growth and maturity of a person will complete in early adulthood if a balanced diet and healthy lifestyle are adopted. Those who are in between 19 to 26 years of age are those who are entering the age group which are vulnerable to chronic diseases. Therefore, the emphasis on food intake is necessary to maintain physical status, building of body strength and also to prevent excessive weight gain.
Previous studies showed that surrounding factors influences university student’s lifestyle, which causes some of the students to face overweight and obesity issues at the young adult age [3]. The university environment is the best training medium for students who are in the young adult age group, so that they can adopt a healthy lifestyle on an ongoing basis. University students are always facing stress in various aspects, such as pressure due to personal, family, social and also financial problems. For students who are active, especially those who are involved in military training, they should be able to handle these problems together with the many challenges in their academic. All these problems and challenges influence the eating habit and their health status, and this indirectly, can have negative effects on their academic performance [4].
Sports activities and regular exercise are healthy lifestyle that can influence the food intake habit of an individual. According to Calle and Kaaks [5], sports and exercise has many advantages, and one of them is the reduction of risk for various diseases. Physical activities are beneficial, especially to university students. Physical activities can increase the fitness of the body and the well-being of the brain.
The relationship between energy expenditure from physical activities and energy intake from food has become an important research area over these few decades [6]. This shows that it is relevant to investigate whether there is correlation between the effects of different types of physical activities and food intake [7]. Thus, a longterm assessment on the food intake and physical activities patterns is essential [8]. Therefore, research on the lifestyle of university students who are active in uniformed bodies, such as military training, is very important to give a hint on the nutritional status, time and energy usage during their physical activities.
In this research, nutritional status, time and energy expenditure of university students who are active in military training uniformed bodies were assessed. At the same time, the correlation between the nutritional status and physical activities of these students were determined.
2. Methods
2.1. Participants
This study involved a simple random sampling technique to assess nutritional status and energy expenditure of physical activities among military trainees. The participants are university students from Universiti Pertahanan Nasional Malaysia (UPNM), Sungai Besi, Kuala Lumpur and Universiti Kebangsaan Malaysia (UKM), Bangi, Selangor, which were enrolled in a military training module.
Sample size was determined using the formula by Daniel [9] as follows:

where, n = sample size.
Z = Z-value at confidence interval of 95.0% which is 1.96.
P = percentage of the adult population that is expected in this study, which is 17.7%, [10].
d = persistence, which was set at 10% [11].
The minimum sample size calculated for this study was 56 subjects. However, 140 subjects, where 70 were from UPNM, while the other 70 from UKM, were selected. Out of the 70 from each university, 35 were male, while another 35 were female. Higher number of subjects were chosen to ensure sufficient data were obtained for more accurate and precise results. There were a few criteria for the selection of subjects, which were, the subject must be enrolled in military training in the age group of 19 to 29 years old; not married; does not suffer from mental problem or any chronic or dangerous diseases; and the subjects must agree to take part in this study voluntarily.
The subjects were subjected to questionnaire on demographic and socioeconomic status before the assessment of nutritional and physical activity status. The questionnaire consists of four main parts, where, Part A was regarding the subject’s background; Part B for the food eating habit and practice; Part C for health status; and Part D for physical activity patterns of the subject.
2.2. Nutritional Status Assessment
2.2.1. Anthropometry Measurements
The anthropometry measurement done was measurement of weight and height, using the digital SECA weighing scale and SECA height measuring scale, both to the nearest 0.1 kg and 0.1 cm respectively, to get the BMI [12]. The circumference of waist, at the smallest part between the last rib bone and the iliac crest, where the abdomen needs to be at resting state, and the circumference of the hip, at the biggest part between the iliac crest and crotch, both to the nearest 0.1 cm, was taken to calculate the waist to hip ratio (WHR) [13]. The cut-off points of WHR which determines the risk of getting cardiovascular disease are 1.0 for male and 0.85 for female [12].
2.2.2. Food Intake Record
The food intake record was done to assess the nutrient intake of the subject. The subjects were required to record their food intake for two weekdays, and one weekend, which represent an accurate dietary habit of the subjects [1]. The records, starting from breakfast to supper, include the name of serving dishes (including drinks), as well as a detailed description and the size of the meal taken. Household units such as a cup, a spoonful and a plate, was used as measuring units.
The food intake record was analysed using the Nutri AntroWeb software [14] to determine the nutrient value consumed by the subject. The serving size was converted into gram unit before entering the values into the software by referring to Atlas Makanan: Saiz Pertukaran dan Porsi [15] and Nutrient Composition of Malaysian Food [16]. The parameters analysed include the energy intake, macronutrient (carbohydrate, protein and fat) and micronutrient (calcium, iron, vitamin A, thiamine, riboflavin, niasin and vitamin C). The Recommended Nutrient Intake of Malaysia (RNI) [17] was used to determine the level of nutrient requirement of the subjects.
The energy intake to basal metabolic rate ratio (EI: BMR) was assessed to determine the occurrence of bias, i.e., under-report or over-report, if the value was less than 1.30 or exceeds 2.64 respectively [18]. The BMR value was determined using the formula given by FAO/WHO/ UNU [19].
2.2.3. Food Frequency Questionnaire (FFQ)
Food frequency questionnaire (FFQ) was done to provide further information about the types of food consumed by the subjects and to give an overview of their dietary patterns within the previous month [20]. Subjects were questioned about the type and frequency of the food normally taken in a month. The type of food was categorised into high carbohydrate food; high protein food; high fat food; fast food; high vitamins and minerals food such as fruits, vegetables and beverages. Table 1 shows the frequency of food intake classification [21]:
The formula from Rearburn et al. [22] with modification was used to calculate the score for each of the type of food:
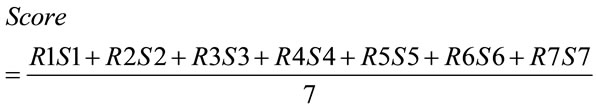
where, S1 to S7 = score.
R1 to R7 = percentage of subject who chooses the score.
2.3. Physical Activity Assessment
Physical Activity Record
Subjects were required to fill a form for physical activi-
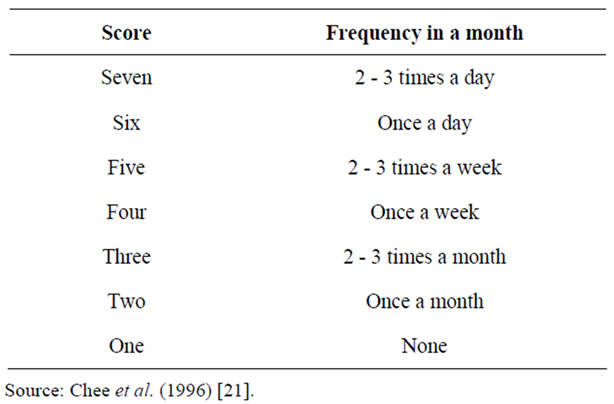
Table 1. Classification of food intake frequency.
ties which were carried out in 24 hours for three days, which were the same days of the food intake record. Daily energy expenditure was calculated by multiplying the metabolic cost (kcal/min) for a specific physical activity with time (minutes) used for that particular activity, where some of the metabolic cost needs to be modified according to the weight of the subject [23,24]. There were a total of 33 activities done by the subjects, and these activities were classified into six categories, which were sleep or lying down, sitting, standing and walking, personal activities, general activities, and vigorous activities including military training activities [24].
The physical activity level (PAL) was calculated by dividing the total energy expenditure (TEE) with basal metabolic rate (BMR). The physical activity level of the subjects were determined according to FAO/WHO/UNU [25], where physical activity level was divided into three categories, which are sedentary (1.45), moderately active (1.75) and active (2.05).
2.4. Statistical Analysis
Data from food intake and fizikal activities record were analysed using the Nutri-AntroWeb [14]. The data of food intake was compared with the RNI [17]. The Statistical Package for Social Sciences (SPSS) version 16.0 software was used for the statistical analysis [26]. Independent t-test was done to determine if there were significant differences in the average BMI, WHR, nutrient intake and the energy expenditure between male and female subjects.
Pearson Correlations Test (r-value) was used to examine the relationship between parameters, namely anthropometry measurement and nutrient intake with physical activities. A two-tailed p-value of less than 0.05 was regarded as having a significant relationship. Besides that, descriptive statistical analysis was done to determine the mean, standard deviation, frequency and the percentage for data interpretation.
3. Results and Discussions
3.1. Subject Demography
As shown in Table 2, a total of 140 subjects were involved in this research, in which there were equal number of male and female subjects. The age of the subjects ranges from 20 to 24, where 92.1% were Malays, 3.6% Chinese, and 2.9% and 1.4% were Indians and other races respectively. It was found that majority of the subjects (37.9%) spend RM5 – RM9 daily for food, in which 63.6% stated that their main financial source were from their scholarships.
From the questionnaire on food eating habit and practice, it was found that 92.1% of the subjects have good
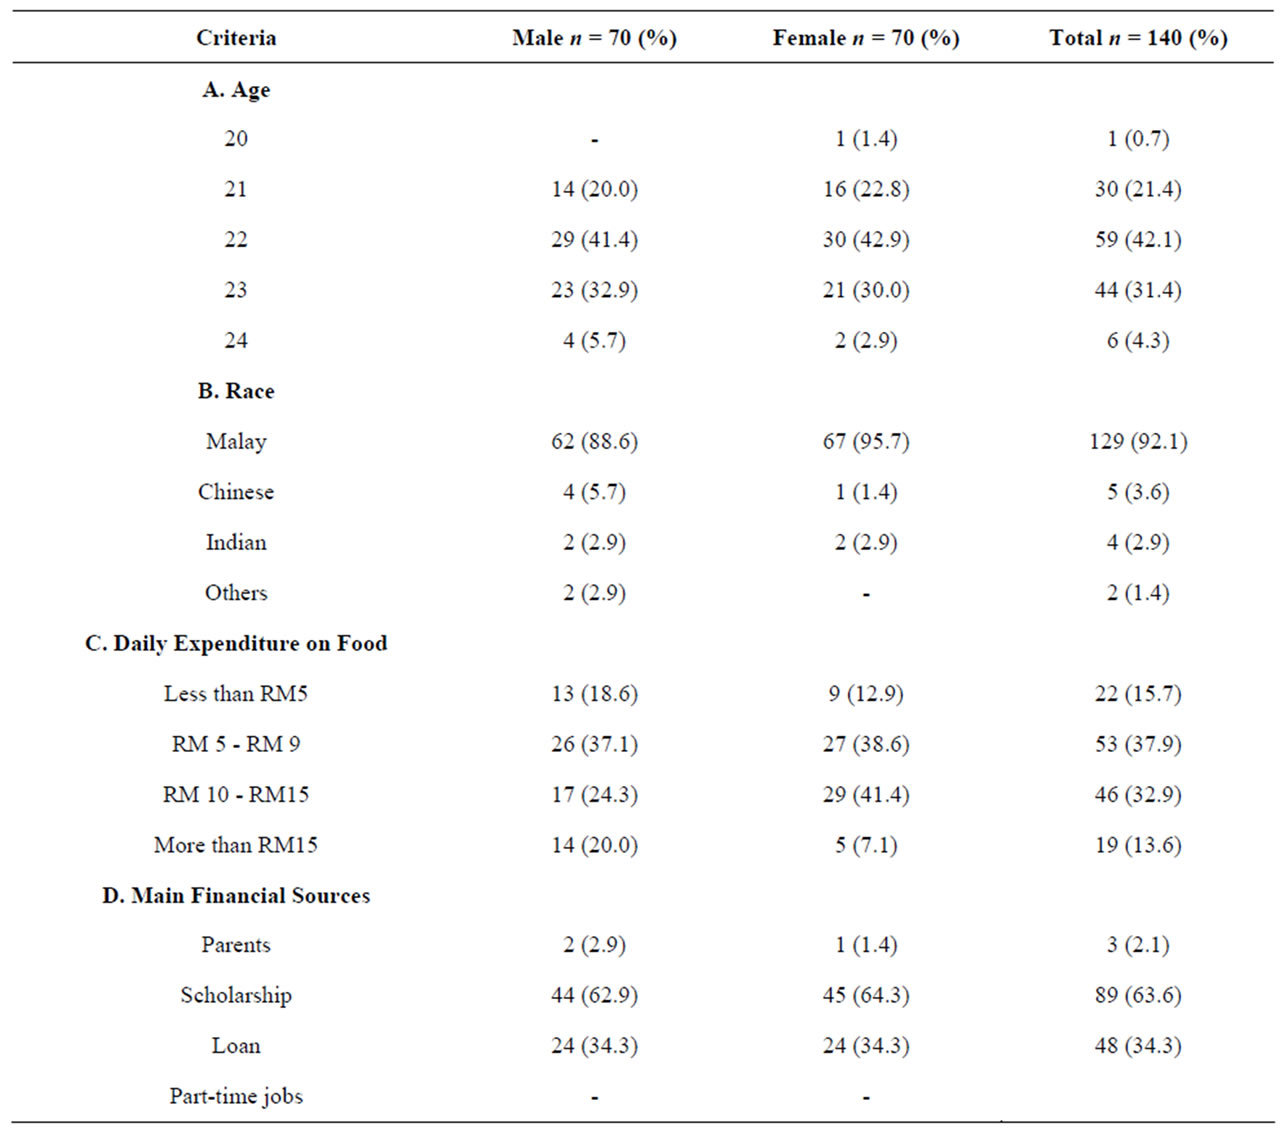
Table 2. Demographic and socioeconomic data of the subjects (n = 140).
knowledge about nutrition, where most of them get the information from the mass media (57.5%). However, there is a worrying 85.0% of the subjects that have irregular eating time, mostly due to too many outdoor activities, including military training activities (40.0%), and the uncertainties of lectures hours (32.0%).
3.2. Nutritional Status Assessments
3.2.1. Anthropometry Assessment
BMI is an important indicator of nutritional status in adults [12]. According to Ismail et al. [23], the Malaysian Army have a BMI range of 19.8 - 24.9 kg/m2. Based on Table 3, the overall average BMI of the subjects is 22.2 ± 3.1 kg/m2, which is at the normal range, with a significant difference in BMI between male and female subjects at p < 0.05. The majority of the subjects (79.3%) have a normal BMI. However, 11.4% of female subjects were found to be underweight. There were 10.7% of the subjects who were in the range of pre-obese (14.3% male, and 7.1% female), while a total of 3.6% of the subjects were obese.
Generally, most of the subjects have normal BMI due to the fact that they were all undergoing military training, where they were subjected to vigorous physical activities. However, it was found through interviews with those who were overweight, the addition of weight normally occurs during examination periods as there will be less training, thus less physical activities, but with the same amount of food intake. This causes the imbalance in energy, as the energy intake will be higher than the energy expenditure, thus causing the increase in weight.
For the WHR, the overall average of the subjects have a WHR of 0.8 ± 0.0, where the male subjects have WHR ranging from 0.7 - 0.9, and 0.7 - 0.8 for that of the female subjects. It was found that 100% of the subjects were not at risk of cardiovascular diseases, as the readings were below the cut-off point of 1.0 for male and 0.85 for female. The WHR of the male and female subjects were
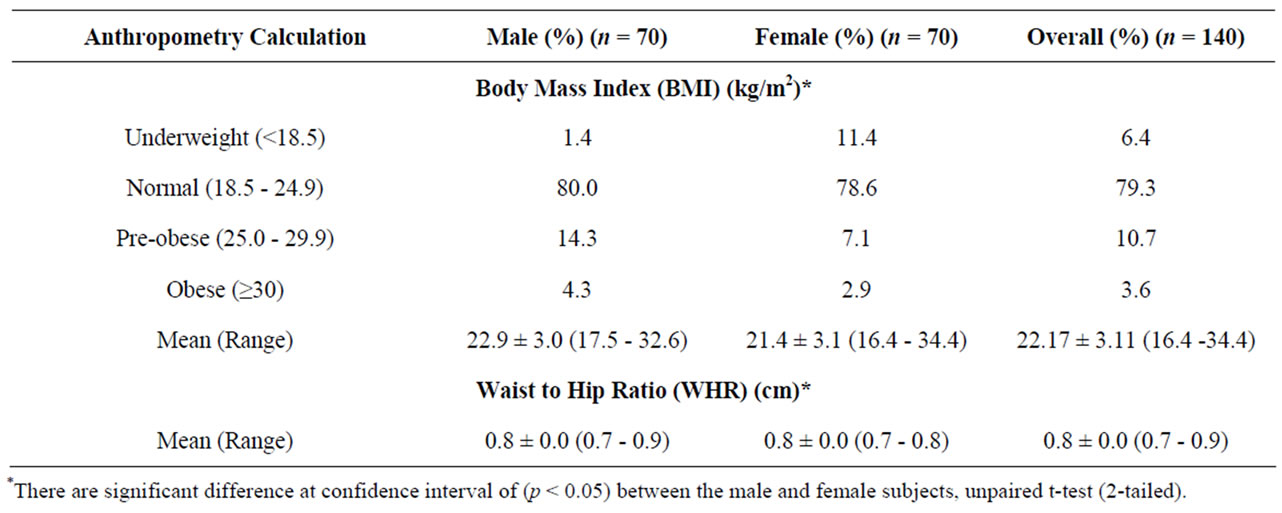
Table 3. Anthropometry calculation according to gender.
found to be significantly different at p < 0.05. According to Ismail et al. [23], continuous physical activities can change the body composition of an individual. This explains why all the subjects have a healthy WHR, as they were all physically active in military trainings.
3.2.2. Nutrient and Energy Intake
The nutrient and energy intake of the subjects were calculated from the food record intake, and was compared with the Malaysian RNI [17]. As shown in Table 4, the standard deviations of the values were very big, due to the very different food intake habits among the subjects. According to Mahan and Stump [1], a healthy individual requires energy for metabolic processes, physical activities, growth and the regulation of body temperature. Based on Table 4, the energy intake and macronutrient intake shows significant difference between the two genders at p < 0.05.
The Malaysian RNI [17] recommends the daily energy intake of 2440 kcal for male and 2000 kcal for female at the age cohort of 19 - 29 years old. This study shows that the male subjects have adequate average energy intake at 2589 ± 687 kcal, but the female subjects only have a average daily intake of 1959 ± 460 kcal, which is slightly lower than the RNI requirement. Out of the 70 male and 70 female subjects, 64.3% and 51.4% fulfil the RNI [17] requirement respectively. This explains that there were some subjects that have unhealthy eating patterns and have inadequate energy intake for daily use. The inadequacy of energy intake was more prevalence in female subjects, as generally, female are more concerned about their weight, thus reducing the quantity of rice intake. At the same time, the food served at the university’s cafeteria or its surrounding stalls are similar everyday, thus reducing the choices available and affecting the appetite of the subjects.
The EI: BMR ratio is a method used to identify error in reporting energy intake of an individual or a group [18]. In this study, the average EI:BMR ratios were 1.55 for male subjects and 1.54 for female subjects, where 70% of the subjects reported their energy intake accurately, while 27.9% and 2.1% under and over report their energy intake respectively.
Carbohydrate intake is very important in the diet because carbohydrates accounted for most of the energy needed to move and to do daily work/chores [1]. From the Food Frequency Questionnaire (FFQ), the carbohydrate sources with the highest scores were rice (96.0%), white bread (69.2%), noodles (67.9%) and biscuits (65.8%). Fat is the second source of energy for the subjects in this research. The body needs fat to provide energy where fat is found to provide the highest form of energy in the body [27]. Based on the FFQ, the fat source with the highest score from the subjects were sweetened condensed milk (59.0%), margarine (44.1%) and peanut butter (43.5%). Fried food and curry are also main fat sources.
Protein on the other hand, has lower contribution to the calorie, but it is important to provide essential amino acid and also to synthesis and maintain tissues (muscles, bones and teeth) [28]. It was found that 85.7% of male subjects and 54.0% of female subjects fulfil the RNI [17] recommendations for protein intake. Both male and female average protein intake was well above the RNI [17] recommendation, at 145.6% and 130.3% respectively. This is important as the subjects go through vigorous activity during their military training. According to the FFQ, chicken is the main source of protein, with the score of 78.1%, followed by egg (72.5%) and meat (64.0%).
Micronutrients, which consist of minerals and vitamins, are very important for optimum growth and health maintenance. Insufficient intake of micronutrients may disrupt

Table 4. Average intake of energy, macronutrient and micronutrient intake according to gender (n = 140).
cell and physiology function of the body [28]. As shown in Table 4, aside from calcium, vitamin A and vitamin C, all the other micronutrients (iron, thiamine, riboflavin and niacin) intake between genders were significantly different at p < 0.05. The average micronutrients intake of the subjects surpass the RNI [17] recommendations.
According to the FFQ, the frequency score for eggs, which is a good source of vitamin A, was quite high at 72.5%. Carrot (56.0%), tomato (56.1%) and papaya (52.5%) are also good source of vitamin A. This ensures that the vitamin A intake is above the RNI [17] recommendation. The FFQ shows that the frequent consumption of grains such as rice (96.0%), eggs (72.5%), chicken meat (78.1%) and meat (64.0%) ensures that there were sufficient intake of thiamine, a vitamin of vitamin B complex. Same goes for riboflavin intake, also a type of vitamin B, which was above the RNI [17] recommendation due to the high intake of milk (UHT milk –46.5%; full cream milk –44.6%; and low fat milk –44.4%), eggs (72.5%) and green vegetables (73.9%). The main contribution of vitamin C was from orange, which scores the highest in the FFQ for fruits, at 64.4%.
Calcium intake of the subjects were also well above the RNI [17] recommendation. According to the FFQ, the intake of milk was quite frequent (UHT milk –46.5%; full cream milk –44.6%; and low fat milk –44.4%), in which milk is a good source of calcium. Calcium from milk sources are easier absorbed by our body compared to calcium from other sources, such as legumes and green vegetables [27]. The subjects also have sufficient intake of ferum, which surpass the RNI [17] recommenddation. This is due to the adequate intake of protein, in which high protein food are good sources of ferum.
3.3. Physical Status Assessments
3.3.1. Energy Expenditure Assessment
According to Table 5, the average energy expenditure were divided into six categories, namely, sleep or lying down (28.6%), sit (28.9%), stand or walk (19.5%), personal activities (14.3%), general activities (2.0%) and vigorous activities (6.9%). It was found that there were significant difference of energy expenditure between genders for general activities and vigorous activities at p < 0.05. The general activities consists of cleaning room, washing and ironing clothes, washing dishes, sweeping, cleaning shoes, sweeping and mopping floor, while vigorous activities include jogging, playing football, marching, physical training, polishing shoes, shooting, cleaning
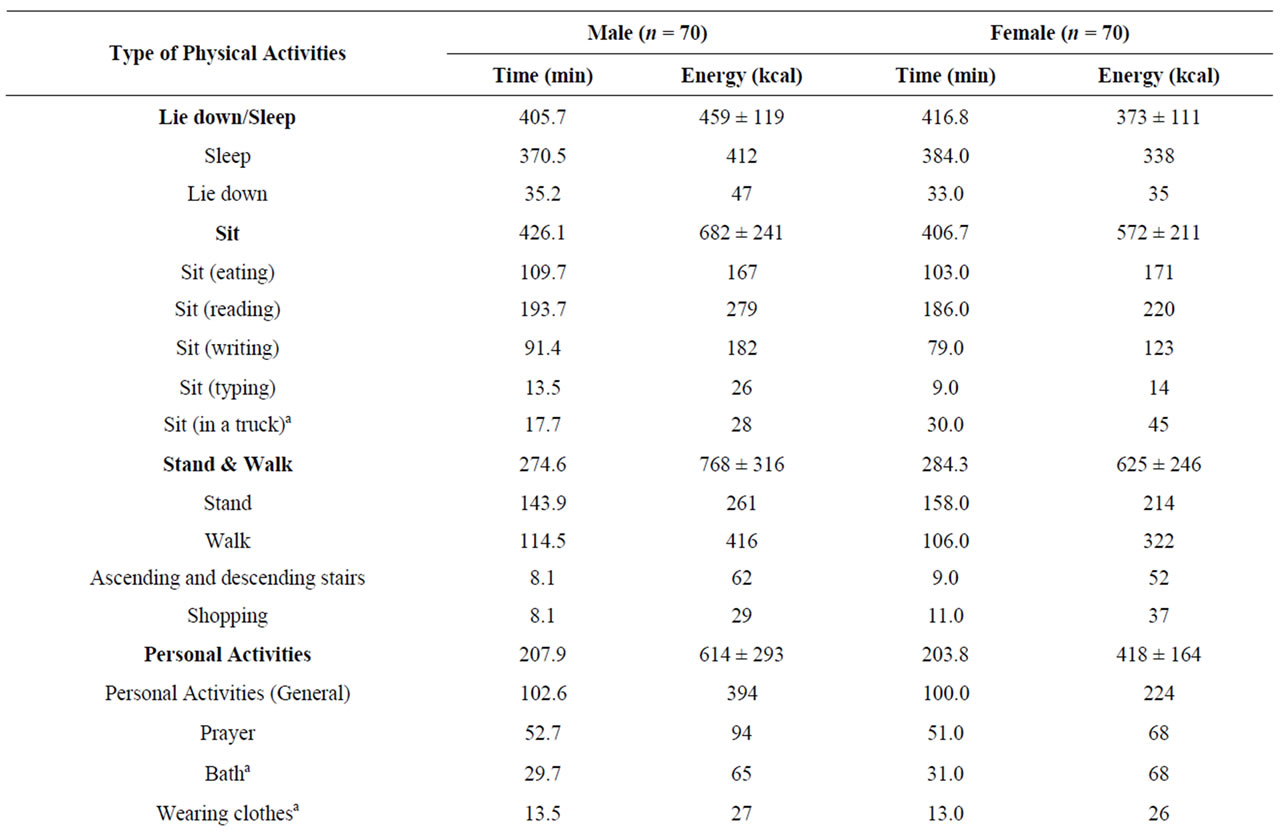

Table 5. Average energy expenditure (kcal) of physical activity patterns of the subjects (n = 140).
arms/guns and walking with arms/guns.
The energy expenditure for female subjects in general activities was significantly higher than that of the male subjects at p < 0.05. This shows that female subjects spend more time in maintaining cleanliness compared to that of the male subjects. The opposite occur for the vigorous activities, where male subjects have higher energy expenditure compared to their female counterparts. It is evident that the male subjects spend more time in these activities compared to that of the female subjects. As for the average total energy expenditure for physical activities, it was found that the male subjects requires significantly more energy compared to the female subject at p < 0.05. The average total energy expenditure for physical activities for male subjects was 3161 ± 444 kcal/day, while 2492 ± 388 kcal/day for that of the female subjects.
3.3.2. Energy Balance and Physical Activity Level
Upon comparing the energy intake and energy expenditure, it was found that the male and female subjects registered a negative energy balance of 572 kcal and 533 kcal respectively. The existence of a negative energy balance among the subjects was due to the fact that the energy expenditure exceeds the energy intake. According to a study in Ismail et al. [23], the average energy balance of the Malaysian Army was found to be negative 700 kcal. It was found that 70.7% of the subjects had a daily negative energy balance, while the remaining 29.3% of the subjects registered a positive energy balance.
According to the classification of FAO/WHO/UNU [25] for the physical activity level (PAL), majority of the subjects (77.9%) were categorised as active in physical activities, while 20.7% and 1.4% of the subjects were moderately active and sedentary respectively, as shown in Table 6. A study in Huang et al. [29] found that 71.0% of college students have active and moderately active daily physical activities, while the remaining 29.0% were low in physical activities. However, a study by the Ministry of Health Malaysia [10] found that 89.1% of Malaysian adults were classified in the category of low levels of activities, while only 10.3% and 0.4% were found to be moderately active and active respectively. This shows that the physical activity patterns of our subjects, which undergo military training, are at good levels.
3.3.3. Correlation between Physical Activities and Nutritional Status
According to Table 7, the Pearson correlation test analysis on the overall of the subjects shows that there were significant and positive correlations between physical activities with nutrient intake, BMI and WHR, except for the vitamin C intake. In general, the results explain that when the subjects increase their physical activities, there will be tendency to increase their food intake. The increase in physical activities influence the intake of macronutrients, which are the main sources energy. Vigorous activities in a short period of time do not have the same effect on food intake as exercise or vigorous activities in a longer period of time. In addition, higher daily physical activities not only increase the energy intake, but also increase the intake of micronutrients [30].
The Pearson correlation test also shows that there were significant and positive correlation between energy expenditure from physical activities and the BMI and WHR. Subjects with high physical activities, tends to have high BMI and WHR. The higher body weight obtained, and thus higher BMI, was likely due to the increase in lean body mass. Vigorous training is effective in increasing muscle mass and strength of an individual [31]. Longterm exercise training for individuals who undertake vigorous exercise will result in increasing lean body (muscle) [32].
4. Conclusions
From this research, it can be concluded that the nutriational status of the subjects (military trainees) were generally in a good level. The majority of the subjects were also categorised as active in physical activities. Finally, it was found that there were significant and positive correlation between physical activities, BMI and WHR, except for vitamin C intake. The military has some concern that after graduation and job posting, many of the trainees who are now army personnel gain weight which was an
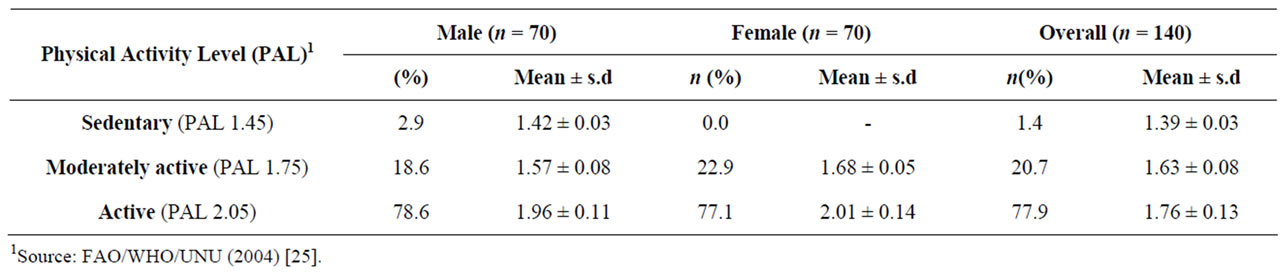
Table 6. Distribution of subjects according to physical activity levels (n = 140).
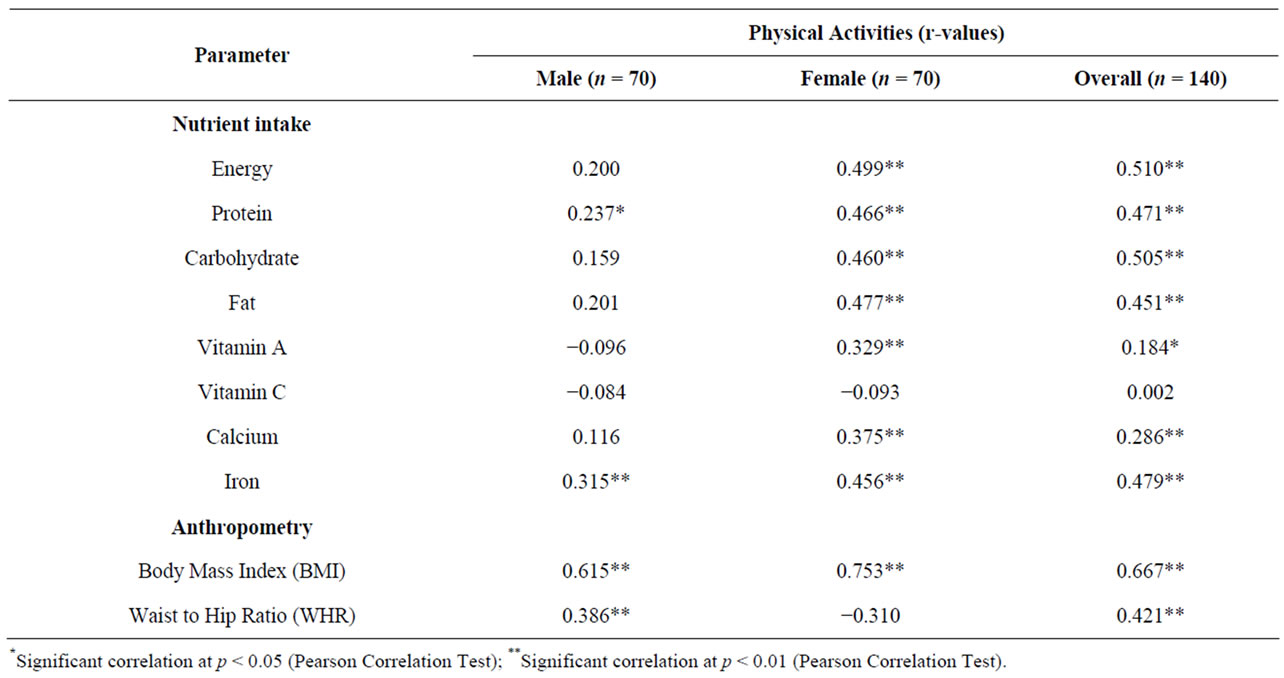
Table 7. The relationship between physical activities and nutritional status (n = 140).
issue of concern to the military. Weight gain can reduce physical fitness status whilst maintenance of physical fitness is crucial in this line of job. This study which is first of its kind will provide baseline information to proceed further on follow-up study of the trainees after 6 and 12 month period at their respective work place. We are currently pursuing this follow-up study.
REFERENCES
- L. K. Mahan and S. Escott-Stump, “Krause’s Food & Nutrition Therapy-Assessment: Dietary and Clinical Data,” 12th Edition, Saunders Elsevier, St. Louis, 2008.
- L. B. Brown, R. Stewart and D. L. Eggett, “Environmental Correlates with College Students Food and MicroNutrient Intake Suggest a Focus for Future Nutrition Education,” Journal of Nutrition Education and Behavior, vol. 39, No. 4, 2007, pp. 121-122. doi:10.1016/j.jneb.2007.04.334
- S. B. Racette, S. S. Deusinger, M. J. Strube, G. R. Hinghstein and R. H. Deusinger, “Weight Changes, Exercise and Dietary Pattern Freshman and Sophomore Years of College,” Journal of American College Health, vol. 53, no. 6, 2005, pp. 245-251. doi:10.3200/JACH.53.6.245-251
- G. L. Khor, L. Cobiac and G. Skrzypiec, “Gender Differences in Eating Behavior and Social Self Concept among Malaysian University Students,” Malaysian Journal of Nutrition, vol. 8, no. 1, 2002, pp. 75-98.
- E. E. Calle and R. Kaaks, “Overweight, Obesity and Cancer Epidemiological Evidence and Proposed Mechanism,” Nutrition Review Cancer, Vol. 4, 2004, pp. 579-591. doi:10.1038/nrc1408
- J. Blundell, R. Stubbs, D. Hughes, S. Whybrows and N. King, “Cross Talk between Physical Activity and Appetite Control: Does Physical Activity Stimulate Appetite?” Procedures Nutrional Society, vol. 62, No. 3, 2003, pp. 651-661. doi:10.1079/PNS2003286
- C. Lopes, A. Aro, A. Azevedo, E. Ramos and H. Barros, “Dietary Intake and Different Types of Physical Activity: Full-Day Energy Expenditure, Occupational and LeisureTime,” Journal American Diet Association, vol. 107, No. 2, 2007, pp. 276-286. doi:10.1016/j.jada.2006.11.008
- D. Janalee, “The Influence of an Internet-Delivered Physical Activity Intervention on Food Intake in Previously Sedentary and Overweight Adults,” PhD Dissertation, University of Wyoming, Laramie, 2008.
- W. W. Daniel, “Biostatisitcs: A foundation for Analysis in the Health Sciences,” 7th Edition, John Wiley & Sons, New York, 1999.
- MOH (Ministry of Health Malaysia), “The Malaysian Adult Nutrition Survey (MANS). Findings Report 2003,” MOH, Nutrition Section Family Health Development Division, Putrajaya, 2007.
- K. Mirnalini, M. S. Zalilah, M. Y. Safiah, A. Tahir, M. D. Siti Haslinda, D. Siti Rohana, M. Y. Khairul Zarina, S. Mohd Hasyami and H. Normah, “Energy and Nutrient Intakes: Findings from the Malaysian Adult Nutrition Survey (MANS),” Malaysian Journal of Nutrition, vol. 14, no. 1, 2008, pp. 1-24.
- WHO (World Health Organization), “Obesity: Preventing and Managing the Global Pandemic. Report of WHO Consultation on Obesity. 3-5 June 1997,” World Health Organization, Geneva, 1998.
- A. H. Harding, N. E. Day, K. T. Kwaw, S. Bingham, R. Luben, A. Welsh and N. J. Wareham, “Dietary Fat and the Risk of Clinical Type 2 Diabetes,” American Journal of Epidemiology, vol. 1, 2004, pp. 159-163.
- A. R. Suriah “Universiti Kebangsaan Malaysia: NutriAntro Web,” 2005. http://pkukmweb.ukm.my./naw/login. php.
- S. Suzana, M. Y. Noor Aini, S. Nik Shanita, G. Rafidah and A. Roslina, “Food Atlas: Conversion and Portion Size,” 2nd Edition, MDC Publishers, Marblehead, 2009.
- E. S. Tee, M. N. Ismail, M. A. Nasir and I. Khatijah, “Nutrient Composition of Malaysian Food,” 4th Edition, Institute for Medical Research Malaysia, Kuala,1997.
- MOH (Ministry of Health Malaysia), “Recommended Nutrient Intakes. A Report of the Technical Working Group on Recommended Nutrient Intake for Malaysia,” Ministry of Health, National Coordinating Committee on Food and Nutrition (NCCFN), Kuala Lumpur, 2005.
- S. Klingberg, E. Hallenberg, M. Lorentzon, D. Mellstrom, C. Ohlsson and L. Hulthen, “Characteristics of underand over-Reporters of Energy Intake among 18-20 Years-Old Males: The Gothenburg Osteoporosis and Obesity Determinants (GOOD) Study,” Public Health Nutrition, vol. 11, no. 11, 2008, pp. 1117-1123. doi:10.1017/S1368980007001474
- FAO/WHO/UNU, “Energy and Protein Requirements,” WHO. Tech Rep Ser No. 724, Geneva, 1985.
- T. C. Carithers, S. A. Talegawkar, M. L. Rowser, O. R. Henry, P. M. Dubbert, M. L. Bogle, H. A. Taylor and K. L. Tucker, “Validity and Calibration of Food Frequency Questionnaires Used with African-American Adults in the Jackson Heart Study,” Journal of American Diet Association, vol. 109, no. 7, 2008, pp. 1184-1193. doi:10.1016/j.jada.2009.04.005
- S. S. Chee, H. Zawiah, M. N. Ismail, K. K. Ng, “Anthropometry, Dietary Patterns and Nutrient Intakes of Malaysian Estate Workers,” Malaysian Journal of Nutrition, vol. 2, 1996, pp. 112-126.
- J. A. Rearburn, M. Krondl and D. Lau, “Social Determinants in Food Selection,” Journal of American Dietetic Association, vol. 74, 1979, pp. 637-641.
- M. N. Ismail, M. Isa and A. Janudin, “Energy Requirements of Malaysian Soldiers in a Base Camp,” Malaysian Journal of Nutrition, vol. 2, 1996, pp. 168-174.
- M. Isa, “Energy Requirement of Members of Malaysian Army,” Masters Dissertation, Universiti Kebangsaan Malaysia, Bangi, 1991.
- FAO/WHO/UNU. “Human Energy Requirements: Report of a Joint FAO/WHO/UNU Expert Consultation,” Rome: Food and Agriculture Organization of the United Nations, Food Nutrition Technical Report Series, No. 1, 2004.
- S. J. Coakes, L. Steed and C. Ong, “SPSS Version 16.0 for Windows: Analysis Without Anguish,” John Wiley & Sons Ltd., New York, 2009.
- A. R. Suriah, “Understanding Nutrition,” Dewan Bahasa dan Pustaka, Kuala Lumpur, 2004.
- E. Whitney, S. R. Rolfes, “Understanding Nutrition,” 11th Edition, Thomson Higher Education, Belmont, 2008.
- T. T. K. Huang, K. J. Harris, R. E. Lee, N. Nazir, A. Born and H. Kaur, “Assessing Overweight, Obesity, Diet and Physical Activity in College Students,” Journal of American College Health, vol. 52, no. 2, 2003, pp. 83-86. doi:10.1080/07448480309595728
- K. Melzer, B. Kayser, W. H. M. Saris and C. Pichard, “Effects of Physical Activity on Food Intake,” European Society for Clinical Nutrition and Metabolism, Vol. 24, 2005, pp. 885-895.
- M. E. Nelson, M. A. Flatarone, C. M. Morganti, I. Trice, R. A. Greenberg and W. J. Evans, “Effects of HighIntensity Strength Training on Multiple Risk Factors for Osteoporotic Fractures: A randomized Controlled Trial,” The Journal of the American Medical Association, vol. 272, no. 24, 1994, pp. 1909-1914.
- K. R. Westerterp, “Limits to Sustainable Human Metabolic Rate,” Journal of Experimental Biology, vol. 204, no. 18, 2001, pp. 3183-3187.