Graphene
Vol.2 No.4(2013), Article ID:38727,6 pages DOI:10.4236/graphene.2013.24017
Observation of Electron-Phonon Couplings and Fano Resonances in Epitaxial Bilayer Graphene
1Institute of Electronic Materials Technology, Warsaw, Poland
2Faculty of Physics, University of Warsaw, Warsaw, Poland
3Faculty of Physics and Applied Informatics, Department of Solid State Physics, University of Lodz, Lodz, Poland
4Institute of Physics, M. Curie-Sklodowska University, Lublin, Poland
Email: *kgrod@tlen.pl
Copyright © 2013 Jacek M. Baranowski et al. This is an open access article distributed under the Creative Commons Attribution License, which permits unrestricted use, distribution, and reproduction in any medium, provided the original work is properly cited.
Received July 14, 2013; revised August 20, 2013; accepted October 8, 2013
Keywords: Epitaxial Graphene; Fano Resonance; Phonons
ABSTRACT
The results of optical investigation of hydrogenated epitaxial bilayer graphene are presented. A softening and an increase of the intensity of the in-plane anti-symmetric phonon mode are observed at 0.2 eV. It is suggested that they both originate from coupling of the optically active phonon mode to virtual electronic transitions, which is related to the band structure of bilayer graphene and leads to the “charged phonon” effect. In addition, it is noted that optically active phonon peaks have pronounced Fano shapelines. It is argued that the Fano shapeline is attributed to the interaction of the phonon mode with a continuum of electronic transitions in valence bands of hydrogenated bilayer graphene.
1. Introduction
Electron phonon interaction in graphene has been studied up to now predominantly in freestanding graphene. These studies have been performed in freestanding graphene monolayers [1-5] and in graphene bilayers as well [6-9]. Graphene bilayers were particulary interesting because coupling between free carriers and phonons with different symmetries took place. The zone-center optical phonon mode at 0.2 eV, which gives rise to the Raman G band in a graphene monolayer at around 1580 cm–1, also exhibits strong coupling with electron-hole pairs. For a graphene bilayer, the in-plane optical phonons of the two layers consist of an E2g in-phase symmetric mode and an E2u out-of-phase anti-symmetric mode [6,8,9]. The E2g phonon has even parity and is Raman active (RM), whereas the E2u phonon has odd parity and is infrared active (OM). Because of the π band structure of bilayer graphene, phonons can couple with virtual intra-band electron-hole excitations [8]. In addition, gating of bilayer graphene in an external electric field can modify phonon-light interactions. The external electric field may generate a tunable electronic bandgap and Fano resonances [10,11]. A Fano resonance describes the quantum interference between an optical transition to a discrete state and a continuum of states and it gives rise to characteristic asymmetric lineshapes in absorption spectra [12]. Originally introduced to describe atomic photoionization [12], Fano lineshapes were observed in many systems. In particular, they were recorded in the Raman spectra of a number of graphitic materials such as intercalated graphite [13], fullerene [14] and metallic carbon nanotubes [15]. It was believed that these Fano lineshapes arise from the interference between G phonons and plasmons or a multi-phonon continuum. The Fano lineshape was also observed in infrared spectroscopy in pristine graphite [16] and few-layer graphene [17]. The most pronounced Fano lineshapes were detected in absorption due to the phonon G peak in gated graphene bilayer structures [10,11]. In particular, the peak observed in the infrared showed a strong dependence on the intensity and the Fano type asymmetry as a function of the applied gate voltage. These features were attributed to a charged phonon effect for the anti-symmetric mode [11] or to the emergence of a Fano lineshape for the symmetric mode, whose activity was triggered by the electric field between two carbon layers [10]. In these cases, it was claimed that the Fano lineshape originated from coupling of the phonon mode to electronic transitions between the lowest hole and electron bands of a graphene bilayer. The presented in this work results are the first ones for the epitaxial bilayer graphene grown on SiC(0001).
2. Experimental
The majority of optical studies of graphene were performed by Raman spectroscopy. On the other hand, infrared techniques can provide complementary information. Nevertheless, due to different selection rules, they often remain unexplored. In this work we concentrate on optical measurements, and we present infrared spectra of hydrogenated epitaxially grown bilayer graphene on 4HSiC(0001) obtained by Fourier transform infrared (FTIR) spectroscopy using the infrared reflectance absorption mode (IRRAS) and the attenuated total reflection (ATR) mode. Reflectivity spectra were taken at an angle of IR light incidence of 11˚ with a spectral resolution of 2 cm−1. FTIR-ATR measurements were carried out with the sample mounted face down on a single reflection Ge crystal with pand s-polarized IR lights. The spectral resolution was 1 cm−1. All measurements were taken at room temperature using a Bruker Vertex 80 v FTIR spectrometer. Raman maps were performed using a Renishaw inVia Raman Microscope. A 532 nm Nd:YAG laser was used as a source of excitation. Our optical measurements were carried out for non-gated bilayer graphene and therefore, thus, our results differ from the ones published before. For four samples, graphene layers were grown by the CVD method at 1600˚C [18] and for one sample (sample 1275) by the Si sublimation method at 1600˚C under argon pressure. In both growth methods, semi-insulating on-axis 4H-SiC(0001) have been used. The intercalation of hydrogen under a buffer layer was performed at a relatively high temperature in the 1000˚C - 1100˚C range. Hydrogenated samples were cooled down in an argon and hydrogen atmosphere. In addition one n-type bilayer graphene sample for comparison was measured as well (sample 1637).
3. Experimental Results
It is known that at a high temperature carbon atoms rearrange and first form a carbon buffer layer at the interface and then graphene layers on top [19]. The buffer layer is comprised of carbon atoms that are covalently bonded to the underlying SiC substrate and therefore, it does not show graphitic electronic properties [19]. Conversion of the carbon buffer layer into graphene layer can be achieved by hydrogen intercalation [20,21]. The presence of hydrogen was revealed by FTIR-ATR measurements performed over the range of H-Si vibrations close to 2130 cm−1. Figure 1 presents the results of FTIR-ATR measurements for both p and s polarization in the case of one of the samples. A 2128 cm−1 line is observed in ppolarization and is absent in s-polarization. This proves that the SiC(0001) surface under graphene layers is saturated with hydrogen. The absence of a signal in s-polarization indicates that the H-Si bonds are perpendicular to the SiC(0001) surface. The presented results are similar to the ones obtained for hydrogenated epitaxial graphene grown on 6H-SiC(0001) [22]. The H-Si line has the same intensity for all measured samples, which indicates that the degree of their hydrogenation is also identical. In addition, electrical measurements confirm successful hydrogenation. The van der Pauw measurements show that all hydrogen-intercalated samples are p type, with hole concentration ranging between 1.3 × 1013 cm−2 and 2 × 1013 cm−2 and mobility between 2150 cm2/Vs and 2700 cm2/Vs. The non hydrogenated sample is n type with electron concentration of about 2.9 × 1012 cm−2 and mobility 470 cm2/Vs.
Angle Resolved Photoelectron Spectroscopy (ARPES) confirmed the presence of bilayer graphene as well as the position of the Dirac point relative to the Fermi level. All ARPES measurements were performed in ultra high vacuum conditions with a base pressure of 2 × 10⁻¹⁰ mbar. A high brightness helium lamp (HeI) and a high resolution hemispherical analyzer (Phoibos 150) with a two dimensional electron detector were used. The energy and angular resolutions were set to 30 meV and 0.3˚, respectively. Before measurements, graphene samples underwent mild annealing at about 440 K for half an hour in vacuum in the low 10−10 mbar range. The measurements were performed at 130 K. The exemplary results of ARPES measurements shown in Figure 2 confirm that the measured samples are graphene bilayers with the Fermi level inside of the bilayer graphene valence band. The valence band structure observed in ARPES is in full agreement with the known energy bands for graphene bilayers which consist of two concentric hyperbola offsets by the interlayer coupling energy of
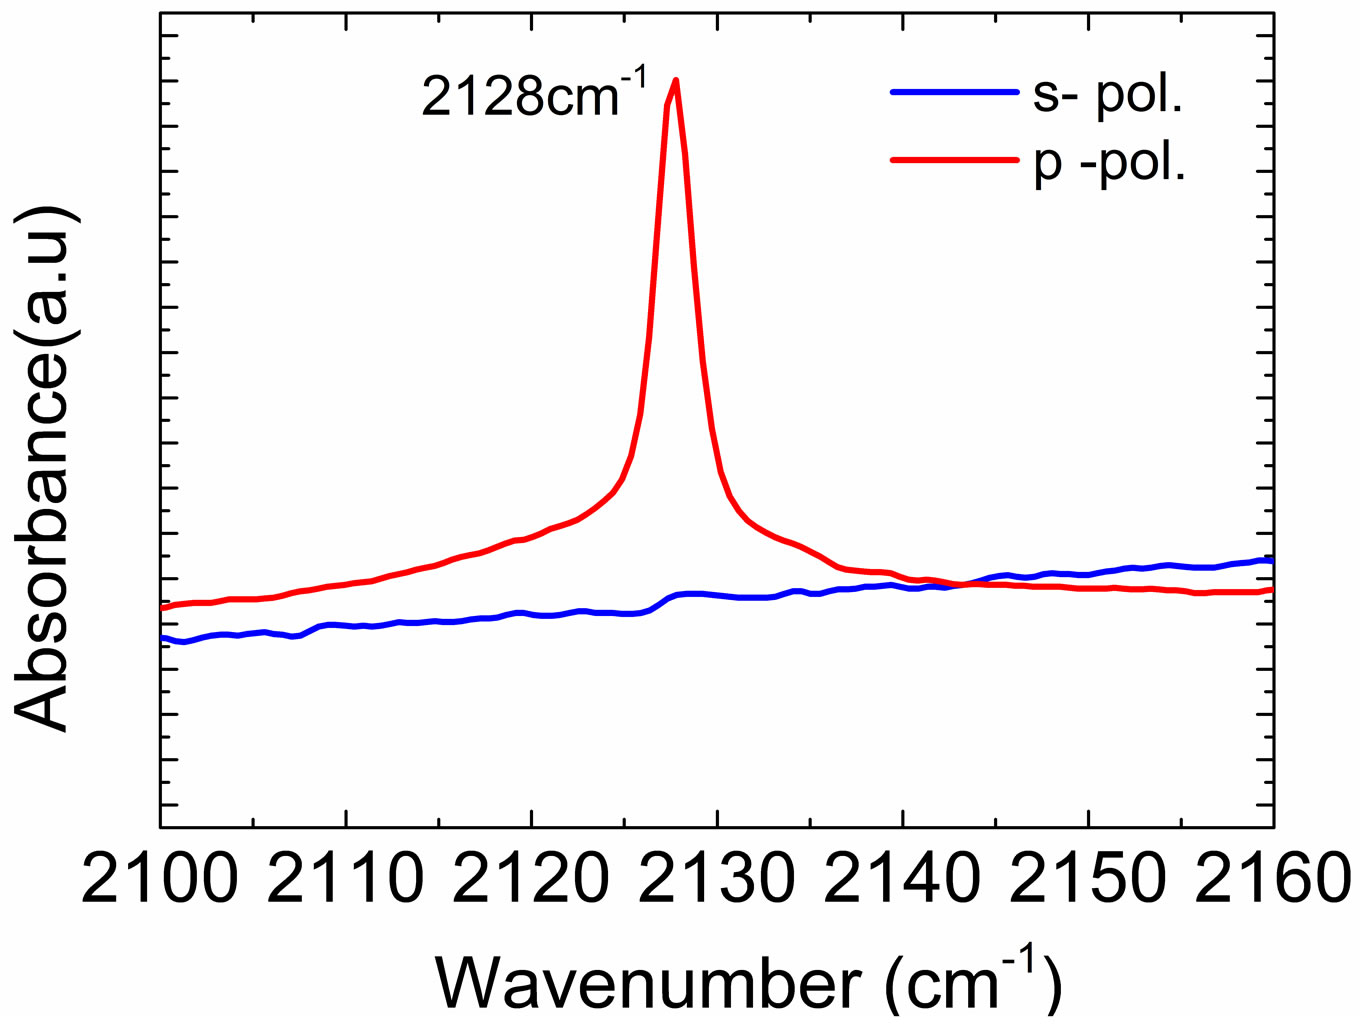
Figure 1. FTIR-ATR spectrum of hydrogenated bilayer graphene showing H-Si stretch mode for p-polarization and no signal for s-polarization.
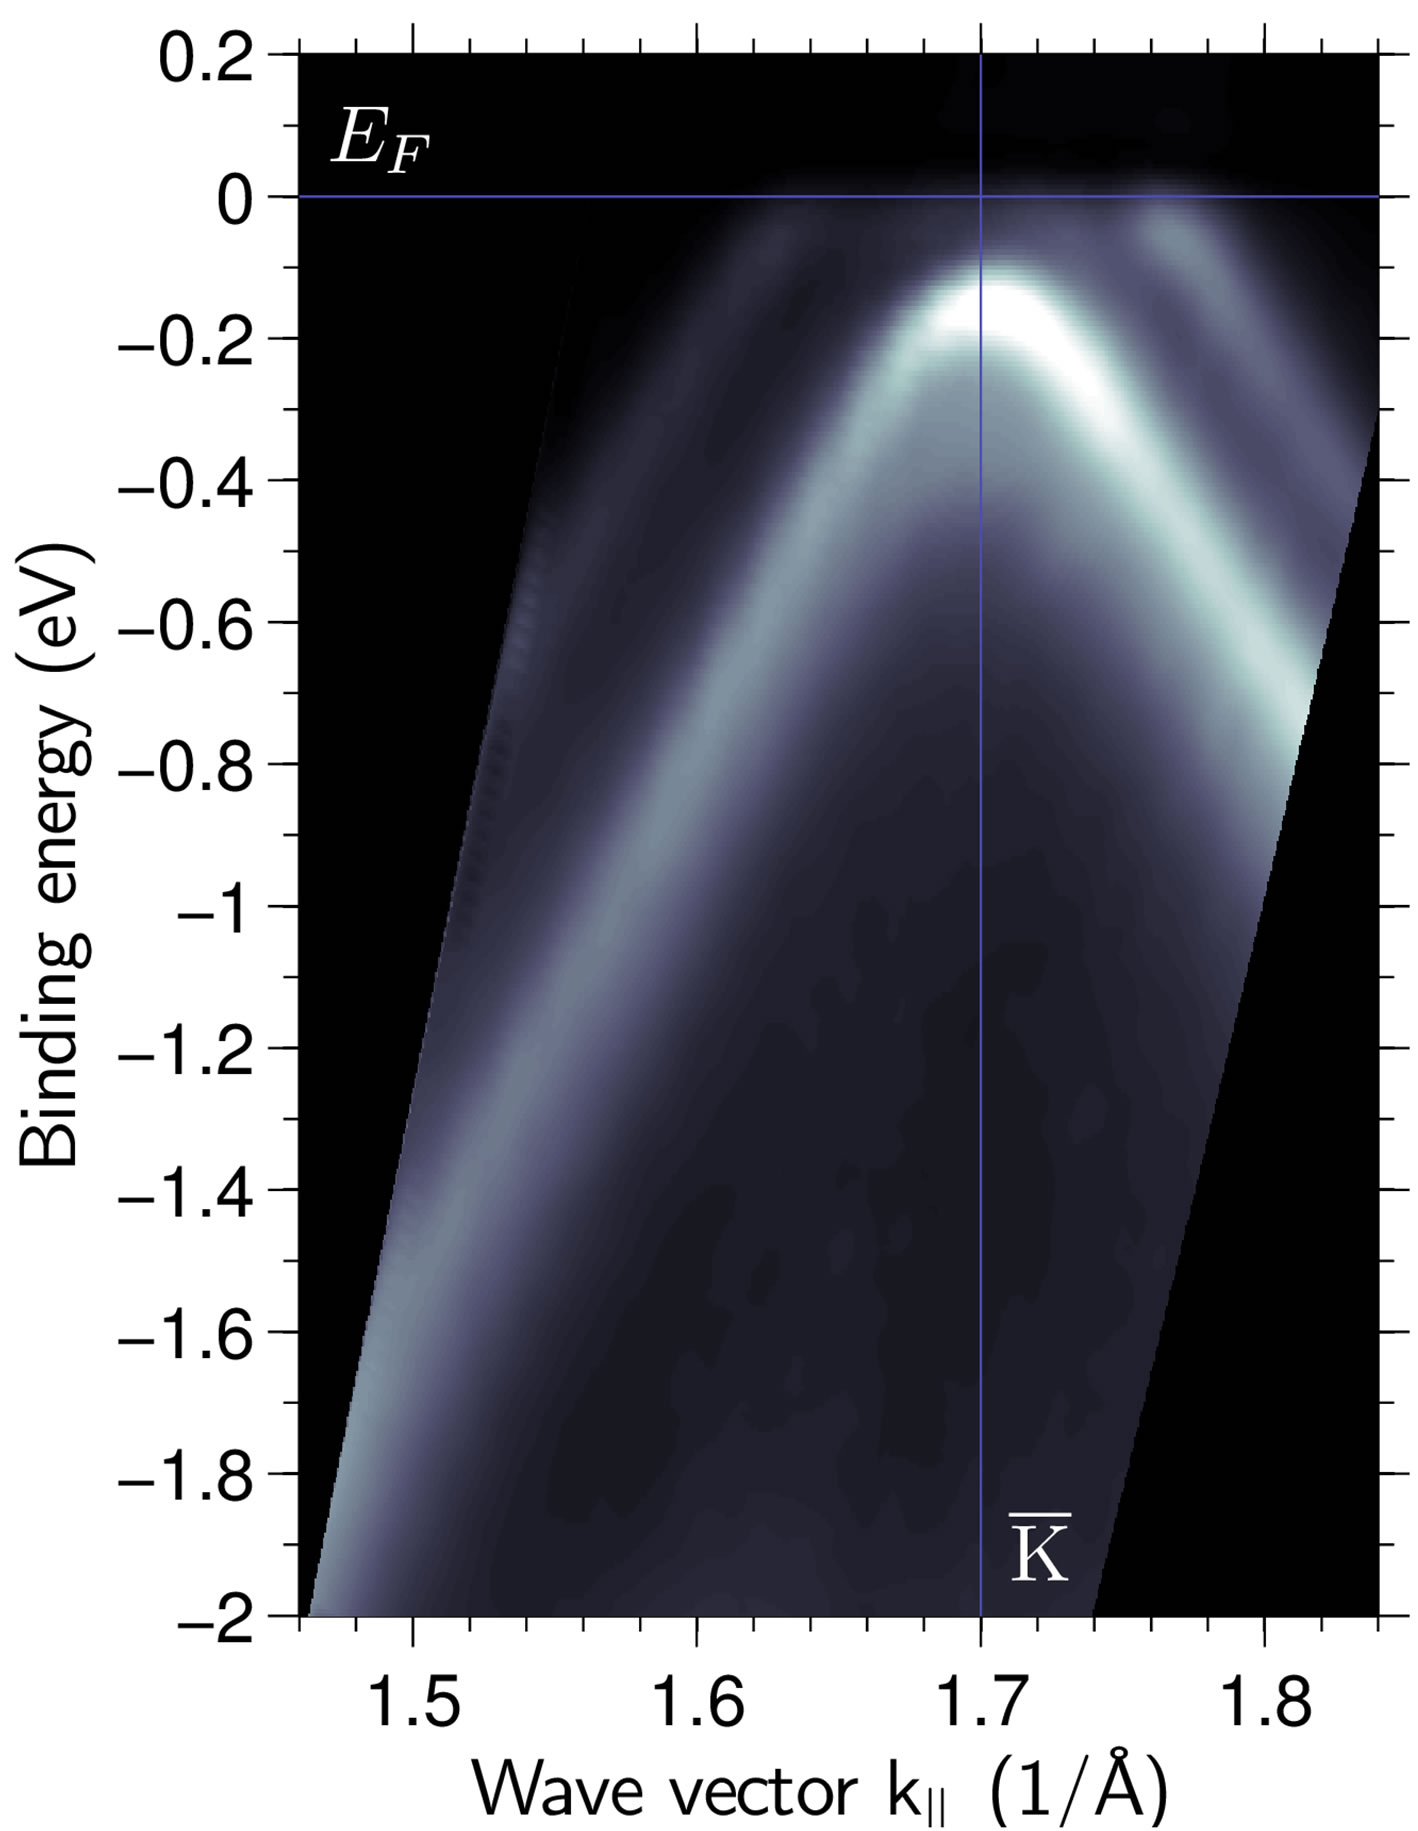
Figure 2. ARPES spectrum measured through the K point, along the Γ-K direction for hydrogenerated bilayer graphene on 4H-SiC(0001)-sample 1275.
about 0.4 eV. This coupling can be obtained from our ARPES measurements presented in Figure 2. The position of the Fermi level of 0.35 ev below the touch point between the valence and conduction bands agrees with hole concentration established from electrical measurements.
The most interesting results were obtained by performing infrared reflectivity measurements in the vicinity of the well-known Raman G band close to 1590 cm−1. They are shown in Figure 3 and compared with the results of Raman mapping for the G line. A light spot of a diameter of about 2 mm was used in reflectivity measurements. The results of reflectivity shown in Figure 3 are compared with a histogram of micro-Raman measurements taken at about 1000 points in the same area of the sample. It is clear that one deals with two modes, i.e. the infrared active mode (OM) and the Raman active mode (RM). The infrared active mode OM is softened by about 10 cm−1 in comparison with the Raman mode. In addition, the OM mode has a Fano shapeline, which will be discussed later on. The results presented in Figure 3 are representative of all other measured samples. The origin of two peaks that compose the G phonon, as shown in Figure 3 is the same as was discussed for results for gated freestanding graphene [8,9]. Bilayer graphene is formed of two graphitic layers in AB Bernal stacking. The phonon branch associated with the G mode of a monolayer gives rise to two branches of bilayer graphene. One of these branches, connected with the inphase displacement of atoms, is Raman active (RM). The other branch, which is linked with the out-of-phase displacement of atoms, will be optic active (OM). The energy
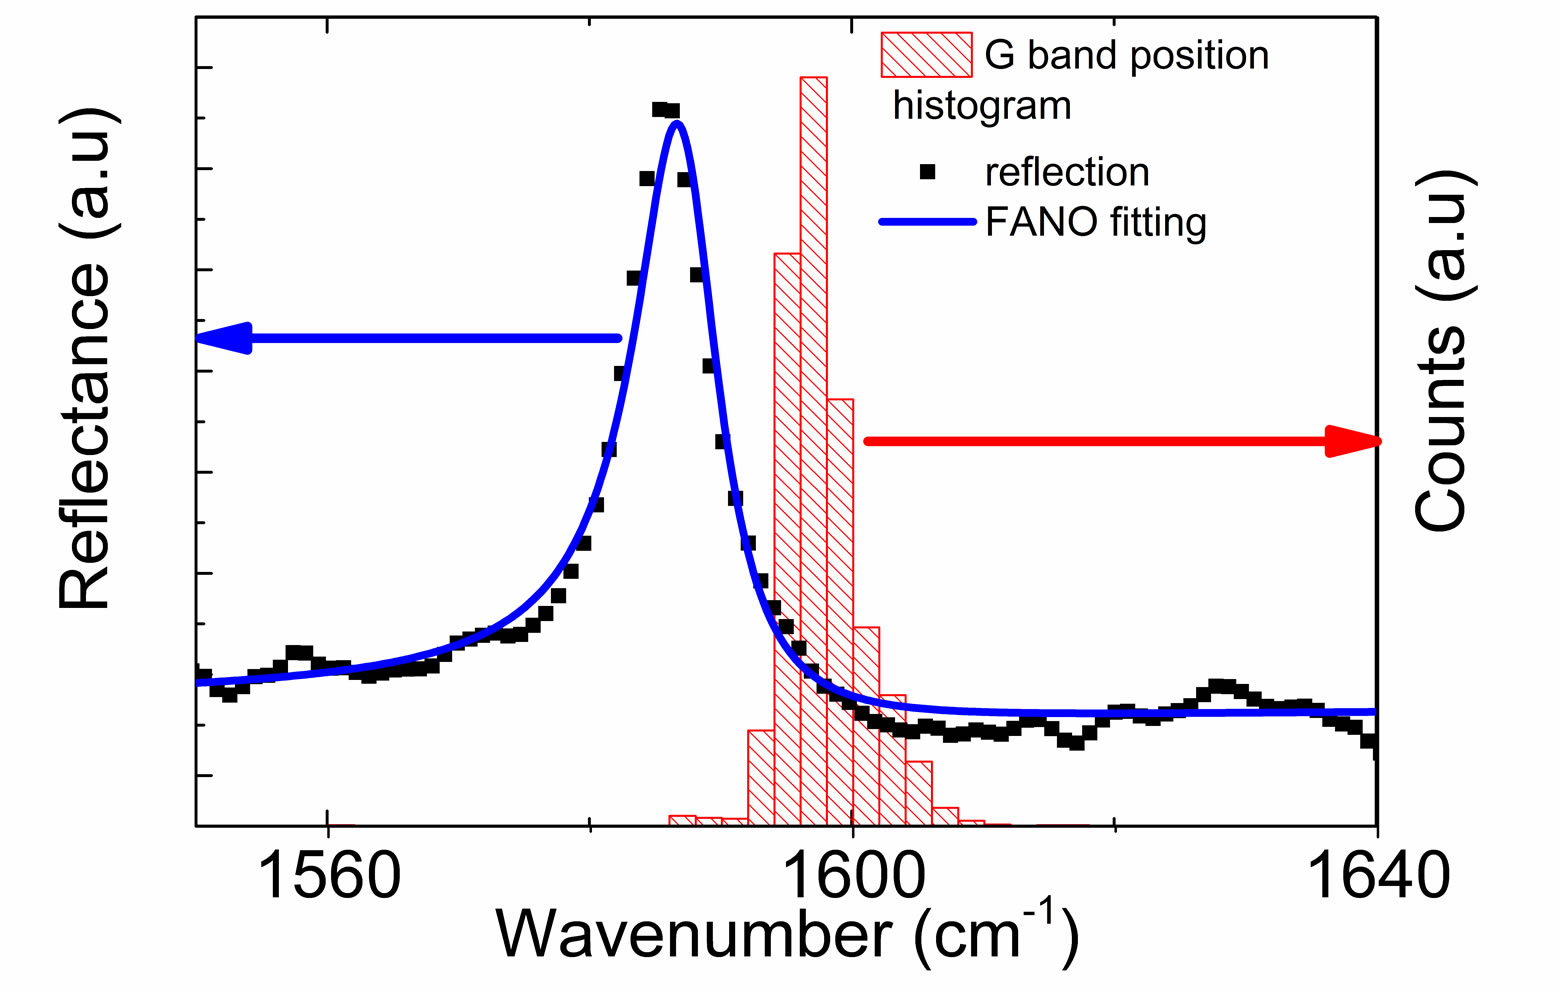
Figure 3. Infrared reflectivity spectrum connected with the OM phonon mode (blue line fit to the Fano lineshape for Γ = 7.5 cm−1 and q = −9.8, and ω = 1587 cm−1) and histogram of the Raman active RM mode for hydrogenated bilayer graphene sample (1587).
separation between RM and OM components is negligible when the Fermi level is close to the Dirac point. However, energy splitting between the energy of the RM and OM modes is induced when doping either with electrons or with holes is performed [4]. Because of the interactions of the optical mode with electronic excitation, the OM is softened, unlike the RM. The Fano shapeline is a manifestation of this interaction. The OM mode softening was previously observed in gated freestanding bilayer graphene and was attributed to a high concentration of carriers induced by the electric field [8,10,11].
Fano shapelines were observed in all measured hydrogenated samples with bilayer graphene. Several examples of such lines are shown in Figure 4. The reflectivity results for a n-type graphene bilayer are also presented in Figure 4. The Fano lineshape observed in the hydrogenated p type samples results from coupling between the sharp phonon mode and a continuum of electronic excitations in the same energy range. Absorption minus the background at a given energy E under Fano resonance conditions has a lineshape described by:
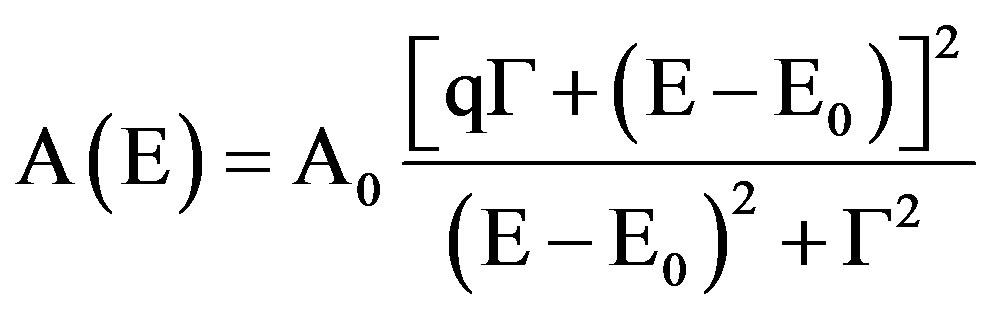
width of phonon resonance and q is a dimensionless asymmetry parameter which characterizes the relative strength of phonon and electronic transitions. Depending on the absolute value of q, the absorption can be Lorentzian (|q| >> 1 phonon dominates), dispersion like (|q| = 1 comparable phonon and electronic contribution) and antiresonance (|q| << 1 electronic transitions dominate). The fit of Fano lineshapes to the observed ones is shown in Figure 5. In all measured samples the phonon resonance ω0 was constant and equal to 1588 +/− 1 cm−1, whereas the observed q was negative. It seems that there is a correlation between the |q| and Γ parameters for all measured p-type bilayers of graphene. An increase in |q| leads to lowering of the value of Γ. The q parameter
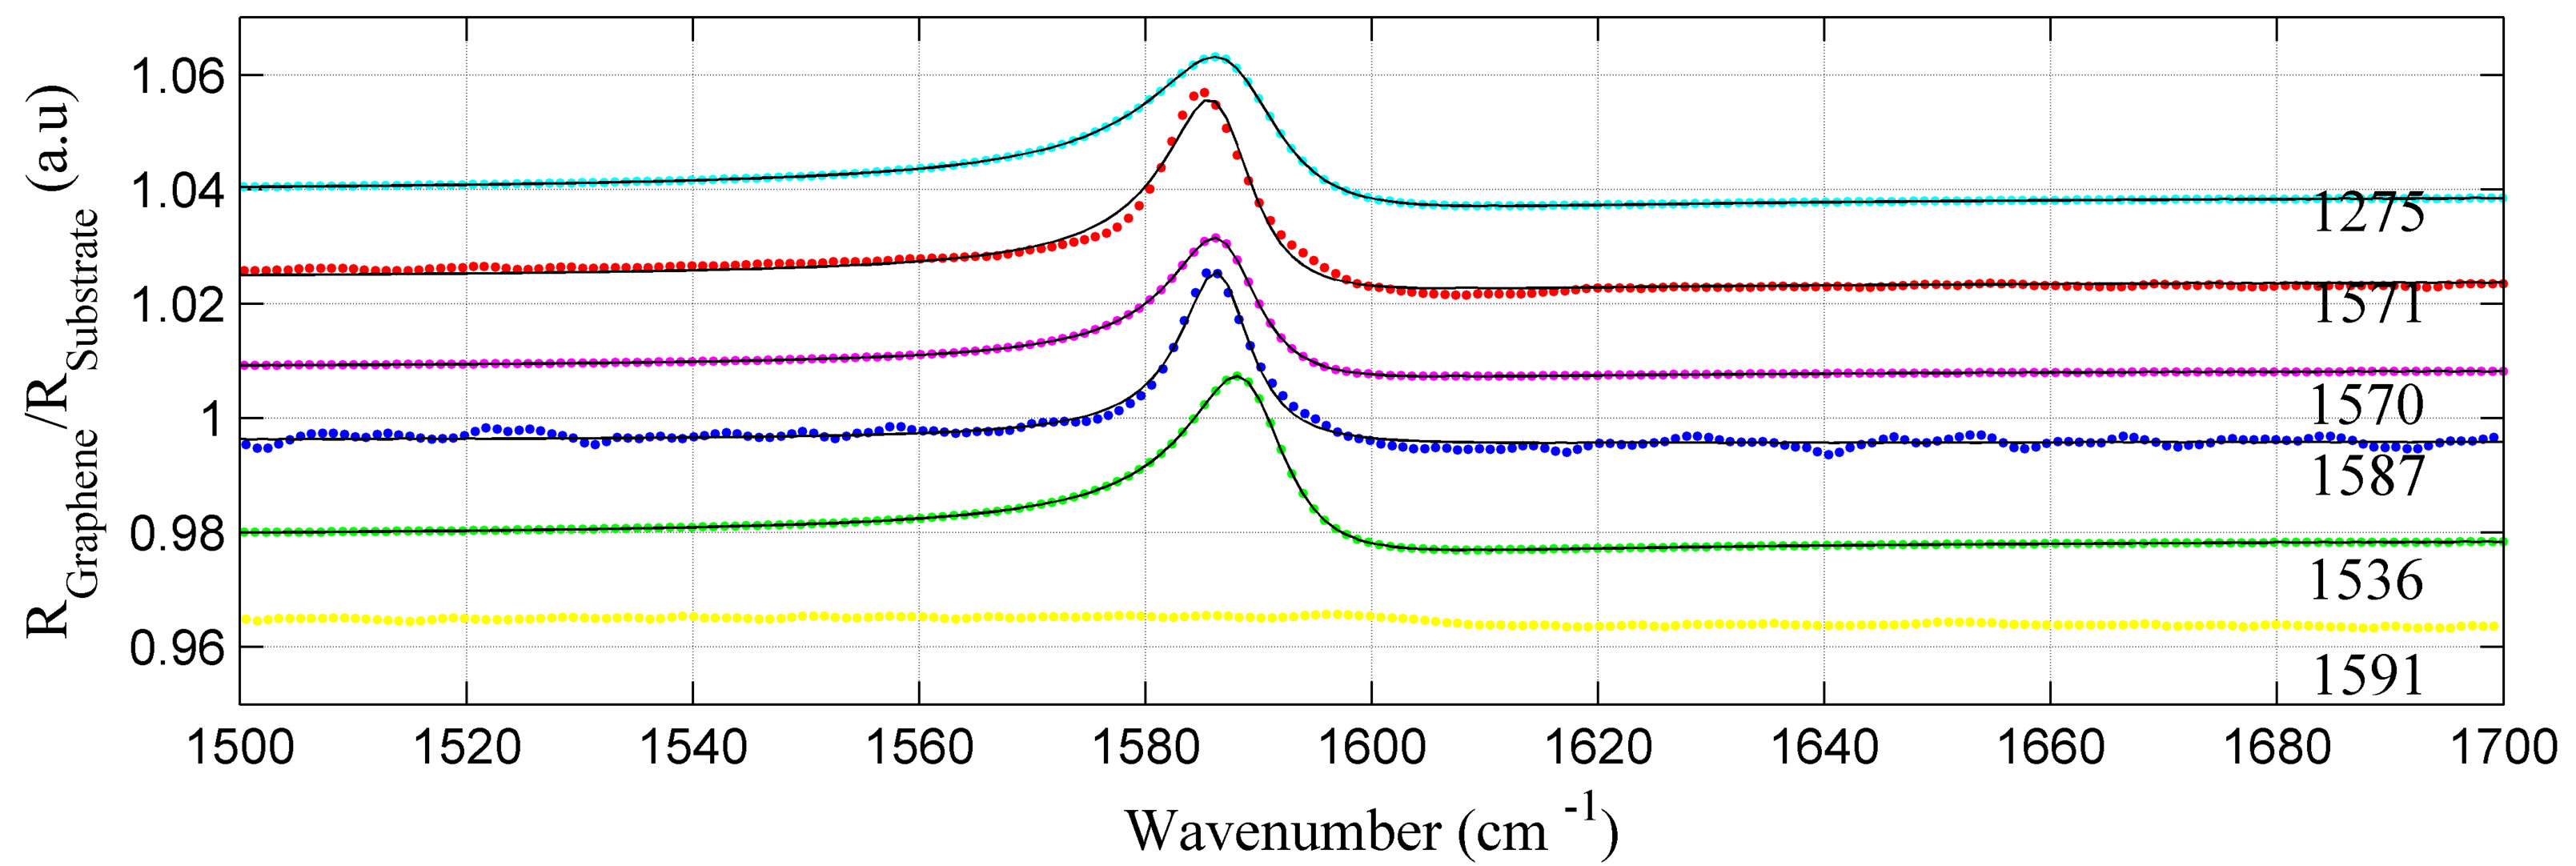
Figure 4. Infrared reflectivity spectra for the OM phonon mode normalized by the reflectivity of a bare substrate and Fano lineshape fit represented by solid lines for hydrogenated bilayer graphene samples grown on 4H-SiC(0001) substrates (the curves are vertically shifted) with the following electrical and Fano parameters (F): 1587: p = +1.6 × 1013 cm−2, μ = 2600 cm2/Vs, and (F): ω0 = 1587 cm−1, q = −9.8, Γ = 7.53 cm−1; 1570: p = +2 × 1013 cm−2, μ = 2150 cm2/Vs, and (F): ω0 = 1587 cm−1, q = −4.23, Γ = 9.47 cm−1; 1571: p = +1.3 × 1013 cm−2, μ = 2700 cm2/Vs, and (F): ω0 = 1587 cm−1, q = −4.59, Γ = 9.34 cm−1; 1536: p = +1.5 × 1013 cm−2, μ =2480 cm2/Vs, and (F): ω0 = 1589 cm−1, q = −3.7, Γ = 10.5 cm−1; 1275: p = +1.5 × 1013 cm−2, μ = 2160 cm2/Vs, and (F) ω0= 1588 cm−1, q = −3.37, Γ = 13.5 cm−1; 1637: n = −2.9 × 1012 cm−2, μ = 470 cm2/Vs, and (F): ω0 = 1604 cm−1, q = −1.79, Γ = 17.7 cm−1.
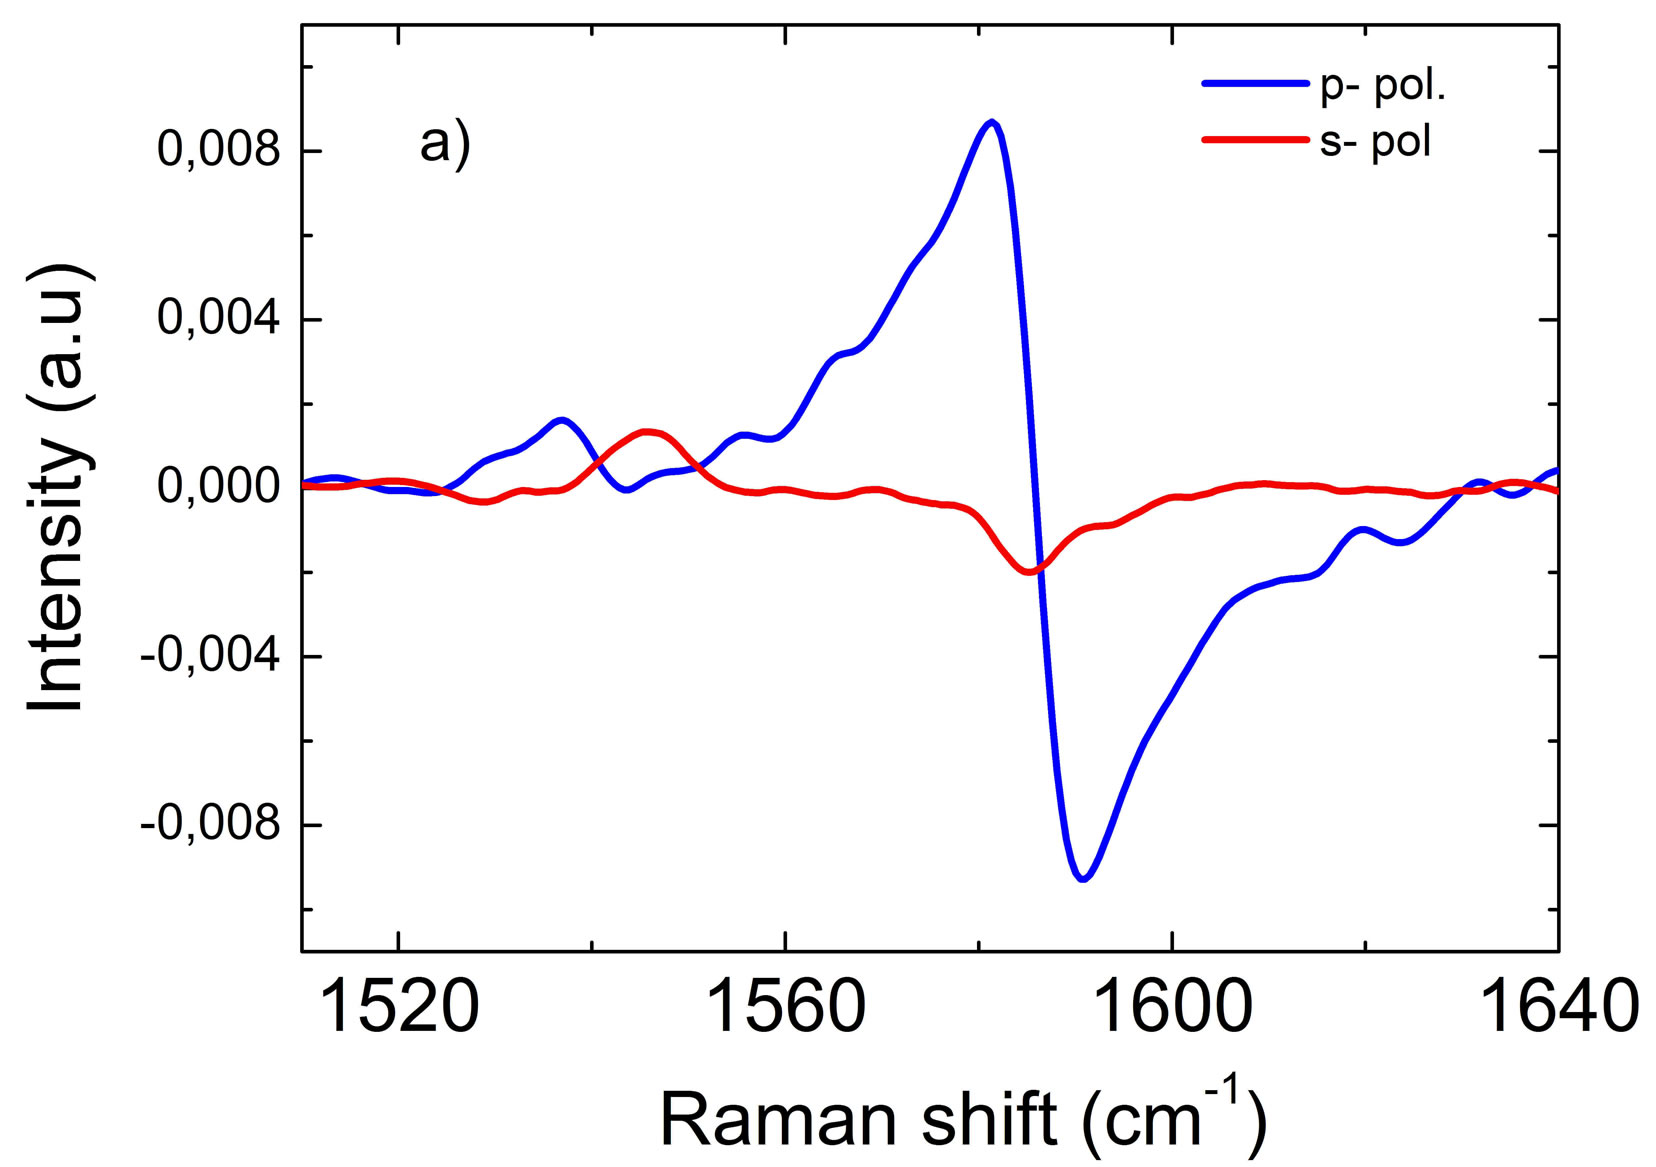
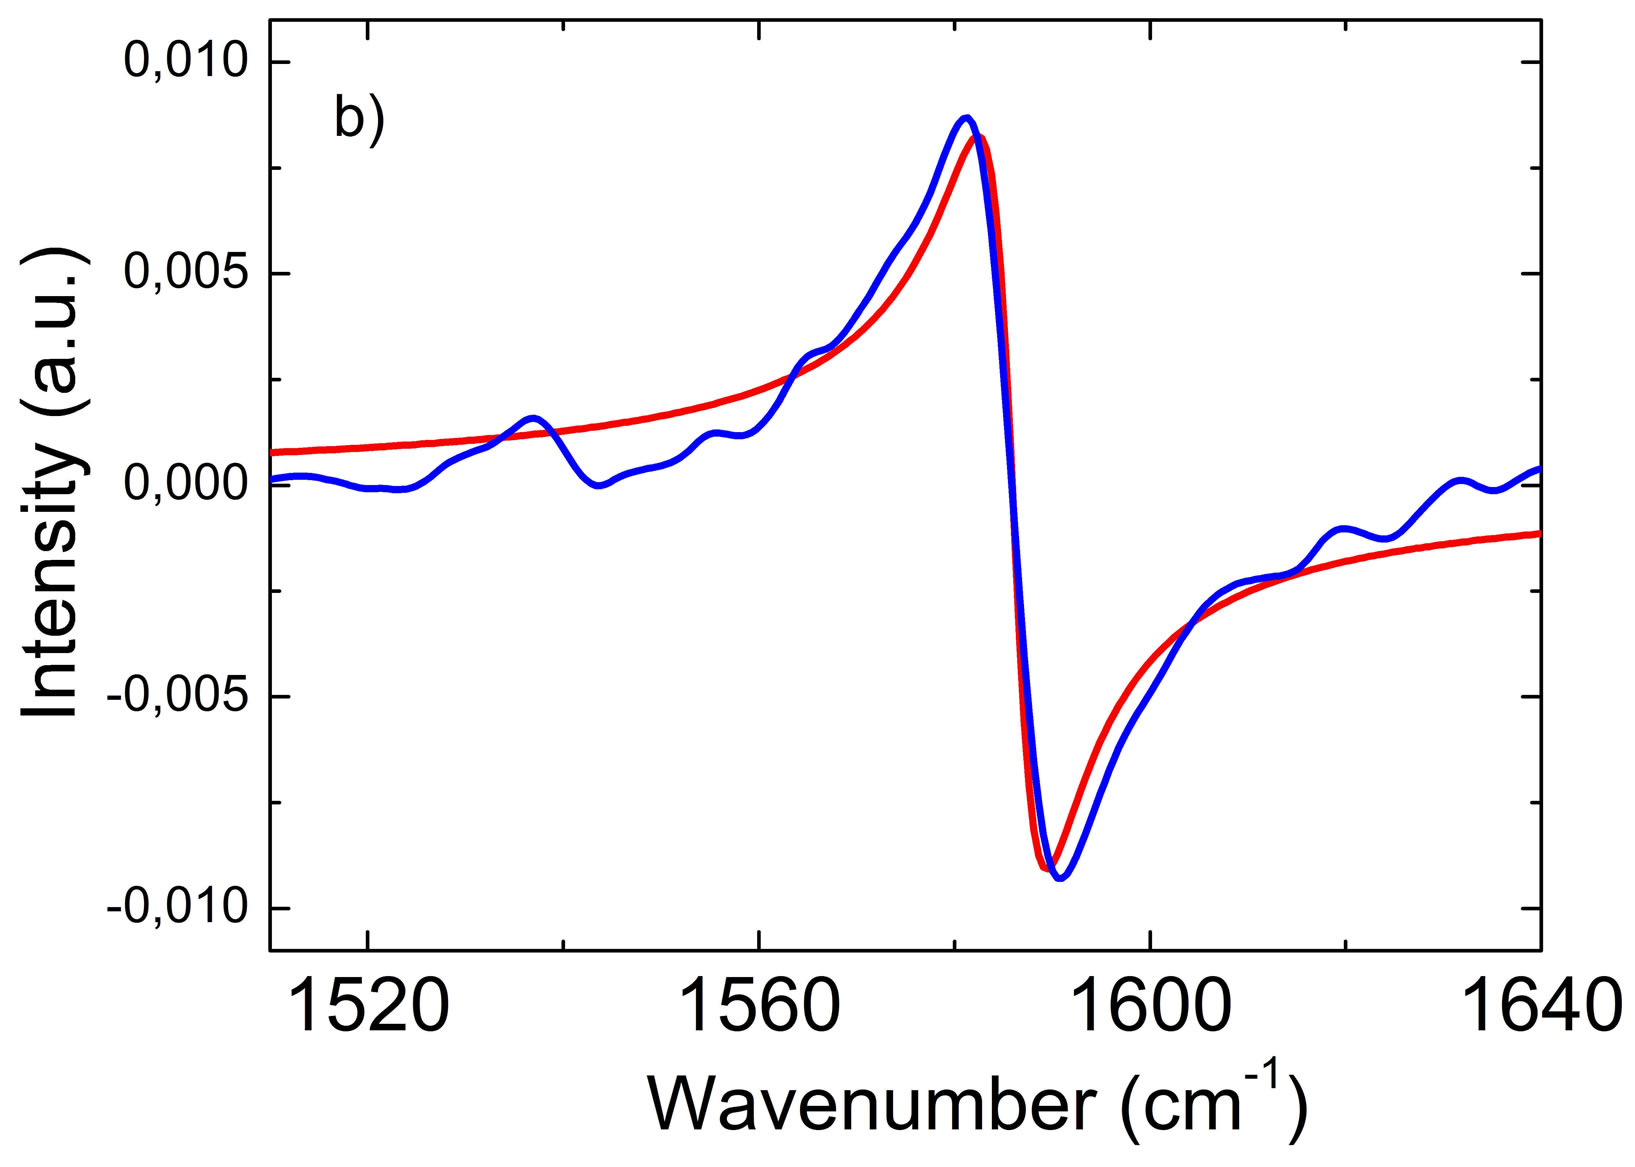
Figure 5. (a) FTIR-ATR spectrum of the 0.2 eV region (after baseline correction) connected with the infrared active OM phonon mode for one of the measured samples (1570) for s and p polarization. (b) Fano lineshap fit (solid line) to the experimental spectrum for s polarization.
should be inversely proportional to the electron-phonon coupling strength, which reflects the electronic density of states at the phonon energy [11,17]. On the other hand, the width of the phonon resonance Γ may be expected to be proportional to the density of states at the phonon energy. Therefore, possibly there is a correlation between |q| and Γ. Moreover, a similar dependence was observed in gated bilayer graphene for holes and electrons [Figures 4(b) and 4(d) in [11]]. The lowest Γ value obtained for sample 1587 was 7.5 cm−1, which is close to the resolution limit of optical measurements and, in consequence, the true line width can be overestimated. The representative FTIR-ATR results shown in Figure 5 for sample 1570 clearly confirm the presence of the Fano shapeline. It is interesting that in contrary to the 2128 cm−1 line, the line at 1590 cm−1 is predominantly observed in s-polarization, which indicates that vibrations connected with the optical 1590 cm−1 mode are within the plane of bilayer graphene. The clear Fano shape of this line suggests that these vibrations are coupled with electronic excitations. A dip in the form of antiresonance is seen in p-polarization. This proves that the optical phonon mode is not activated in p-polarization and only transitions connected with electronic excitations are taking place. It is interesting that the Fano shape line is different in reflection and ATR measurements. In the ATR measurements in s-polarization one can observe a clear dispersive line described by parameters |q| = −0.96 and Γ = 7 cm−1, which indicates that intensity of electronic and phonon excitations are comparable. The q parameter depends on ratio of relative strength of electronic and phonon excitations. Apparently in the experiment when unpolarized falls perpendicular to the surface of the sample and in ATR one, when polarized light falls at angle 11˚, these ratios are different.
The reflectivity results for the n-type graphene sample, shown in Figure 4 are quite different. This sample was not hydrogenated, with the electron concentration of about 2.9 × 1012 cm−2 and mobility of 470 cm2/Vs. The analysis of halfwidth of Raman 2D peak, being close to 50 cm−1, indicate that this sample is predominantly bilayer. The intensity of the optical mode for the n-type sample is much smaller when compared with the intensity for p-type bilayers. The Fano fit to the line give ω0 = 1604 cm−1, γ = −1.79 and Γ = 17.7 cm−1. The presence of the Fano line indicates that interaction of optical phonon mode with electronic excitation takes place. However, the intensity of Fano resonance is much weaker than for the p-type hydrogenated samples. Therefore, it seems essential to have hydrogen doping to observe strong electron-phonon interaction and its manifestation in the form of Fano lineshape.
4. Discussion
The issue to be discussed is the spectacular effect of enhancing the phonon optical mode in p-type bilayer graphene. It was shown that in graphene bilayers a dimensionless effective infrared charge is created for high doping levels. The “charge phonon” theory by Rice outlines the appearance of the effective infrared charge [24, 25]. In this model, molecular vibrations, weakly active in the infrared, are enhanced due to their coupling to virtual electronic resonances at a higher energy. As a result, their effective charge is borrowed from virtual electronic transitions. This effect in vibrational resonances was observed in doped C60 [24] and in gated graphene bilayers [11]. For a hole concentration of about 1.5 × 1013 cm−2, the calculations of the effective charge based on the expression proposed by Kuzmenko [11] yield a result of about 1.5. This exceeds 1, which is the value observed in ionic compounds. Similar values for effective charge in bilayer graphene were obtained for gated structures fabricated at a high gate voltage and high carrier concentration [11]. A recent theoretical description of these effects predicts the Fano lineshape and the enhancement of the intensity of the anti-symmetric optical mode [26]. It was also recently reported that observation of Fano resonances depend on the layer thickness and stacking order of the sample [23].
It is important to note that none of direct interband transitions overlap with the phonon energy. ARPES results in Figure 2 show that the splitting of bands in graphene bilayers, close to 0.4 eV, is twice as big as the phonon energy. Therefore, the electronic continuum responsible for Fano interactions has to be connected with non direct transitions. Most likely, a high concentration of hydrogen atoms within graphene buffer layer and probably also between graphene layers allows non-direct optical transitions. It seems that the presence of hydrogen is essential for conservation of momentum in interband electronic transitions and observation of a strong Fano interaction.
5. Conclusion
In summary, in this work we focused on several characteristics of the infrared active OM mode in hydrogenated epitaxial bilayer graphene in Bernal stacking. A softening and a strong enhancement of the optical mode OM with a Fano lineshape asymmetry were observed. We suggest that coupling of the in plane optical mode to virtual electronic excitation in the energy bands of bilayer graphene is responsible for the observed features. Most probably, the charged phonon mechanism induces the intensity enhancement [11,23,24]. Phonon peaks observed in reflectivity have a pronounced Fano lineshape. The continuum responsible for Fano resonances has to be attributed to broad excitations in the valence band of bilayer graphene. It seems that a high concentration of hydrogen also plays an important role in this process. We suggest that excitations in the valence band are non-direct and hydrogen atoms cause conservation of momentum.
6. Acknowledgements
This work was supported by National Center for Research and Development under GRAF-TECH/NCBiR/ 01/32/2012 “GRAFMET” grant and grant of Polish National Center for Science DEC-2012/04/S/ST3/00186.
REFERENCES
- T. Ando, “Anomaly of Optical Phonon in Monolayer Graphene,” Journal of the Physical Society of Japan, Vol. 75, No. 26, 2006, Article ID: 124701. http://dx.doi.org/10.1143/JPSJ.75.124701
- M. Lazzeri and F. Mauri, “Nonadiabatic Kohn Anomaly in a Doped Graphene Monolayer,” Physical Review Letters, Vol. 97, No. 12, 2006, Article ID: 266407. http://dx.doi.org/10.1103/PhysRevLett.97.266407
- S. Pisana, M. Lazzeri, C. Casiraghi, K. S. Novoselov, A. K. Geim, A. C. Ferrari and F. Mauri, “Breakdown of the Adiabatic Born-Oppenheimer Approximation in Graphene,” Nature Materials, Vol. 6, No. 3, 2007, pp. 198-201. http://dx.doi.org/10.1038/nmat1846
- J. Yan, Y. Zhang, P. Kim and A. Pinczuk, “Electric Field Effect Tuning of Electron-Phonon Coupling in Graphene,” Physical Review Letters, Vol. 98, No. 16, 2007, Article ID: 166802. http://dx.doi.org/10.1103/PhysRevLett.98.166802
- A. Das, S. Pisana, B. Chakraborty, S. Piscanec, S. K. Saha, U. V. Waghmare, K. S. Novoselov, H. R. Krishnamurthy, A. K. Geim, A. C. Ferrari and A. K. Sood, “Monitoring Dopants by Raman Scattering in an Electrochemically Top-Gated Graphene Transistor,” Nature Nanotechnology, Vol. 3, No. 4, 2008, pp. 210-2015. http://dx.doi.org/10.1038/nnano.2008.67
- T. Ando, “Anomaly of Optical Phonons in Bilayer Graphene,” Journal of the Physical Society of Japan, Vol. 76, No. 10, 2007, Article ID: 104711. http://dx.doi.org/10.1143/JPSJ.76.104711
- J. Yan, E. A. Henriksen, P. Kim and A. Pinczuk, “Observation of Anomalous Phonon Softening in Bilayer Graphene,” Physical Review Letters, Vol. 101, No. 13, 2008, Article ID: 136804. http://dx.doi.org/10.1103/PhysRevLett.101.136804
- L. M. Malard, D. C. Elias, E. S. Alves and M. A. Pimenta, “Observation of Distinct Electron-Phonon Couplings in Gated Bilayer Graphene,” Physical Review Letters, Vol. 101, No. 25, 2008, Article ID: 257401. http://dx.doi.org/10.1103/PhysRevLett.101.257401
- J. Yan, T. Villarson, E. A. Henriksen, P. Kim and A. Pinczuk, “Optical Phonon Mixing in Bilayer Graphene with a Broken Inversion Symmetry,” Physical Review B, Vol. 80, No. 24, 2008, Article ID: 241417. http://dx.doi.org/10.1103/PhysRevB.80.241417
- T. Ta Tang, Y. Zhang, Ch.-H. Park, B. Geng, C. Girit, Z. Hao, M. C. Martin, A. Zettl, M. F. Crommie, S. G. Louie, Y. R. Shen and F. Wang, “A Tunable Phonon-Exciton Fano System in Bilayer Graphene,” Nature Nanotechnology, Vol. 5, 2010, pp. 32-36.
- A. B. Kuzmenko, L. Benfatto, E. Cappelluti, I. Crassee, D. van der Marel, P. Blake, K. S. Novoselov and A. K. Geim, “Gate Tunable Infrared Phonon Anomalies in Bilayer Graphene,” Physical Review Letters, Vol. 103, No. 11, 2009, Article ID: 116804. http://dx.doi.org/10.1103/PhysRevLett.103.116804
- U. Fano, “Effects of Configuration Interaction on Intensities and Phase Shifts,” Physical Review, Vol. 124, No. 6, 1961, pp. 1866-1878. http://dx.doi.org/10.1103/PhysRev.124.1866
- P. C. Eklund and K. R. Subbaswamy, “Analysis of BreitWigner Line Shapes in the Raman Spectra of Graphite Intercalation Compounds,” Physical Review B, Vol. 20, No. 12, 1979, pp. 5157-5161. http://dx.doi.org/10.1103/PhysRevB.20.5157
- Z. H. Wang, M. S. Dresselhaus, G. Dresselhaus and P. C. Eklund, “Raman Studies of Electron-Phonon Interaction in KxC70,” Physical Review B, Vol. 48, No. 22, 1993, pp. 16881-16884. http://dx.doi.org/10.1103/PhysRevB.48.16881
- S. D. M. Brown, A. Jorio, P. Corio, M. S. Dresselhaus, G. Dresselhaus, R. Saito and K. Kneipp, “Origin of the Breit-Wigner-Fano Lineshape of the Tangential G-Band Feature of Metallic Carbon nanotubes,” Physical Review B, Vol. 63, No. 15, 2001, Article ID: 155414. http://dx.doi.org/10.1103/PhysRevB.63.155414
- M. Manzardo, E. Cappelluti, E. van Heumen and A. B. Kuzmenko, “A Crucial Role in This Context Is Played by the Particle-Hole Asymmetry of the Electronic π-Bands,” Physical Review B, 2012. http://arxiv.org/abs/1205.4907
- Z. Li, Ch. H. Lui, E. Cappelluti, L. Benfatto, K. Mak, G. L. Carr, J. Shan and T. F. Heinz, “Structure-Dependent Fano Resonances in the Infrared Spectra of Phonons in Few-Layer Graphene,” Physical Review Letters, Vol. 108, No. 15, 2012, Article ID: 156801. http://dx.doi.org/10.1103/PhysRevLett.108.156801
- W. Strupinski, K. Grodecki, A. Wysmolek, R. Stepniewski, T. Szkopek, P. E. Gaskell, A. Grüneis, D. Haberer, R. Bozek, J. Krupka and J. M. Baranowski, “Graphene Epitaxy by Chemical Vapor Deposition on SiC,” Nano Letters, Vol. 11, No. 4, 2011, pp. 1786-1791. http://dx.doi.org/10.1021/nl200390e
- K. V. Emtsev, F. Speck, T. Seyller, L. Ley and J. D. Riley, “Interaction, Growth, and Ordering of Epitaxial Graphene on SiC{0001} Surfaces: A Comparative Photoelectron Spectroscopy Study,” Physical Review B, Vol. 77, No. 15, 2008, Article ID: 155303. http://dx.doi.org/10.1103/PhysRevB.77.155303
- C. Riedl, C. Coletti, T. Iwasaki, A. A. Zakharov and U. Starke, “Quasi-Free-Standing Epitaxial Graphene on SiC Obtained by Hydrogen Intercalation,” Physical Review Letters, Vol. 103, No. 24, 2009, Article ID: 246804. http://dx.doi.org/10.1103/PhysRevLett.103.246804
- C. Virojanadara, A. A. Zakharov, R. Yakimova, L. I. Johansson, “Buffer Layer Free Large Area Bi-Layer Graphene on SiC(0 0 0 1),” Surface Science, Vol. 604, No. 2, 2010, pp. L4-L7. http://dx.doi.org/10.1016/j.susc.2009.11.011
- F. Speck, J. Jobst, F. Fromm, M. Ostler, D. Waldmann, M. Hundhausen, H. B. Weber and Th. Seyller, “The QuasiFree-Standing Nature of Graphene on H-Saturated SiC (0001),” Physical Review Letters, Vol. 99, No. 12, 2011, Article ID: 122106. http://dx.doi.org/10.1063/1.3643034
- Z. Li, Ch. H. Lui, E. Cappelluti, L. Benfatto, K. F. Mak, G. L. Carr, J. Shan and T. F. Heinz, “Structure-Dependent Fano Resonances in the Infrared Spectra of Phonons in Few-Layer Graphene,” Physical Review Letters, Vol. 108, No. 15, 2012, Article ID: 156801. http://dx.doi.org/10.1103/PhysRevLett.108.156801
- M. J. Rice and H.-Y. Choi, “Charged-Phonon Absorption in Doped C60,” Physical Review B, Vol. 45, No. 17, 1992, pp. 10173-10176. http://dx.doi.org/10.1103/PhysRevB.45.10173
- M. J. Rice, “Organic Linear Conductors as Systems for the Study of Electron-Phonon Interactions in the Organic Solid State,” Physical Review Letters, Vol. 37, No. 1, 1976, pp. 36-39. http://dx.doi.org/10.1103/PhysRevLett.37.36
- E. Cappelluti, L. Benfatto and A. B. Kuzmenko, “Phonon Switching and Combined Fano-Rice Effect in Optical Spectra of Bilayer Graphene,” Physical Review B, Vol. 82, No. 4, 2010, Article ID: 041402. http://dx.doi.org/10.1103/PhysRevB.82.041402
NOTES
*Corresponding author.