Advances in Remote Sensing
Vol.2 No.1(2013), Article ID:28964,9 pages DOI:10.4236/ars.2013.21001
Integrated Assessment of Forest Cover Change and Above-Ground Carbon Stock in Pugu and Kazimzumbwi Forest Reserves, Tanzania
1Sokoine University of Agriculture, Morogoro, Tanzania
2Ardhi University, Dar es Salaam, Tanzania
3Tanzania Meteorological Agency, Dar es Salaam, Tanzania
Email: *jkashaigili@gmail.com
Received December 15, 2012; revised January 22, 2013; accepted February 1, 2013
Keywords: Land Cover Change; Remote Sensing and GIS; Pugu & Kazimzumbwi Forest Reserves; Carbon Stock; Coastal Forests; Tanzania
ABSTRACT
A study was conducted to estimate the forest cover change, quantify and map tree above-ground carbon stock using Remote sensing and GIS techniques together with forest inventory. Landsat images of 1980, 1995 and 2010 acquired during dry season were used in the estimation of cover changes. Supervised image classification using Maximum Likelihood Classifier was performed in ERDAS Imagine software to analyze the images and further analysis was performed in Arc GIS 9.3 software. Stratified sampling procedure was used to select concentric inventory plots in Pugu Forest Reserve (PFR) and Kazimzumbwi Forest Reserve (KFR). Plots were laid according to NAFORMA, and the tree parameters in each sampling plot were collected. A Microsoft Excel spreadsheet was used to compute the above-ground biomass for each plot using an empirical equation relating wood basic density and tree height. The above-ground carbon was calculated using a conversion factor of 0.49. Geostatistical method in ArcGIS was used to analyze and map carbon. Results revealed that for the periods 1980-1995 and 1995-2010, Closed Forest in PFR decreased by 4.5% and 25.3% respectively, while for KFR, Closed Forest decreased by 11.9% and 31.3% respectively. The mean carbon density for PFR and KFR were respectively 5.72 tC/ha and 0.98 tC/ha while carbon stocks were 14 730.41 tC and 7 206.46 tC respectively. The revealed low carbon densities were attributable to decline in area under Closed Forest in the two Forest Reserves. The study recommends concerted efforts to enhance proper management of the forests so that the two forest reserves may contribute to REDD initiatives.
1. Introduction
Global warming which is largely contributed by increased anthropogenic Green House Gases (GHGs) represents significant development challenges for this 21st Century. It is well known that the main cause of global warming is the increase of anthropogenic Carbon dioxide (CO2) emission, which accounts to 77% of all GHGs [1].
Reducing carbon emissions is of great important in this era of climate change. Several mechanisms have been developed by United Nations Framework Convention on Climate Change (UNFCCC), these includes cutting down CO2 emissions from Annex 1 countries, and reducing deforestation and forest degradation in developing countries. Although UNFCCC requires cutting down of CO2 emissions, tropical deforestation contributes to 20% - 25% of annual global emissions of CO2 [2] and it is said to be the second largest global source of anthropogenic carbon dioxide emissions [3].
Reducing Emissions from Deforestation and forest Degradation (REDD) concept requires developing countries to be involved in the management of forests including reforestation and afforestation. The REDD concept is proposing to finance all activities that contributes to the improvement of forests condition, whereby developing countries that contributes to the reduction of carbon emissions may be able to sell carbon credits to the international carbon markets. In order to finance for carbon emission reduction, quantification of forest carbon is of great important.
This paper presents an attempt to integrate satellite imageries and ground based inventories in the estimation of tree above ground biomass and carbon for the Pugu and Kazimzumbwi Forest Reserves (PKFR) in the coastal areas of Tanzania. PKFR are among of the important biodiversity hotspots in Tropical Africa [4], but they are under threat of being depleted due to anthropogenic activities including deforestation and forest degradation. Due to these anthropogenic activities, it is not well known how much forest covers have changed and the quantities of the available tree above ground carbon stocks are not known.
2. Materials and Methods
2.1. Study Area
Pugu and Kazimzumbwi Forest Reserves (PKFR) are located in Kisarawe District in the Coast region of Tanzania (Figure 1). Kisarawe District is located at 7˚10'0S, 38˚49'60E and bordered by the following Districts: Ilala to the East, Kibaha to the North, Morogoro to the West and Rufiji to the South. Kisarawe District receives annual rainfall of about 1236 mm, which is 20% more than Dar es Salaam. The area experiences two rainfall regimes. It receives short rains (Vuli) from October to December and the long rains (Masika) from March to May. Temperature in the District ranges between 24˚C - 31˚C [5]. According to 2002 Census, the population of Kisarawe District was 95 615 [6]. Currently, the population has continued to increase as a result of human natural birth and immigration. The PKFR are adjacent to each other (Figure 1), one to the north and the other one to the south. The altitude ranges between 100 and 350 m above mean sea level for PFR and 120 and 270 m above mean sea level for KFR [5].
2.2. Methods
2.2.1. Remote Sensing Data and Its Processing
Table 1 presents the Landsat images used for the study. All images were acquired during dry season between June and July so as to minimize seasonality and cloud
Table 1. Remote sensed data used in the analysis of forest cover changes.
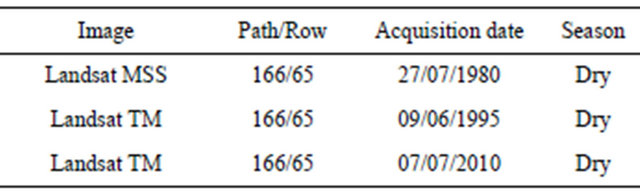
TM = Thematic Mapper; MSS = Multi Spectral Scanner.

Figure 1. Location of PKFR in Kisarawe District.
effects.
The acquired image scenes of the years 1980 and 2010 had already been geo-rectified by the supplier. To ensure accurate identification of temporal changes and geometric compatibility with other sources of information, image to image geo-correction was conducted to rectify the 1995 imagery based on 2010 image. Images enhancement was performed using a 4,5,3 color composite band combination and its contrast was stretched using the Gaussian distribution function followed by high pass filter 3 × 3 to increase the visibility of the ground control points in both images. The first order polynomial transformation and nearest neighborhood interpolation [7] was applied to geometrically rectified the 1995 imagery and registered to the UTM map coordinate system, Zone 37 South, Datum Arc 1960.
Base maps were prepared based on the image acquired on 7th July 2010 and used in ground truthing exercise. The essence of conducting ground truthing was to verify different covers types as described on the base maps and for collection of ground points for the classification accuracy assessment. Supervised classification, using Maximum Likelihood Classifier [7-9] was performed applying ERDAS IMAGINE software. Training fields were identified by inspecting an enhanced colour composite imagery. Areas with similar spectral characteristics were trained and classified. The error matrices [10] were prepared and used in computation of Kappa coefficient for the classification accuracy assessment.
To analyse the changes between different time epochs, change detection analysis was performed. Many change detection methods have been developed and used for various applications. However, they can broadly be divided into: post-classification approaches and spectral change detection approaches [8]. The post classification change detection method was applied followed by spatial overlay analysis [11] in ArcGIS environment resulting into attribute tables. The tables were exported to MS-Excel to compile area change detection matrix for 1980-1995 and 1995-2010 periods. The estimation for the rate of change for the different covers was computed based on the formulae [8].
2.2.2. Carbon Quantification
Stratified sampling technique [12] based on vegetation cover classification was performed. Based on 2010 Landsat TM imagery, the vegetation covers obtained were Closed Forest, Open Forest, Bushland and Grassland. Each cover class was considered as stratum. Settlements and other Land uses class (e.g., bareland and cultivated land) were not included during inventory, because they had little vegetation.
Concentric plot [13] was adopted and used in this study. To ease the counting process, each sample plot was sub-divided into four sub-plots (concentric plots) of radius 2 m, 5 m, 10 m and 15 m. At the radius of 2 m, all trees with dbh <2 cm and >1 cm were recorded; at the radius of 5 m, all trees with dbh >= 2 cm and <10 cm were recorded; at the radius of 10m, all trees with dbh >= 10 and <20 cm were recorded; and at the radius 15 m, all trees with dbh >= 20 cm were recorded. Tree diameters were measured using veneer caliper and tree heights were measured using Suunto hypsometer. A botanist and local people were engaged for the identification of botanical/ scientific names and local names of trees respectively. The number of sample plots and the distance between plots were determined by the formula [14];
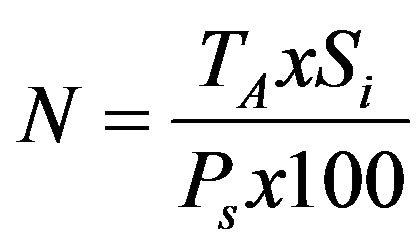 (3)
(3)
where N = number of sample plots, 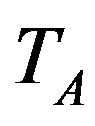 = Total area of the forest,
 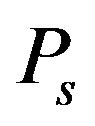 = Plot size and
  = Sampling intensity, while the distance between plots was determined by the formula:
 (4)
(4)
where D = inter plots distance (m), Af = Area of the forest (ha) and N = number of plots.
The adopted sampling intensity was atleast 0.1%. Therefore for KFR, the total area of Bushland, Closed Forest, Grassland and Open Forest, based on 2010 landsat image classification was 4820.8 ha, making a total of 68 plots while in PFR, the total area for Bushland, Closed Forest, Grassland and Open Forest based on 2010 landsat image was 2230.1 ha, making a total of 33 plots. Transects were created, where in each transect, concentric plots of radius 15 m (0.07 ha) were systematically located at 842 m and 822 m intervals from each other in the North-South direction in KFR and PFR respectively, (Figure 2). According to [15], plots need to be allocated systematically so as to achieve a certain level of accuracy. During inventory, a GPS facilitated orienting direction to the next plots. In each plot, dbh, height and names (local and botanical names) of each tree was documented. Dbh was measured at 1.3 m above the ground level [13].
Tree above ground biomass (AGB) was computed as a product of total tree volume and wood basic density. The average wood density of 0.58g cm−3 for natural forest was used [16]. The volumes of trees were estimated using the formula [15]:
 (5)
(5)
where  = Volume of the ith tree (m3)
g = the tree basal area (m2)
0.5 = tree form factor.
The value recommended in natural forests of Tanzania without distinction of the vegetation type involved [17].
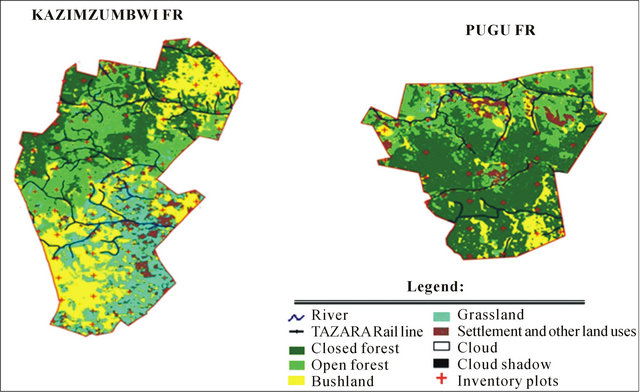
Figure 2. The map indicating KFR and PFR inventory plots.
The value of tree biomass was converted to carbon using a biomass-carbon ratio of 0.49 [12,18]. The carbon density for the whole forest was obtained by averaging carbon density from each individual forest stratum. Carbon stock was obtained by summing the products of stratum’s carbon density and their corresponding cover area. The carbon stocks for 1980 and 1995 were obtained by assuming that individual cover class’s carbon densities didn’t change [19].
2.2.3. Carbon Mapping
According to [20], Ordinary Kriging using exponential semivariogram model was considered to have the best performance for AGB estimation and for examining its spatial heterogeneity. Therefore, in this study, mapping of tree above ground carbon was done by Ordinary Kriging using exponential semivariogram model.
3. Results and Discussion
3.1. Accuracy Assessment for PKFR
The results from classification accuracy assessment revealed that the overall accuracy of classification for PFR was 84.85% and that of KFR was 82.35%. According to [21] the overall accuracy is acceptable if it is greater than 80%.
3.2. KFR Land Cover Maps and Their Changes
The land cover maps for the period 1980, 1995 and 2010 are presented in Figure 3, while Table 2 presents the cover areas for respective periods and the area changes between 1980 and 1995, and between 1995 and 2010 periods. Generally, the maps indicate that there is significant variation between periods under consideration.
Results (Table 2) indicate that in 1980, Closed Forest occupied 4050.9 ha (75.7%), Bushland 728.8 ha (13.6%), Grassland 269.4 (5%), Open Forest 260.2 (4.9%), Settlement and other land uses 4.7 ha (0.1%). In 1995, Closed Forest occupied 3415.4 ha (63.8%) followed by Grassland 741.2 ha (13.9%), Open Forest 654.3 ha (12.2%), Bushland 449.1 ha (8.4%), and Settlement and other Land uses 89.7 ha (1.7%). Likewise in 2010, Closed Forest occupied 1740.55 (32.5%), Bushland 1131.7 ha (21.2%), Open Forest 1032.3 ha (19.3%), Grassland 916.5 ha (17.1%) and Settlement and other land uses 528.9 ha (9.9%).
During the period 1980-1995, the result (Table 2) revealed that closed forest decreased by 635.5 ha (−11.9%) and 1674.9 ha (−31.3%) for the period 1995-2010. Similarly, in the period 1980-1995, settlement and other land uses increased by 85 ha (1.6%) and 439.2 ha (8.2%) between 1995-2010.
3.3. PFR Land Cover Maps and Their Changes
Figure 4 presents the land cover maps of PFR for the periods 1980, 1995 and 2010 respectively, while Table 3 presents the cover areas for respective periods and the area changes between 1980 and 1995, and between 1995 and 2010 periods. During the period 1980, it was revealed that Closed Forest occupied 2106.6 ha (87.2%), Open Forest 110.4 ha (4.6%), Bushland 81.1 ha (3.4%), Grassland 21.5 ha (0.9%), and Settlement and other land uses 10 ha (0.4%) (Table 3). In 1995, Closed Forest occupied 1997.4 ha (82.7%), Open Forest 299.1 ha (12.4%), Bushland 15.5 ha (0.6%, Grassland 18.3 ha (0.8%), and Settlement and other land uses 85 ha (3.5%). Similarly,
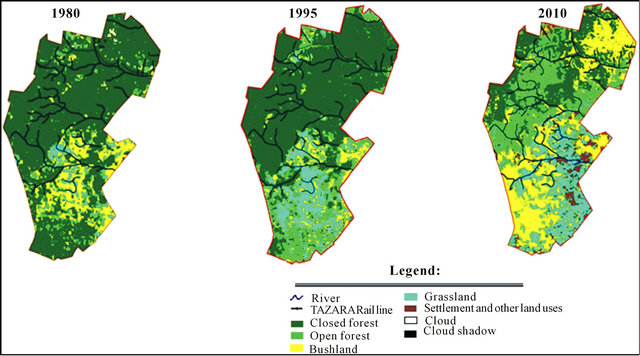
Figure 3. KFR land cover map for the year 1980, 1995 and 2010.
Table 2. Cover area, change area and annual rate of change between 1980 and 2010 for KFR.
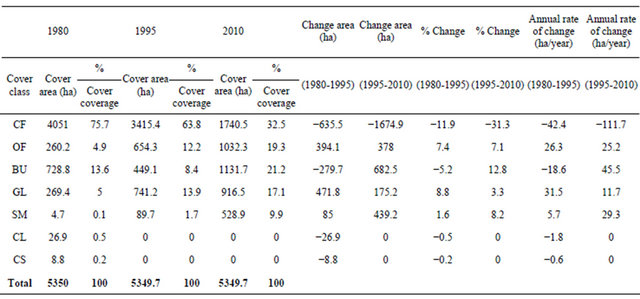
Note: CF = Closed Forest; OF = Open Forest; BU = Bushland; GL = Grassland; SM = Settlement and other land uses; CL = Cloud; CS = Cloud Cover.
in 2010, Closed forest occupied 1386.3 ha (57.4%), Open Forest 490.2 ha (20.3%), Bushland 311.9 ha (12.9%), Grassland 41.7 ha (1.7%), and Settlement and other Land uses 185 ha (7.7%).
During the period 1980-1995 (Table 3) closed forest decreased by 109.2 ha (−4.5%) and 611.1 ha (−25.3%) for the period 1995-2010. Similarly, in the period 1980- 1995, Settlement and other land uses increased by 75 ha (3.1%) and 100.2 ha (4.1%) between 1995 and 2010. The findings also show that between 1980 and 2010, Closed Forest decreased while Bushland, Grassland, Settlement and other land uses, and Open Forest increased.
Generally, during the periods 1980-1995 and 1995- 2010, the forest reserves have shown a significant degradation. Some of the activities that contributed to the degradation of the forest reserves include charcoal burning and logging [22], encroachment for agriculture and pole cutting [5] and expansion of farms within the forest reserves [23]. Also, [24] noted that land use and cover changes in PKFR’s has been driven by the impacts of climate change and variability which have intensified the resources extraction from the forest reserves.
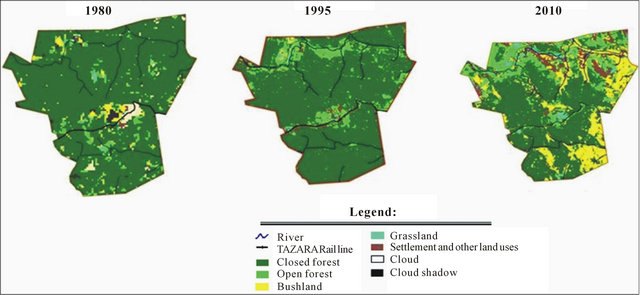
Figure 4. PFR land cover map for the year 1980, 1995 and 2010.
Table 3. Cover area, change area and annual rate of change between 1980 and 2010 for PFR.
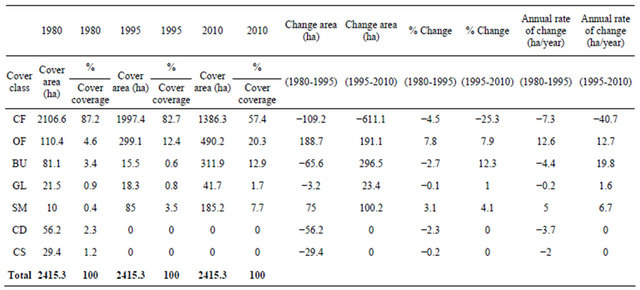
Note: CF = Closed Forest; OF = Open Forest; BU = Bushland; GL = Grassland; SM = Settlement and other land uses; CL = Cloud; CS = Cloud Cover.
3.4. Carbon Stock in PKFR
The results of carbon densities revealed that closed forest had highest mean carbon density than other cover classes. In KFR, the carbon density for Closed Forest was 2.29 tC/ha and 10.12 tC/ha for PFR. The results for other cover classes are summarized in Table 4. In KFR, the slightly higher mean carbon density in Grassland has been contributed by few big trees in the plots including Mangifera indica (Mwembe), Vitex doniana (Mfulu) and Cyphostemma sp (Mtamba). The study revealed that the overall mean carbon density for PFR and KFR were respectively 5.72 tC/ha and 0.98 tC/ha. Similarly, the 1980 carbon stock was found to be higher compared to 1995
Table 4. Carbon density for different cover classes in PKFR.
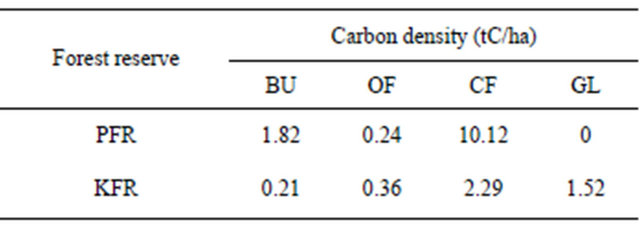
Note: BU = Bushland; OF = Open Forest; CF = Closed Forest; GL = Grassland.
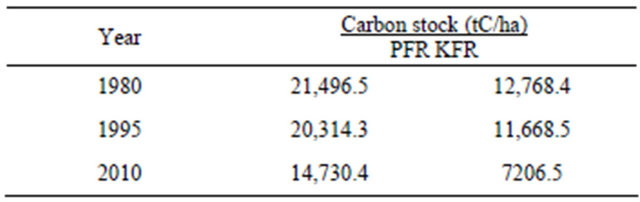
and 2010 for both forests. The study revealed that 1980 carbon stock in PFR was 21 496.5 tC/ha while in KFR was 12 768.4 tC/ha (Table 5). According to [25], the total carbon stock in living forest biomass in Tanzania was estimated at 2019 million tons.
3.5. Carbon Map
The carbon maps for KFR and PFR are presented in FigTable 5. Carbon stock for PKFR for the year 1980, 1995 and 2010.
ures 5 and 6. Generally, the study revealed that the mean carbon densities for PFR and KFR were respective 5.72 and 0.98 tC/ha. According to [26], the average carbon density of the remaining coastal forests in Tanzania is estimated to be 64 tC/ha. The contribution of PKFR’s to the overall carbon density of coastal forests seems to be lower. Likewise, the estimated carbon densities in the forest reserves were quite low as compared to 58 - 94 tC/ha for Arabuko Sokoke Coastal Forest of Kenya [27] and 16.5 tC/ha for Miombo Woodland of Kitulangalo forest reserve [28].
4. Conclusions
The study has revealed that the forest reserves condition have changed extensively between 1980 and 2010.
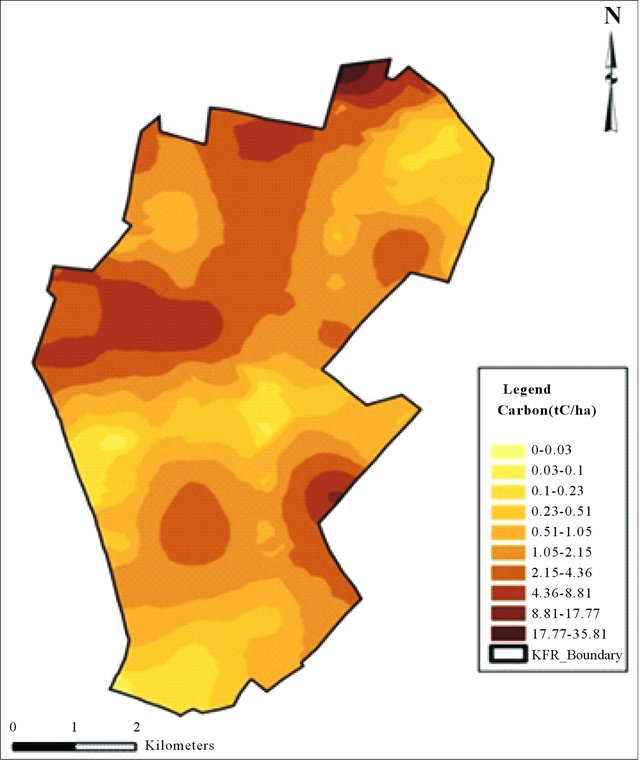
Figure 5. Carbon density map for KFR.
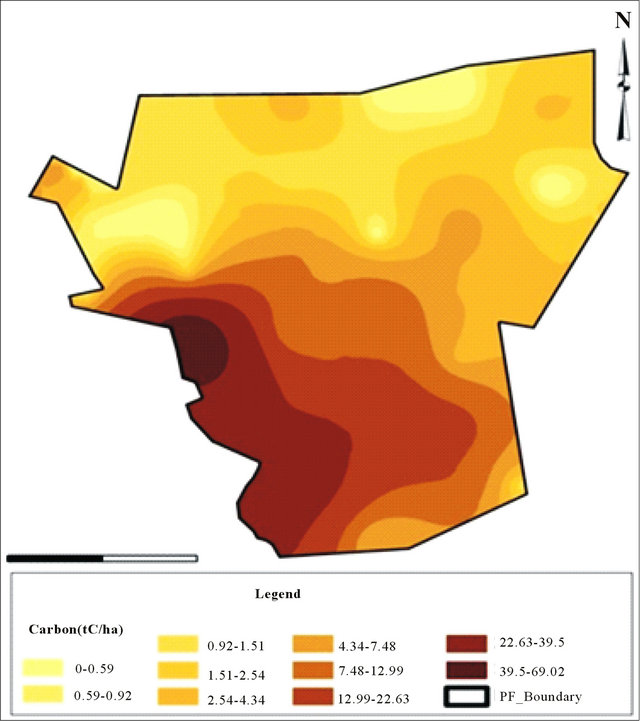
Figure 6. Carbon density map for PFR.
Closed Forest has decreased while Bushland, Grassland, Open Forest and Settlement and other land uses have increased. Between 1980 and 1995, and between 1995 and 2010, Closed Forest decreased by 11.9% and 31.3% respectively in KFR. During the same period, Closed Forest decreased by 4.5% and 25.3% respectively in PFR. The mean carbon densities were quite low, and estimated to 0.98 tC/ha and 5.72 tC/ha for KFR and PFR respectively. It was also revealed that FRs have shown potential in carbon storage estimated at 7206.46 tC and 14 730.41 tC for KFR and PFR respectively.
The low carbon densities were attributable to decline in area under Closed Forest in the two Forest Reserves. The study recommends concerted efforts to enhance proper management of the forests and increased environmental education to communities so that the two FR may contribute to REDD initiatives.
5. Acknowledgements
This research was supported by a NORAD funded research programme—Climate Change Impacts, Adaptation and Mitigation (CCIAM) of the Sokoine University of Agriculture through Analysis of the Impacts of Urban Land Use and Climate Change on Coastal Forest Ecosystem and Management research project.
REFERENCES
- T. Herzog, “World Greenhouse Gas Emissions in 2005,” WRI Working Paper, 2009. http://pdf.wri.org/working_papers/world_greenhouse_gas_emissions_2005.pdf
- M. Grieg-Gran, “Is Tackling Deforestation a Cost-Effective Mitigation Approach?” 2006. http://pubs.iied.org/
- R. A. Houghton, “Revised Estimates of the Annual Net Flux of Carbon to the Atmosphere from Changes in Land Use and Land Management,” Tellus, Vol. 55B, No. 2, 2003, pp. 378-390.
- N. Myers, R. A. Mittemeier, C. G. Mittemeier, J. Kent and A. B. Gustavo, “Biodiversity Hotspot for Conservation Priorities,” Nature, Vol. 403, No. 6722, 2000, pp. 853-858. doi:10.1038/35002501
- M. Hogqvist, S. Nummelin, M. Stahl and B. Miljoventenskap, “The View of Nature of Villagers in Kisarawe District,” The Department of Nature and Environment, Karlstad University, Karlstad, 1998.
- United Republic of Tanzania (URT), “National Bureau of Statistics,” Government Printers, Dar es Salaam, 2002.
- B. P. Mbilinyi, “Assessment of the Land Degradation and Its Consequences: Use of Remote Sensing and Geographical Information System Techniques. A Case Study in the Ismani Division, Iringa Region, Tanzania,” Ph.D. Thesis, Berlin Technical University, Berlin, 2000.
- J. J. Kashaigili and A. M. Majaliwa, “Integrated Assessment of Land Use and Cover Changes in the Malagarasi River Catchment in Tanzania,” Physics and Chemistry of the Earth, Vol. 35, No. 13-14, 2010, pp. 730-741. doi:10.1016/j.pce.2010.07.030
- A. Atesoglu and M. Tunay, “Spatial and Temporal Analysis of Forest Cover Changes in Bartin Region of NorthWest Turkey,” African Journal of Biotechnology, Vol. 9, No. 35, 2010, pp. 5676-5685.
- R. G. Congalton, “A Review of Assessing the Accuracy of Classifications of Remotely Sensed Data,” Remote Sensing Environment, Vol. 37, No. 1, 1991, pp. 35-46. doi:10.1016/0034-4257(91)90048-B
- M. Reusing, “Change Detection of Natural High Forests in Ethiopia Using Remote Sensing and GIS Techniques,” International Archives of Photogrammetry and Remote Sensing, Vol. XXXIII, Part B7, 2000, pp. 1253-1258. http://www.isprs.org/proceedings/xxxiii/congress/part7/1253_XXXIII-part7.pdf
- K. G. MackDicken, “A Guide to Monitoring Carbon Storage in Forest and Agroforestry Projects,” Winrock Internation Institute for Agricultural Development, Little Rock, 1997.
- National Forest Resources Monitoring and Assessment of Tanzania-NAFORMA, “Field Manual Biophysical Survey,” Forest and Beekeeping Division, Dar es Salaam, Tanzania, 2010.
- P. K. T. Munishi, “Principal of Forest Ecology. A Compendium-SUA,” 2005.
- E. Zahabu, “Sinks and Sources: A Strategy to Involve Forest Communities in Tanzania in Global Climate Policy,” Ph.D. Thesis, University of Twente, Enschede, 2008.
- P. K. T. Munishi and T. Shear, “Carbon Storage of Two Afromontane Rain Forests in the Eastern Arc Mountains of Tanzania,” Journal of Tropical Forest, Vol. 16, No. 1, 2004, pp. 78-93.
- E. F. Haule and F. C. Munyuku, “National Forest Inventory in Tanzania,” In: R. E. Malimbwi and E. J. Luoga, Eds., Proceedings of the workshop on Information Acquisition for Sustainable Natural Forest Resources of Eastern, Central and Southern Africa, Faculty of Forestry, SUA, Morogoro, 1994, pp. 99-113.
- S. Brown, “Measuring, Monitoring and Verification of Carbon Benefits for Forest Based Projects,” In: I. R. Swingland, Ed., Capturing Carbon and Conserving Biodiversity: The Market Approach, Earthscan Publications Ltd., London, 2003, pp. 118-133.
- H. K. Gibbs, S. Brown, J. O. Niles and J. A. Foley, “Monitoring and Estimating Tropical Forest Carbon Stocks: Making REDD a Reality,” Environmental Research Letter, Vol. 2, No. 4, 2007, p. 13.
- D. Huaqiang, Z. Guomo, F. Wenyi, G. Hongli, X. Xiaojun, S. Yongjun and F. Weiliang, “Spatial Heterogeneity and Carbon Contribution of Aboveground Biomass of Moso Bamboo by Using Geostatistical Theory,” Plant Ecology, Vol. 207, No. 1, 2010, pp. 131-139. sdoi:10.1007/s11258-009-9659-3
- S. O. Turan, A. I. Kodiogullari and A. Gunlu, “Spatial and Temporal Dynamics of Land Use Pattern Response to Urbanization in Kastamonu,” African Journal of Biotechnology, Vol. 9, No. 5, 2010, pp. 640-647.
- A. Ahrends, “Patterns of Degradation in Lowland Coastal Forests in Coast Region, Tanzania,” MSc Thesis, Greifswald University, Greifswald, 2005.
- I. O. E. Malugu, “Resources-Use Conflicts and Management Challenges for Pugu and Kazimzumbwi Forest Reserves in Kisarawe and Ilala Districts, Tanzania,” Discovery and Innovation, Vol. 19, No. 1-2, 2007, pp. 149- 174. doi:10.4314/dai.v19i1-2.15781
- M. V. Mdemu, J. J. Kashaigili, J. Lupala, P. Levira, E. Liwenga, A. Nduganda and F. Mwakapuja, “Dyanamics of Land Use and Land Cover Changes in the Pugu and Kazimzumbwi Forest Reserve,” IULUCC Project, Ardhi University, Dar Es Salaam, 2012.
- FAO, “State of the World’s Forests,” Rome, 2011.
- F. L. Godoy, K. Tabor, N. D. Burgess, B. P. Mbilinyi, J. J. Kashaigili and M. K. Steininger, “Deforestation and CO2 Emissions in Coastal Tanzania from 1990 to 2007,” Environmental Conservation, Vol. 39, No. 1, 2011, pp. 62- 71. doi:10.1017/S037689291100035X
- G. Julia, “Carbon Storage and Emissions Offset Potential in an African Dry Forest, the Arabuko-Sokoke Forest, Kenya,” Environmental Monitoring and Assessment, Vol. 142, No. 1-3, 2008, pp. 85-95.
- R. E. Malimbwi, B. Solberg and E. Luoga, “Estimation of Biomass and Volume in Miombo Woodland at Kitulangalo Forest Reserve,” Tanzania Journal of Tropical Forest Science, Vol. 7, No. 2, 1994, pp. 230-242.
NOTES
*Corresponding author.