International Journal of Nonferrous Metallurgy
Vol.07 No.04(2018), Article ID:88239,17 pages
10.4236/ijnm.2018.74004
The Kinetics of Pb Removal from Brass Scrap Using Compound Separation
Hidekazu Sueyoshi1*, Masashi Miyazaki2, Takuya Okada2, Nobuyuki Ashie2, Yoshiharu Kousaka2
1Graduate School of Science and Engineering, Kagoshima University, Kagoshima, Japan
2San-Etsu Metals Co. Ltd., Tonami, Japan

Copyright © 2018 by authors and Scientific Research Publishing Inc.
This work is licensed under the Creative Commons Attribution International License (CC BY 4.0).
http://creativecommons.org/licenses/by/4.0/


Received: October 13, 2018; Accepted: October 28, 2018; Published: October 31, 2018
ABSTRACT
2 wt% Ca was added to molten brass containing 3.2 wt% Pb. The composition and grain size of the formed Ca-Pb compound were examined in detail using SEM-EDS and XRD. This revealed that the composition of the Ca-Pb compound depends on the grain size of the liquid phase Pb and the diffusion phenomenon of the Ca in the Ca-Pb compound formed on the surface of the Pb. When the Pb has a fine grain, a compound composed only of Ca-Pb compounds is formed. When the grain size of the Pb is several μm, Ca-Pb compounds containing unreacted Pb in the center are formed. These compounds aggregate into a larger compound grain. From the evaluation of the floating force (the resultant force of the weight and buoyancy of the Ca-Pb compounds formed) and the rising terminal velocity of the Ca-Pb compound within the molten brass, it was found that the floating force and rising terminal velocity depend on the composition and grain size of the Ca-Pb compound. It was found that since Ca-Pb compounds with a floating force greater than 10−6 g∙cm/s2 have a very large rising terminal velocity, they reach the surface of the molten brass in a short time after compound formation and then continue to float on the surface of the molten brass. Thus they can be removed by skimming. The effects of the grain size of the Ca-Pb compound on the floating force and the rising terminal velocity were greater than those of the composition of the Ca-Pb compound.
Keywords:
Lead Removal, Brass Scrap, Compound Separation, Kinetics

1. Introduction
Brass alloys are characterized by high thermal and electric conductivity as well as high antibacterial properties. Brass alloys containing Pb have better machinability than other metallic materials because the added Pb significantly reduces the tool wear and cutting force required to work it while producing excellent chip breakage action. However, Pb has been recognized as being harmful to human health. In Japan, the permitted level of Pb that can be leached into drinking water supplies was revised to 0.01 mg/L in April 2003 [1] . In the European-based REACH program, the limit of the Pb contained in brass alloys has been decreased 0.5 wt% from June 2016 [2] . In the USA, the Pb content in water-bearing materials has been limited to 0.25 wt% since 2014 [3] .
Brass alloys have generally been manufactured by recycling brass alloy scrap. An important issue regarding sustainability is how to use as much recycled brass as possible. The simplest method to reduce the Pb in a brass alloy is to dilute the molten brass by adding virgin Pb-free materials. However, the accumulation of large amounts of unrecycled scrap is presenting a problem for sustainability. For this reason, dilution method confuses the recycling system functioning at present. There are several Pb removal methods, such as electrolytic decomposing [4] and pyrometallurgical decomposing [5] . However, a large scale additional infrastructure is needed at most brass mills when they try to introduce these methods. A method for Pb removal by compound separation using Ca-Si compound and NaF addition was first reported by the authors et al. [6] [7] . This method has the great practical advantage that additional infrastructure is unnecessary. In addition, the authors et al. also reported on the lifecycle assessment (LCA) of manufacturing Pb-free copper alloys [8] . It was found from LCA analysis that the conversion of the conventional system that uses virgin materials to a new system that uses recycled Pb-free copper alloy decreases environmental impacts. The mechanism of Pb removal from brass scrap by compound separation using Ca and NaF was later reported by the authors et al. [9] . On the other hand, Hilgendorf et al. reported performing Pb removal by a fluorine-free method adding Ca alone [5] . According to their results, the actual Pb removal rate obtained using an experimental furnace was about 20%, although the theoretical Pb removal rate calculated for a Cu-Zn-Pb-Ca-O system using thermochemical simulation software was 96%. This suggests that further elucidation of the mechanism for the formation and removal of Ca-Pb compound is needed to achieve a high Pb removal rate using a fluorine-free method. However, there are not many reports about Pb removal using compound separation. There are also many unclear points outstanding.
According to the results reported to date [5] [6] [7] [9] , the Pb removal rate is about 20% in the case of the addition of a Ca-Si compound or Ca alone and it increases to 83% with the subsequent addition of NaF. It is considered that the Pb removal rate depends on the characteristics of the produced Ca-Pb compound and its resulting buoyancy. However, the mechanisms of the formation of Ca-Pb compounds and the kinetics of Ca-Pb compounds in molten brass have not yet been fully elucidated. Clarification of the effects of the composition and the grain size of Ca-Pb compounds on its buoyancy would enable further development of methods for Pb removal by compound separation. Mechanisms for the formation of Ca-Pb compounds and the kinetics of the Ca-Pb compound in the molten brass were therefore investigated in the present study.
2. Experimental
Brass scrap (chemical composition: 59.6 wt% Cu, 3.2 wt% Pb, 0.3 wt% Sn, 0.16 wt% Fe, 0.05 wt% Ni, and bal. Zn, ingot weight: 30 kg) was melted using a graphite crucible (235 mm inner diameter, 150 mm bottom diameter and 310 mm height (Nippon Crucible, Tokyo, Japan)) in a 6 - 9 kHz induction furnace (MELT-COMP-80K, Tamagawa Engineering, Fukushima, Japan) in the atmosphere. The temperature was measured using an inset type of optical fibre pyrometer (FIMTHERM-HM, Seiyo Industry, Yokohama, Japan). A Ca-cored brass wire containing 2 wt% Ca (13.6 mm outer diameter and 12.8 mm inner diameter (WING ON, Tokyo, Japan)) was injected to the molten brass at 930˚C. Then stirring was carried out for 1 min, followed by holding (without stirring) for 5 min. Small sample disks, 40 mm in diameter and 25 mm in thickness, were produced for chemical composition analysis after three different stages post melting: after the addition of Ca and subsequent stirring for 1 min, and after holding (without stirring) for 5 min. The small sample disks were produced by partial casting using a ladle and metal molds. The microstructure of the small sample disks was examined using scanning electron microscopy-energy dispersive X-ray spectroscopy (SEM-EDS) (SEM; JSM-7001F, JEOL, Tokyo, Japan, EDS; INCAx-act, Oxford Instruments, Oxfordshire, United Kingdom) and X-ray diffraction (XRD) (Smart Lab 9 kW, Rigaku, Tokyo, Japan) with Cu-Kα radiation. The electric voltage and current applied to the X-ray tube used for XRD were 45 kV and 200 mA, respectively. The scanning rate and step angle were 50˚/min and 0.02˚, respectively. The chemical composition of the small sample disk was examined using X-ray fluorescence (XRF) (Simultix 14, Rigaku, Tokyo, Japan).
3. Results and Discussion
3.1. Characteristic of Ca-Pb Compounds
Figure 1 shows the SEM-EDS results for a small sample disk produced by partial casting after melting brass scrap. It was found from EDS area analysis that the white region in the BSE image is Pb. Pb grains were smaller than 3 μm and sub-μm grains were also present.
Figure 2 shows the XRD profile of a small sample disk produced by partial casting after melting brass scrap. α-phase brass [10] , β-phase brass [11] and Pb [12] were identified. The intensity ratio of each plane peak for the α-phase and β-phase brass was somewhat different from that obtained using the powder method. This is because the cast structure consists of preferred-oriented crystal grains.
Figure 3 shows the SEM-EDS results for a small sample disk produced immediately after the addition of Ca and subsequent stirring. Cu, Zn, Ca, Pb, Sn and O were detected in the white region in the SE image. There was no region where
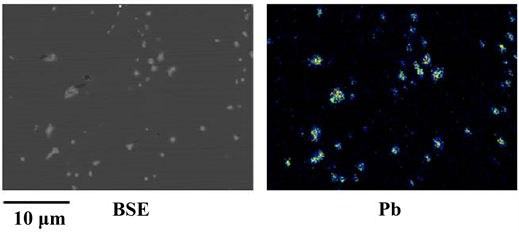
Figure 1. SEM-EDS results for a small sample disk produced by partial casting after melting brass scrap.
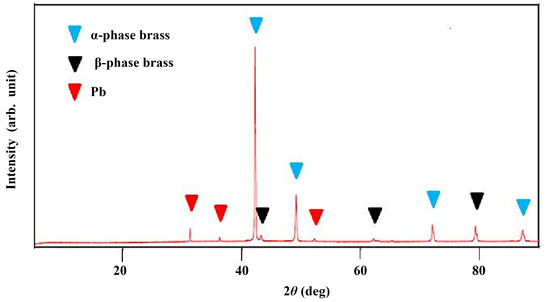
Figure 2. XRD profile of a small sample disk produced by partial casting after melting brass scrap.
only Pb was detected. Ca was always detected in the region where Pb was detected. This suggests that a Ca-Pb compound was formed and Cu, Zn, Sn and O were present in it. Fine Ca-Pb compound having a grain size of 1 μm or less was not observed. The grain size of most of the Ca-Pb compounds was in the range of several μm to 30 μm. This suggests that aggregation of Ca-Pb compounds occurred. It is thought that Ca-Pb compounds larger than 30 μm floated on the surface of the molten brass. On the other hand, the concentration of Ca in the small sample disk measured using XRF was 1.59 wt%. The concentration of Ca is due to the presence of both Ca-Pb compound and excess Ca. It was found from Figure 3 that excess Ca was dissolved in the β-phase brass (the region where Ca, Cu and Zn are detected but no Pb is detected) during solidification. The 0.41 wt% Ca consumed is due to a small amount of CaO [9] that was produced and Ca-Pb compound that floated on the surface of the molten brass.
Figure 4 shows the SEM-EDS results for a small sample disk produced after holding (without stirring) for 5 min. As shown in the SE image, the huge Ca-Pb compound observed in Figure 3 disappeared and the grain size of most of the
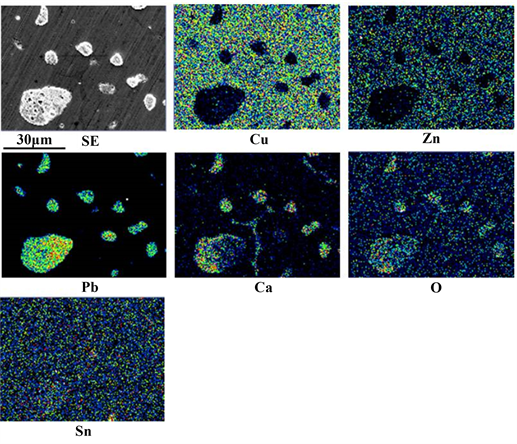
Figure 3. SEM-EDS results for a small sample disk produced immediately after Ca addition and subsequent stirring.
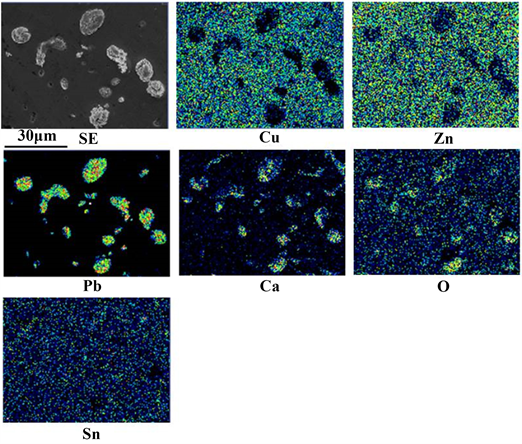
Figure 4. SEM-EDS results for a small sample disk produced after holding (without stirring) for 5 min.
Ca-Pb compounds was in the range of several μm to 10 μm. The results of area analysis were similar to those shown in Figure 3.
Figure 5 shows the XRD profile of a small sample disk produced after holding (without stirring) for 5 min. α-phase brass, β-phase brass, Pb, Ca5Pb3 [13] , CaZn2 [14] , CaNi2 [15] and CaNi3 [15] were identified. The intensity ratio of each plane peak for the α-phase and β-phase brass was somewhat different from that obtained using the powder method. This is because the cast structure consists of preferred-oriented crystal grains. The intensity ratio (Pb/α-phase brass) of the highest peak for Pb and α-phase brass was lower than that shown in Figure 2. This suggests that the Pb content is lower than that of post melting. Liquid phase Pb did not aggregate in the molten brass as shown in Figure 1. It is believed that likewise liquid phase Ca-Pb compound does not aggregate. Aggregation of the Ca-Pb compound was observed as shown in Figure 3. This suggests that solid phase Ca-Pb compounds were produced in the molten metal. According to the Ca-Pb equilibrium phase diagram [16] , Ca2Pb, Ca5Pb3 and CaPb can exist as a solid phase at 930˚C. However Ca2Pb [17] and CaPb [17] could not be clearly identified as shown in Figure 5. Hilgendorf et al. reported that according to a thermochemical simulation for a Cu-Zn-Pb-Ca-O system, CaPb was chiefly formed by the addition of 0.7 wt% Ca, Ca5Pb3 was formed by adding 1.5 wt% Ca and Ca2Pb by 1.8 wt% Ca and furthermore from SEM-EDS analysis, the Ca/Pb ratio of the Ca-Pb compound formed by 1.5 wt% Ca addition was close to the stoichiometric Ca/Pb ratio (1.67) of Ca5Pb3 [5] . The authors et al. reported that XRD analysis of the slag skimmed from the surface of the molten brass after the addition of 2 wt% Ca revealed that Ca2Pb was formed in the molten brass, then Ca2Pb was oxidized during air cooling after skimming off, resulting in the formation of Ca2PbO4 [9] . Therefore the result that Ca2Pb and CaPb could not be clearly identified, as shown in Figure 5, does not mean that these Ca-Pb compounds were not formed. It is thought likely to be due to a small amount of these Ca-Pb compounds, that is, an amount less than XRD detection sensitivity. As shown in Figure 3 and Figure 4, a region of only Pb was
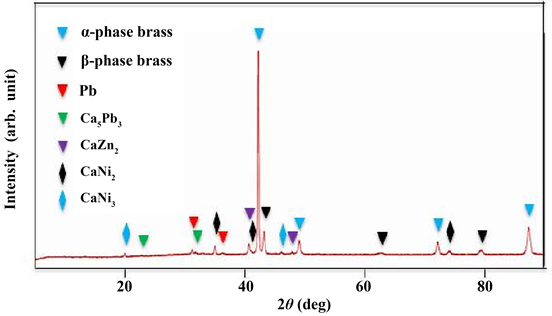
Figure 5. XRD profile of a small sample disk produced after holding (without stirring) for 5 min.
not found and Ca was always detected in a region where Pb was detected. In Figure 5, the peaks of Ca-Pb compound and Pb were detected. These results suggest that unreacted Pb is present in the Ca-Pb compound. According to the thermochemical simulation of the Cu-Zn-Pb-Ca-O system by Hilgendorf et al., the Ca-Zn intermetallic phase is stable at 810˚C or lower when excess Ca is present [5] . In the present study, CaZn2, CaNi2 and CaNi3 were identified as shown in Figure 5. However, the intensity ratio of each plane peak for the compounds was somewhat different from that obtained using the powder method. These compounds are considered to have formed during casting.
EDS quantitative analyses were carried out at 8 sites in a large Ca-Pb compound (Figure 3) having a grain size of about 30 μm and on the center of 15 Ca-Pb compounds with a grain size of about 10 μm. Figure 6 shows the relationship between the Cu and Zn concentrations. Regardless of the grain size of the Ca-Pb compound, a linear relation was established between the Cu and Zn concentrations. The ratio of Zn concentration to Cu concentration (that is, the slope of the straight line) was 0.51, which almost agreed with the value (0.59) of the Zn/Cu ratio obtained using XRF. This suggests that molten brass occupies the space between aggregating Ca-Pb compound grains. As shown in Figure 6, the amount of molten brass in the Ca-Pb compound with a grain size of 30 μm was smaller than that in the Ca-Pb compound with a grain size of 10 μm. From this, it is considered that the aggregated Ca-Pb compound with a grain size of 30 μm was formed by aggregation of many Ca-Pb compound particles smaller than the Ca-Pb compound particles constituting the aggregated Ca-Pb compound with a grain size of 10 μm.
Figure 7 shows the relationship between the Pb and Ca concentrations. The straight lines show the stoichiometric relationships between Pb and Ca concentrations in Ca2Pb, Ca5Pb3 and CaPb. The measured values were located under the
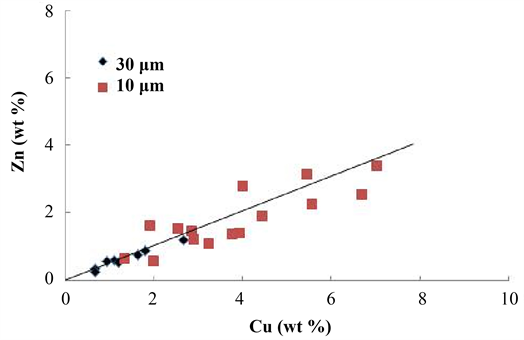
Figure 6. The relationship between the Cu and Zn concentrations for the Ca-Pb compounds.
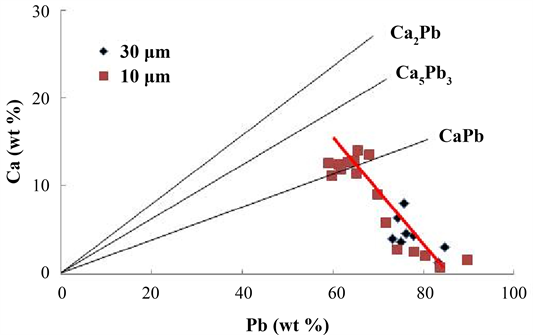
Figure 7. The relationship between the Pb and Ca concentrations for the Ca-Pb compounds.
straight lines of Ca2Pb and Ca5Pb3. This result does not mean that Ca2Pb and Ca5Pb3 were not produced. Rather, is because unreacted Pb was present in the Ca-Pb compound, as mentioned above. As indicated by the red line in Figure 7, Ca concentration tended to decrease with increasing Pb concentration. This is considered to be due to the fact that unreacted Pb remains in the center of the Ca-Pb compound, and the amount of unreacted Pb increases relatively as the amount of the Ca-Pb compound formed on the surface is small.
Figure 8 shows the relationship between the Cu and Sn concentrations. There was no clear relationship between these. Sn concentration shown in Figure 8 was an order of magnitude larger than that obtained using XRF. This suggests that most of measured Sn is not due to brass alloy which occupies the space between aggregated Ca-Pb compound grains.
Figure 9 shows the relationship between the Ca and Sn concentrations. A linear relation was found between the Ca and Sn concentrations. The ratio of Ca to Sn, that is, the slope of the straight line, was 7.5. According to the Ca-Sn equilibrium phase diagram [18] , Ca2Sn and CaSn can exist as a solid phase at 930˚C. The stoichiometric ratios (Ca/Sn) of Ca2Sn and CaSn were 0.67 and 0.34, respectively. The slope of the straight line shown in Figure 9 was one order of magnitude larger than these values. However, no Ca-Sn compound peak was detected, as shown in Figure 5. On the other hand, a solid solution (0.42 wt%) of Sn in only β-phase brass was revealed by EDS quantitative analysis. These results suggest that no reaction between Ca and Sn occurs but some of the Sn is dissolved in the Ca-Pb compound and that the remaining Sn forms a solid solution in the β-phase brass during the solidification process. As shown in Figure 9, the Sn concentration increased roughly proportionally with the increasing Ca concentration or the amount of the Ca-Pb compound. This suggests that there is a solubility limit.

Figure 8. The relationship between the Cu and Sn concentrations for the Ca-Pb compounds.
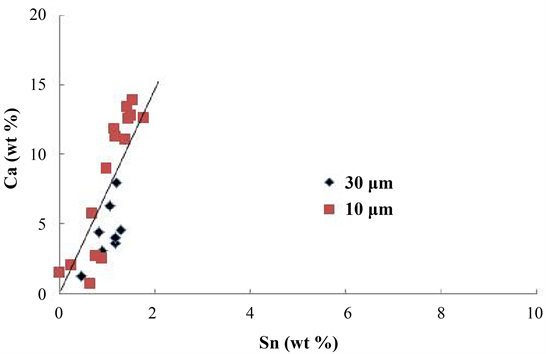
Figure 9. The relationship between the Ca and Sn concentrations for the Ca-Pb compounds.
Figure 10 shows the relationship between the Ca and O concentrations. There was no clear relationship between these. The authors et al. have reported that XRD analysis of the slag skimmed from the surface of the molten brass after the addition of 2 wt% Ca revealed that Ca2Pb was formed in the molten brass, and then Ca2Pb was oxidized during air cooling after skimming, resulting in the formation of Ca2PbO4 [9] . According to the phase diagram for a Ca-Pb-O system [19] at 827˚C, when the oxygen chemical potential ΔμO2 is lower than −220 kJ/mol, ΔμO2 is from −50 to −220 kJ/mol and ΔμO2 from 0 to −50 kJ/mol, equilibrium phases are CaO + Pb, CaO + PbO and CaO + Ca2PbO4 (a low Pb mole
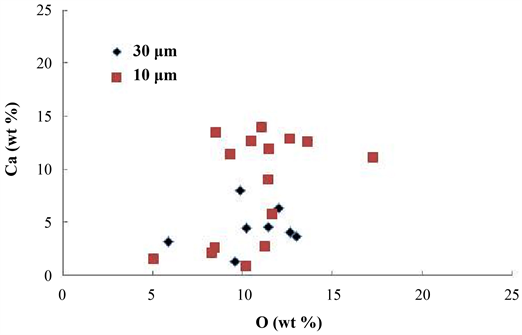
Figure 10. The relationship between the Ca and O concentrations for the Ca-Pb compounds.
fraction) or Ca2PbO4 + PbO (a high Pb mole fraction), respectively. Therefore, it is thought that the equilibrium phase in the molten brass is CaO + Pb and that Ca2PbO4 is not formed in the molten brass. The existence of CaO in the slag has been confirmed by XRD [9] . If an oxide based on a Ca-Pb-O system is formed by the addition of Ca, instead of a Ca-Pb compound, a proportional relationship (a stoichiometric relationship) should be established between the Ca and O concentrations. However, no such relationship was found as shown in Figure 10. Furthermore, no Ca-Pb-O system oxide peak was detected as shown in Figure 5. These findings suggest that the presence of O in the Ca-Pb compound is due to fine grains of CaO which contaminated together with the molten brass, filling the space between aggregated Ca-Pb compound grains.
3.2. Mechanism for the Formation of Ca-Pb Compounds
A schematic illustration of the central cross section of a Ca-Pb compound based on the XRD and SEM-EDS results is shown in Figure 11. Some of the added Ca is consumed as CaO, but the amount is very small. The concentration of Ca in the molten brass gradually increases with the injection of more Ca. According to the thermochemical simulation by Hilgendorf et al., CaPb is the chief compound formed by the addition of 0.7 wt% Ca [5] . Therefore, when the grain size of liquid phase Pb is sub-μm, at first, CaPb may be formed. It is thought that as the concentration of Ca in the molten brass gradually increases, the CaPb transforms into Ca5Pb3 at a Ca concentration of 1.5 wt% and then transforms into Ca2Pb at a Ca concentration of 1.8 wt%. Then, finally, a single phase compound consisting entirely of Ca2Pb is formed as illustrated in Figure 11(a). The diffusion of atoms in intermetallic compounds takes place via vacancies [20] . Since the atomic radius of Ca (0.174 nm) is greater than that of both Pb (0.147 nm) and Sn (0.140 nm), the diffusion rate of Ca toward the center of a Ca-Pb compound is
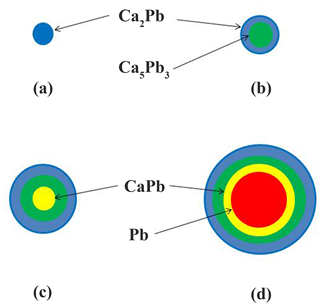
Figure 11. Schematic illustration of the central cross section of a Ca-Pb compound.
likely to be low. Also, since diffusion depth is proportional to the half power of time, the diffusion depth is also likely small as the holding time is short. Therefore, when the size of the Pb is slightly larger, a dual phase compound containing Ca5Pb3 in the center may be formed as shown in Figure 11(b). Furthermore, as the grain size of the Pb increases still more, the CaPb will remain in the center, resulting in the formation of a tri-phase compound as shown in Figure 11(c). When the grain size of the Pb is several μm, unreacted Pb will remain in the center, and specific compound is thought to be formed, as shown in Figure 11(d). Thus, since the composition of the Ca-Pb compound depends on the diffusion of Ca atoms moving inward through the Ca-Pb compound formed on the surface of the Pb, the specific composition will vary, depending largely on the grain size of the Pb. Generally, the smaller the particle size, the larger its surface energy becomes, so it tends to aggregate more actively. That is why the aggregation of the small Ca-Pb compounds shown in Figures 11(a)-(c) occurs. Even a relatively large Ca-Pb compound, as shown in Figure 11(d), it is considered that aggregation occurs via small Ca-Pb compounds such as Figures 11(a)-(c). The findings that the Pb concentration in large aggregated Ca-Pb compounds with grain sizes of 10 and 30 μm was larger than the chemical stoichiometric values of a Ca-Pb compound (Figure 7) and that Pb was identified in XRD profile (Figure 5) are considered to be due to the composition of the Ca-Pb compound, as shown in Figure 10. Sn forms a solid solution in the Ca-Pb compound, as mentioned above. It is thought that the possibilityof forming the Ca-Pb compound (Figure 11(d)) containing unreacted Pb in the center increases because the diffusion rate of Ca in the Ca-Pb compound decreases due to the Sn solid solution.
3.3. The Kinetics of Ca-Pb Compounds in Molten Brass
Assuming the Ca-Pb compound to be a sphere, the resultant force (floating force) of the weight and buoyancy of a Ca-Pb compound is expressed by the following equation, when the upward direction is positive [21] ,
F = (ρf − ρs) vg (1)
v = 4 π (D/2)3/3 (2)
where F is the floating force, ρf is the density of the molten brass (7.22 g/cm3 at 930˚C) [22] , ρs is the density of the Ca-Pb compound, v and D are the volume and diameter of the Ca-Pb compound, and g is gravitational acceleration. F becomes positive when the value of ρs is less than that of ρf, resulting in the rise of the Ca-Pb compound. The densities of solid phase Ca2Pb, solid phase Ca5Pb3, solid phase CaPb, liquid phase Pb (680˚C) and solid phase NaF are 4.8 [23] , 5.1 [23] , 6.8 [23] , 10.2 [24] and 2.79 g/cm3, respectively. Table 1 shows the type, composition, value of (ρf − ρs) and value of F for various Ca-Pb compounds. In addition to the four types (a - d) shown in Figure 10, a Ca-Pb compound produced by mixed aggregation is indicated by type A. The values for Ca-Pb compound produced by mixed aggregation of the three types (a, b and c) are thought to be in the range of the values for type a to the values for type c, depending on the composition ratio. For a composite Ca-Pb compound formed by the subsequent NaF addition, the symbol of F was added after the type symbol. The number before the material symbol for the composition of Ca-Pb compounds indicates the volume fraction (vol%). Regarding the composition of type A, Ca2Pb was used as the representative of a multiphase Ca-Pb compound. The molten brass, CaO and Sn existing in the Ca-Pb compound were ignored.
When the Reynolds number of a fluid is less than 2, the rising terminal velocity of a sphere and the time until the Ca-Pb compound reach the surface of the molten brass from the bottom of the crucible are expressed by the following equations [21] ,

Table 1. The type, composition, value of (ρf − ρs) and value of F for various Ca-Pb compounds.
Vt = g∙D2 (ρf −ρs)/18μ (3)
Tt = H/Vt (4)
where Vt is the rising terminal velocity of a sphere and μ is a viscosity of the molten brass (3.49 × 10⁻³ g/(cm∙s) at 930˚C) [22] , Tt is the time until the Ca-Pb compound reaches the surface of the molten brass from the bottom of the crucible, and H is the height of the molten brass (18 cm). Differences in surface tension were ignored. Table 2 shows the values of Vt and Tt. When the Ca-Pb compound is formed and then begins to rise in the molten brass, the rising terminal velocity (constant velocity) is not immediately reached; it takes time. Therefore, the time until the compound actually reaches the surface of the molten brass is longer than the value of Tt in Table 2. Since electromagnetic molten brass flow in which the molten brass continuously flows upward near the center of the induction furnace and downward near the furnace wall exists, the value of Vt near the center of the furnace is greater than that in Table 2, while the opposite is the case near the furnace wall.
Since the value of (ρf − ρs) is positive when the whole grain consists of a Ca-Pb compound (of type a, b or c), these compounds rise in the molten brass. However, when the grain size of the Ca-Pb compound is small, it takes a longer time to reach the surface of the molten brass because of the small Vt (Table 2). Therefore, it is thought that these compounds tend to aggregate with each other into a large compound for the purpose of reducing a large surface energy. It is believed that the aggregated Ca-Pb compounds that have a D larger than 10 μm reach the surface of the molten brass in a short time (Table 2) because of their large Vt and then they continue to float on the surface of the molten brass because of their large F (greater than 10−6 g∙cm/s2). This is very convenient for the removal of Pb from the molten brass. The reason that the compounds larger than 10 μm and consisting of Ca-Pb compound alone were absent, as shown in Figure 3, Figure 4 and Figure 7, is due to this phenomenon.
In the case of Ca-Pb compounds that contain unreacted Pb in the center, the value of (ρf − ρs) of a Ca-Pb compound containing 25 vol% Pb (type d1) was positive, but when one contained 40 vol% Pb (type d2) the value was negative. This is due to the large amounts of heavy Pb. It is thought that even when D is 10 μm, a Ca-Pb compound containing 25 vol% Pb does not float on the surface of the molten brass, due to its small F value (less than 10−6 g∙cm/s2). It returns back into the molten brass, due to the electromagnetic molten brass flow. The reason that only Ca-Pb compound containing unreacted Pb and also with a D less than 10 μm was observed, as shown in Figure 3, Figure 4 and Figure 7, is due to this phenomenon. On the other hand, it is believed that when D is 30 μm, types d1 and d2 float on the surface of the molten brass, due to their large F values (greater than 10−6 g∙cm/s2). Thus, it is believed that Ca-Pb compounds with F values greater than 10−6 g∙cm/s2 continue to float on the surface of the molten brass, while Ca-Pb compounds with F values less than 10−6 g∙cm/s2 return back into the molten brass due to the electromagnetic molten brass flow.
Table 2. The values of Vt and Tt for various Ca-Pb compounds.
*The compositions of types d2 and A3 are the same as Table 1.
In the case of aggregated Ca-Pb compounds that are mixed with types a, b, c and d, the value (ρf − ρs) of 50 vol% Pb (type A3) was negative. Even in the case of 30 vol% Pb (type A1) and 40 vol% Pb (type A2), the values of F were low (less than 10−6 g∙cm/s2) when D was 10 μm. Therefore, these compounds thought to return back into the molten brass without floating. However, it is thought that when D is 30 μm, the Ca-Pb compounds continue to float on the surface of the molten brass due to their large F values (greater than 10−6 g∙cm/s2).
The values (ρf − ρs) of types dF and A3 containing a large amount of Pb were negative. However, the values (ρf − ρs) of composite Ca-Pb compounds with the light NaF (types dF, AF1 andAF2) were positive. Even when D was 10 μm, the value of F for type AF1 was close to 10−6 g∙cm/s2. When D is 30 μm, these compounds continue to float on the surface of the molten brass because of their large F values (larger than 10−6 g∙cm/s2). In the case of dF and AF2, it is considered that even when D is 10 μm, these compounds float on the surface of the molten brass because of their large F values (larger than 10−6 g∙cm/s2). The Pb removal rate can be improved by subsequent NaF addition [7] [9] . This is due to the formation of light composite Ca-Pb compounds containing NaF, as mentioned above. Table 2 shows that huge aggregated compounds with D of 30 μm reach the surface of the molten brass within several seconds, regardless of the composition of the Ca-Pb compounds. They continue to float on the surface of the molten brass because of F values greater than 10−6 g∙cm/s2, making skimming off them possible. Thus, the effect of grain size on the kinetics of Ca-Pb compound is larger than that of the composition of the Ca-Pb compound.
4. Conclusion
It was revealed that the composition of Ca-Pb compound depends on the grain size of liquid phase Pb and the diffusion of Ca migrating inward through the Ca-Pb compound that forms on the surface of the Pb. In the case of a fine Pb grain, the whole grain consists of a Ca-Pb compound, whereas in the case of a large Pb grain (several μm in size) a Ca-Pb compound containing unreacted Pb in the center is formed. The Ca-Pb compounds aggregate with each other into a larger compound grain. It was revealed that whether the Ca-Pb compound floats on the surface of the molten brass depend on the magnitude of a floating force. Because a Ca-Pb compound whose floating force is less than 10−6 g∙cm/s2 does not have a sufficient floating force, once it rises near the surface of the molten brass, it returns back into the molten brass, due to the electromagnetic molten brass flow. Therefore, it is difficult to simply skim off these Ca-Pb compounds. A Ca-Pb compound with a floating force greater than 10−6 g∙cm/s2 has a large rising terminal velocity and therefore reaches the surface of the molten brass in a short time. Moreover, it keeps on floating because of its large floating force. In particular, Ca-Pb compounds with a large grain size (30 μm) have a greater floating force than 10−6 g∙cm/s2 and a large rising terminal velocity, regardless of their compositions. Since they continue to float on the surface of the molten brass, it is easy to remove these compounds by skimming. Thus, it was revealed that the effects of the grain size of the Ca-Pb compound on the floating force and the rising terminal velocity are greater than that of the composition of the Ca-Pb compound. It is due to such kinetics that a Pb removal rate of about 20% was achieved by the addition of Ca alone. The reason that a Pb removal rate close to the theoretical value can be achieved by further addition of NaF is that a light composite Ca-Pb compound containing NaF is formed and that it tends to float on the surface of the molten brass, due to its large floating force and large rising terminal velocity. For a fluorine-free Pb removal method, it will be important to develop a new technology to increase the floating force and the rising terminal velocity of not only aggregated Ca-Pb compounds consisting of Ca-Pb compounds alone but also of aggregated Ca-Pb compounds containing unreacted Pb in the center.
Acknowledgements
This work was supported by the Ministry of Economy, Trade and Industry of Japan under a Grant [The energy-saving recycling process support project].
Conflicts of Interest
The authors declare no conflicts of interest regarding the publication of this paper.
Cite this paper
Sueyoshi, H., Miyazaki, M., Okada, T., Ashie, N. and Kousaka, Y. (2018) The Kinetics of Pb Removal from Brass Scrap Using Compound Separation. International Journal of Nonferrous Metallurgy, 7, 39-55. https://doi.org/10.4236/ijnm.2018.74004
References
- 1. Japan Foundry Engineering Society (2002) Chuzo-Kogaku Binran. Maruzen, Tokyo, 473-474. (In Japanese)
- 2. European Commission (2015) Commission Regulation (EU) 2015/628 Amending Annex XVII to Regulation (EU) No 1907/2006 of the European Parliament and of the Council on the Reaction, Evaluation, Authorization and Restriction of Chemicals (“REACH”) as Regard Lead Its Compounds, European Commission, Brussels.
- 3. The Safe Drinking Water Act (2011) An Act to Amend the Safe Drinking Water Act to Reduce Lead in Drinking Water of 20002, Publ. L. No. 111-380, Sec. 2 (d) (1) (B), Washington.
- 4. Grohbauer, A. and Wieland-Werke, A.G. (2012) Verfahren zur Abtrennung von Blei aus dem Messing-Recycling-Kreislauf. DE102011012133A1, German Patent and Trade Mark Office, Munich.
- 5. Hilgendorf, S., Binz, F., Welter, J.M. and Friedrich, B. (2016) Lead Removal from Brass Scrap by Fluorine-Free Compound Separation. Materials Science and Technology, 32, 1782-1788. https://doi.org/10.1080/02670836.2016.1223574
- 6. Yamada, K., Rochman, N.T., Fujimoto, R., Suehiro, S. and Sueyoshi, H. (2001) Removal of Lead from Scrap Brass. Journal of Advanced Science, 13, 273-276. https://doi.org/10.2978/jsas.13.273
- 7. Nakano, A., Rochman, N.T. and Sueyoshi, H. (2005) Removal of Lead from Copper Alloy Scrap by Compound-Separation Method. Materials Transactions, 46, 2719-2724. https://doi.org/10.2320/matertrans.46.2719
- 8. Nakano, A., Rochman, N.T. and Sueyoshi, H. (2005) LCA of Manufacturing Lead-Free Copper Alloys. Materials Transactions, 46, 2713-2718. https://doi.org/10.2320/matertrans.46.2713
- 9. Sueyoshi, H., Yamada, K., Miyazaki, M., Okada, T., Ashie, N. and Kousaka, Y. (2018) Mechanism of Pb Removal from Brass Scrap by Compound Separation Using Ca and NaF. International Journal of Nonferrous Metallurg, 7, 1-7. https://doi.org/10.4236/ijnm.2018.71001
- 10. Rao, S.S. and Anantharaman, T.R. (1969) Constitution of Brasses below 500°C. Zeitschrift für Metallkunde, 60, 312-315.
- 11. Murakami, Y. (1972) Lattice Softening, Phase Stability and Elastic Anomaly of the β-Au-Cu-Zn Alloys. Journal of the Physical Society of Japan, 33, 1350-1360. https://doi.org/10.1143/JPSJ.33.1350
- 12. Vishan, V. and Narlikar, A.V. (1976) Structure and Superconductivity of Splat Quenched Pb Bi Solid Solution. Materials Research Bulletin, 11, 1257-1264. https://doi.org/10.1016/0025-5408(76)90030-1
- 13. Helleis, O., Kandier, H., Leicht, E., Quiring, W. and Wolfel, E.R. (1963) Die Kristallstrukturen der Intermetallischen Phasen Ca33Ge, Ca7Ge, Ca3Pb und Ca5Pb3. Zeitschrift Anorganische und Allgemeine Chemie, 320, 86-100. https://doi.org/10.1002/zaac.19633200113
- 14. Messing, A.F., Adams, M.D. and Steunenberg, R.K. (1963) Contribution to the Phase Diagram Calcium-Zinc. Transactions of the ASM, 56, 345-350.
- 15. Buschow, K.H.J. (1974) Calcium-Nickel Intermetallic Compounds. Journal of the Less Common Metals, 38, 95-98. https://doi.org/10.1016/0022-5088(74)90208-2
- 16. Itkin, V.P. and Alcock, C.B. (1992) The Ca-Pb (Calcium-Lead) System. Journal of Phase Equilibria, 13, 162-169. https://doi.org/10.1007/BF02667480
- 17. Bruzzone, G. and Merio, F. (1976) The Equilibrium Phase Diagram of the Calcium-Lead System and Crystal Structures of the Compounds CaPb, EuPb and YbPb. Journal of the Less Common Metals, 48, 103-109. https://doi.org/10.1016/0022-5088(76)90236-8
- 18. Palenzona, A., Manfrinetti, P. and Fomasini, M.L. (2000) Phase Diagram of the Ca-Sn System. Journal of Alloys and Compounds, 312, 165-171. https://doi.org/10.1016/S0925-8388(00)01150-6
- 19. Jakob, K.T. and Jayadevan, K.P. (1997) Measurement of Gibbs Energy of Formation of Ca2PbO4 Using a Solid-State Cell with Three Electrodes. Journal of Materials Chemistry, 7, 2407-2413. https://doi.org/10.1039/a705512i
- 20. Mehrer, H. (1996) Diffusion in Intermetallics. Mat. Trans., JIM, 37, 1259-1280. https://doi.org/10.2320/matertrans1989.37.1259
- 21. Pozrikidis, C. (2017) Fluid Dynamics: Theory, Computation and Numerical Simulation, Third Edition, Springer, Berlin. https://doi.org/10.1007/978-1-4899-7991-9
- 22. JMatPro: Simulation Software for Solidification Behaviour and Properties, Database for Copper Alloys. UES Software Co. Ltd., Fujisawa.
- 23. Yang, Z., Shi, D., Wen, B., Melnik, R., Yao, S. and Li, T. (2010) First-Principle Studies of Ca-X (X = Si, Ge, Sn, Pb) Intermetallic Compounds. Journal of Solid State Chemistry, 183, 136-143. https://doi.org/10.1016/j.jssc.2009.11.007
- 24. Okajima, K. and Sakao, H. (1988) Anomalous Property of Liquid Pb-Bi Alloys Determined by EMF and Density Measurements. Transactions of the Japan Institute of Metals, 29, 469-476.
NOTES
*Professor Emeritus.