International Journal of Nonferrous Metallurgy
Vol.06 No.01(2017), Article ID:75143,16 pages
10.4236/ijnm.2017.61001
Transient Thermal Modeling in Laser Welding of Metallic/Nonmetallic Joints Using SolidWorks® Software
Fredrick Madaraka Mwema
Department of Mechanical Engineering, Dedan Kimathi University of Technology, Nyeri, Kenya

Copyright © 2017 by author and Scientific Research Publishing Inc.
This work is licensed under the Creative Commons Attribution International License (CC BY 4.0).
http://creativecommons.org/licenses/by/4.0/


Received: June 23, 2016; Accepted: January 28, 2017; Published: January 31, 2017
ABSTRACT
The purpose of this research is to develop a SolidWorks® model for transient temperature field of laser welding of PMMA/SS 304 materials for application in fabrication of the ultrasonic back-plate, with a view of optimizing the experimental conditions. The study is carried out on these materials because of the increasing application of both metals and non-metals. The work focuses specifically on these materials because they have been experimentally studied previously and as such, this study can be accepted as an assessment into feasibility of using SolidWorks® model to study the temperature field of the laser welding processes of metals and non-metals. The results of the SolidWorks® transient thermal model show that there is a concentration of high temperatures at the point of contact. It also shows that temperature decreases as we move in (between laser and the top face) to the thickness of the part. Additionally the maximum temperature occurs at the last point of the welding; this may be due to the accumulation of the temperature before arriving at the end. These findings are comparable to the previous simulated and experimental results on temperature field during laser welding of PMMA/SS 304 materials. However, SolidWorks® is shown to present a challenge in modeling a moving source of laser power.
Keywords:
SolidWorks®, Laser Welding, Joining, Temperature Field, Metals/Nonmetals, Transient Thermal Modeling

1. Thermal Simulation and Modeling of Laser Welding Operations
Laser welding is a complex and nonlinear process, which involves very high thermal conditions [1] - [34] . As such, experimental visualization of the temperature and heat distribution within the joint region and its relationship with laser welding parameters is difficult. Thermal modeling and simulations are therefore used in studying temperature profiles in laser welding operations. Temperature profile and its relationship with process parameters are useful in optimization of laser welding operations, thereby reducing trial and error method during an actual laser welding process [2] - [12] [34] [35] . As such, several researchers have developed models for predicting the thermal behavior of laser welding. In this section, the literature on simulation and modeling of laser welding is presented with emphasis on the thermal modeling.
1.1. Heat Source Modeling
The thermal profile and shape of the welding bead for Nd:YAG laser welding operation of AISI 304 steel lap joint has been studied [35] . In this study [35] , a commercial FE software (SYSWELD) was used to develop the relationship between the welding parameters and temperature profile. Modeling of the source of heat for a laser operation is one of the most critical processes in laser welding simulations. As such, a review of some of the previous heat source models used by previous studies is presented.
Usually, the laser beam is assumed to have a conical shape and travels at a constant velocity in the X-axis and according to Conical Gaussian distribution. Study [35] modeled the heat source as a 3D conical source of heat shown in the Figure 1. In heat source modeling, it is critical to consider that not all the energy generated by the heat source is absorbed into the weld surfaces. This occurs due to loss of energy through reflection by the surfaces to be welded. Therefore, the energy loss for each material should be determined for correct modeling results. For instance, the loss of laser energy in steel materials has been determined to be 31% of the laser power. This means that only 69% of the laser power is absorbed into the welding region. However, according to finite element model developed by Carmignani et al. [36] , 53% of this power is absorbed by the weld keyhole (denoted as Qkeyhole) while 16% gets absorbed into the surfaces of the parts being welded (denoted as Qsurf). The distribution of heat flux (Qxy) for the heat source according to Gaussian and as modeled by studies [35] [36] is represented in Equation (1). In this equation, R is the radius of the heat source. This is the heat source distribution as absorbed on the surfaces of the weld specimens.
 (1)
(1)
The radius of the heat source, R, is usually determined as shown in Equation (2).
 (2)
(2)
where M is the constant, which depicts the characteristic of the laser beam,  is the wavelength, D is the smallest diameter of the laser beam and F is the focal length of the laser’s lenses. The heat energy absorbed into the keyhole, (Qz)

Figure 1. The model of the Conical Heat source developed by [35] . Also showing the heat source parameters.
exhibits a Gaussian distribution as depicted in the Equation (3) below.
 (3)
(3)
These parameters are illustrated and defined in literature [35] [36] . According to this model [35] [36] , the total thermal input (Q) during the laser welding is computed as

Using MARC finite element software Kim et al. [34] , modeled a 3D conical heat to study various parameters of Nd:YAG laser welding of AISI steel. This model was designed based on the experimental expertise of the researchers. According to this model [34] , the thermal input per unit volume depends on the radial distance from the central region of the source of heat and as such, the heat input was assumed a function of the shapes factors detailed in the study [34] . This further implies that the simulation results of the shape of the molten pool and the heat input were interdependent according to this model [34] . In this model, the heat input was determined as follows for the three-dimensional Gaussian source of heat.

where:
 is the maximum heat input, r is the radial distance, r0 is the radial distance perpendicular to the x-axis of the distribution. The values of
  and r0 are functions of the shape of the heat source and therefore depends on the shape of the heat source. They can be determined from the heat source’s shape constants.
In a different study [37] , in which AbaQus FE software was used to model laser welding operation, heat source was modeled using the Gaussian distribution model and equation used is shown below.
 (4)
(4)
where:
Q is the thermal energy absorbed by the weld specimen, r is the radius of the beam of the laser and  is the point along the radius at which the beam intensity is about 0.005 of the maximum beam intensity.
From this discussion, most of the simulations from previous researchers on laser welding have used 3D conical shaped sources of heat models. It can also be noted that the Gaussian heat distribution for a moving heat source has been used widely to model the source of heat in finite element analysis of laser welding. The keyhole mode of welding, reported by [35] , is the most and widely adopted in FE modeling of laser welding.
1.2. Simulation of Laser Welding Parameters
Using SYSWELD software, study [35] generated temperature profiles for different pulse duration of the laser welding process for AISI 304 steel of 1.0 mm thickness. The results showed that temperature near the source of the laser was very high compared to that near the edge where the welding started.
The effect of the laser power on the geometry of the bead of the laser weld has been also reported [35] . It was reported that the length of penetration of the beam and the width of the bead exhibit a direct correlation; that is, beam width and penetration increase with increase in laser power [35] . At higher laser power, this study showed that there occurs sufficient fusion between the top and lower parts of the lower joint. However, at lower laser power, these simulations revealed that only the upper plate of the weld specimen became molten and the beam did not penetrate the lower plate of the lap joint [35] . The study further showed that the beam penetration depth increases with the increase in laser power. This is because increase in laser power increases the heat energy into the weld specimen.
A similar study [34] , in which MARC FE software was used; the effects of laser power on the width of the weld bead and the depth of penetration of the laser beam were clearly illustrated. The results were shown to agree with those reported in study [35] . At laser power of 20 W, the bead width was about 0.72 mm and depth of penetration was about 0.48 mm. At laser power of 25 W, it can be seen that the depth of the weld was 0.64 mm while the width was 0.84 mm. The highest depth of penetration and bead width were observed at the highest laser power of 35 W for the 1-mm thick AISI 304 steel [34] . Depth of penetration is an important parameter in laser welding since it determines the shear strength as well as the quality of the joint [34] [38] . Determination of the depth penetration of laser is experimentally difficult and therefore numerical methods are frequently used.
One-dimensional numerical model for investigation of the depth of penetration of laser during laser welding has been developed based on conduction of heat theory and energy balance equations [38] . Using the energy balance equation at the laser focus point, [38] developed a numerical model to estimate the depth of penetration, l, as illustrated by the Equation (5) below.
 (5)
(5)
In this equation, p represents the laser’s peak power, t is the pulse duration, r refers to the radius of the beam of the laser and Tm is the maximum temperature, which the welding specimens can achieve. R is the reflectivity of the material and T0 is the temperature at the extreme edge (opposite edge to that where the welding starts).
Lm represents the latent heat of fusion of the materials and  is the density of the material. Equation (2) describes the laser beam penetration depth for a spot weld. Using this theoretical model, [38] developed the relationship among laser depth, peak power and pulse duration and laser radius. It was shown that changes in the peak power and pulse duration result to similar change in the depth of penetration of the laser. This agrees with the experimental and other simulated results presented in literature. The model therefore clearly shows that increase in peak power and pulse duration increases the depth of the laser beam penetration.
The effect of scanning speed on the geometry of the laser welding for AISI 304 steel has been reported [35] . The simulation showed that as the scanning speed increases, the depth of penetration and the width of the weld bead increases. This is clearly attributable to the decrease for the quantity of heat conducted to the bottom plate at higher scanning speeds of the laser. Another interesting aspect of laser welding, which simulation studies have been able to investigate is the focused size (diameter) of the laser beam, commonly referred to as spot size in literature [34] [35] [36] and [37] . According to [35] , using a very small diameter of the laser beam (0.6 mm) enhances the formation of a deeper weld. When the spot diameter is very small, the laser power becomes concentrated into a small area, thereby resulting in increase in the density of power of the laser beam. As such, the weld specimen becomes exposed to higher power causing deeper penetration of the beam.
The results by study [35] can be further be confirmed by the spot welding model developed by Nawi et al. [38] represented by Equation 6. The relationship between the laser spot radius, peak power and depth of penetration according to the numerical model developed by [38] showed that the depth of penetration exhibits an indirect relationship with the laser spot radius-the increase in laser radius decreases the depth of penetration as reported by study [35] . This is so because the density of the laser beams (I) exhibit the following relationship with the radius of the laser beam [38] .
 (6)
(6)
According to this equation, the power density exhibits an indirect relationship with the square of the radius of the laser beam. As such, the power density decreases with increase in the radius of the laser beam. As such, for very high spot weld radius, the power density will be very low. Similar relationship has been attributed to low depth of penetration in other studies [35] . From this study, it can be preliminarily be concluded that to achieve the highest penetration during laser welding of materials, the welding speed and the beam spot size should be low with the laser power kept to a maximum.
Mathematical models are effective in studying the interaction among several laser-welding parameters. Hussein et al. [4] typically illustrate that using Response Surface Methodology (RSM) to develop relationships among experimental variables, enhances optimization of the welding process [4] . This study offers important conclusions on the laser welding parameters of polymer-metal hybrid composites. From the RSM model, Hussein et al. [3] revealed that the strength and the width of the weld bead increase with increase in peak power and the pulse duration. It was also shown that the increase in scanning speed decreases the strength and bead width of the polymer-metal joint. It was also reported that the repetitive rate of the laser pulse has a direct relationship with the joint strength at higher peak power. From this study, the optimal conditions for laser welding of PMMA/Stainless steel 304 using Nd:YAG laser were deduced as tabulated in Table 1 using RSM of the experimental data.
1.3. Governing Equations in Thermal Modeling of Laser Welding
Keyhole laser welding is the most used mode and therefore the equations represented here apply to keyhole welding. The keyhole can be assumed a circular cylinder. In most models, the line source of heat has been used to simulate laser keyholes [35] [39] . During the welding process, the laser beam is absorbed on the surface to generate heat, which vaporizes the material to form the keyhole.

Table 1. The optimum welding conditions for PMMA/SS 304 joint using Nd:YAG laser [3] .
The heat energy from the keyhole is transferred to the work piece through heat conduction. Therefore, the general 3D-dimensional heat conduction equation applies [39] .
 (7)
(7)
where:
T is the temperature of the specimen.
t is the time of heat exposure.
u, v, w refer to velocities in x, y, and z directions.
 is the density of the material.
 represents the specific heat of the work piece.
 refers the thermal conductivity of the material.
In this model, the following assumptions usually apply:
1) Properties of the material such as density, specific heat and conductivity are constant.
2) The set-up is in steady state.
3) The material moves with a unidirectional velocity, U.
4) The effect of the latent heat of fusion is insignificant.
Based on these assumptions, the heat conduction equation reduces to the following form
 (8)
(8)
where:
k represents the thermal diffusivity of the work piece
The solution to the heat conduction equation gives the temperature distribution within the material due to the laser energy. These solutions depend on the approach employed. The most inclusive solution assumes a point source of power on the surface and inside the work piece and line source power.
The temperature distribution (solution to the heat equation) has been developed as follows [39] .
 (9)
(9)
The quantities P (power intensity supplied by the laser source) and Q (thermal energy) are functions of power absorption by the material and are well described in literature [39] .
The temperature distribution within the keyhole has been used to determine the radius of the keyhole using the line source model. This is achieved by assuming that the mean temperature of the circular keyhole of with radius, a (perpendicular distance from the center of the laser source), is the temperature of the boiling (TB) of the molten material. The following equations govern this relationship [39] .

This has been simplified as
 (10)
(10)
where:


 is the ambient temperature
 are Bassel functions
From Equation (10), the relationship between a’ and  can be used graphi-
cally to determine a. It gives the relationship between power absorbed and the radius of the keyhole.
This is the most basic solution to the heat equation. However, there are formulations that are more complicated such as Davis-Noller solution to the heat equations, which give close approximation. Davis-Noller solution to the heat equation is written as [39]
 (11)
(11)
where:

Modeling of the keyhole has proven difficult. However, the simplest equation used to model various keyhole parameters can be illustrated as follows [39] .
 (12)
(12)
This model can be used to approximate the depth of penetration and other keyhole parameters.
From the review, it can be deduced that FEA in laser welding uses heat conduction equation to solve for the temperature distribution due to laser heat power. However, different FE Software use different approaches and therefore have different accuracies. It is clearly seen that most of the finite element models published in literature have used the advanced software. As such, the present research uses SolidWorks® (a simple tool) to optimize laser-welding parameters for Nd:YAG Laser welding of PMMA/SS 304 materials.
2. SolidWorks® Software in Transient Thermal Modeling
SolidWorks® software undertakes the thermal modeling for laser welding by solving the heat (governing) equation shown in Equation (7) by using the finite element method. The heat equation is solved for each node. This means that system of simultaneous equations are generated based on the number of nodes used. Temperature, T, is the unknown in each equation. These equations form a matrix, which takes the following general format.

In this case, K is the thermal stiffness of the material and is a function of conductivity, length and area and P is the heat power supplied by the laser beam. The finite element method solves these systems of linear equations iteratively until a convergence is achieved [40] . The solution gives the temperature field, T, for each node. The thermal simulation process involves first creating the physical Computer Aided Design (CAD) model of the components using the primitive tools (such as lines, circles, curves and other shapes) available in the SolidWorks® menu. The boundary conditions are then applied. In thermal analysis, the boundary conditions are usually the cold and the hot edges of the parts. The meshing process of the part follows this: meshing discretizes the part into several elements with specific shapes. SolidWorks® offers several shapes of elements including rectangular, triangular and among others. At the first computation, it is important to use the default number of elements to reduce the time of calculation. Finally, the solution should be run to create the desired results. Temperature field and heat flux distribution are typical thermal analysis (conduction) results in SolidWorks®.
As stated in the introduction section, the purpose of this work is to study the laser welding of PET and Aluminum sheets. To evaluate the applicability of the SolidWorks® in studying laser welding, a preliminary simulation was undertaken on PMMA and stainless steel sheets. This study is an attempt to simulate the thermal behavior of two thin hybrid materials plates of polymer (PMMA) and Stainless steel that are being joined by an Nd:YAG laser. The study is the application of the SolidWorks® Software and particularly the Transient Thermal Model. Hussein et al. [3] conducted the experimental studies on the same materials (PMMA and stainless steel 304) earlier using Nd:YAG laser. The simulation used the same dimensions of the materials as used by the study [3] in order to evaluate the use of SolidWorks® in laser welding simulation. The results were then compared with those of Hussein et al. [3] .
2.1. Modeling Assumptions
The following physical assumptions were considered during the SolidWorks® modeling of PMMA and Stainless steel sheets:
1) The laser was considered as a moving source of power
2) SolidWorks® transient thermal analysis was used for the analysis
3) Although SolidWorks® does not offer a way to model the moving thermal power, the available SolidWorks® tools were used to simulate the case
4) The simulation did not consider the cooling of the material due to the laser heat power on a zone. The cooling was ignored for the present simulation since it requires advanced studies with flow or convection simulation
2.2. Material Properties
The reliability of the numerical results depends on the thermal and optical characteristics of the materials. The most critical properties for heat flow studies include conductivity, specific heat and density of the materials of the components being studied [40] . The properties of the materials used in this model are illustrated in the Table 2. The conductivities and heat-related properties of these materials are very different and therefore in terms of heat flow and fusion during welding are complicated. Furthermore, their density and volumetric properties are very different, which signifies their difference in engineering performance.
2.3. Model Creation
The model of the PMMA/SS 304 steel joint was created using the SolidWorks® drafting tools. The Figure 2 shows the model created in this simulation.
The moving heat power was then applied as illustrated in Figure 3.
To model the moving power source, we used the following technique: we modeled the surfaces of the weld region as multiple rectangles that are similar and ordered such that the laser hits these positions at different times. Since the laser will irradiate these rectangles at different times, it means that the laser power is changing its position with time. The region was divided into 10 sub regions and considering that the laser passes throughout the entire surface for 1 second, each region will have the beam acting on it for 0.1 second. In other terms, the power activity between 0 and 0.1 sec will only act on the first region, 0.1 and 0.2 will only act on the second region and so on.
The parts were then meshed using the curved elements with sizes of 1.8653 mm. A total number of elements used were 18,636 with 35,014 nodes as shown in Figure 4. The simulation used the Solid Mesh since it provides the information on temperature at the different thicknesses.
Table 2. Thermal properties of the materials used in the SolidWorks® model.

Figure 2. The PMMA/SS 304 steel hybrid composite joint.

Figure 3. Modeling of moving laser beam power.
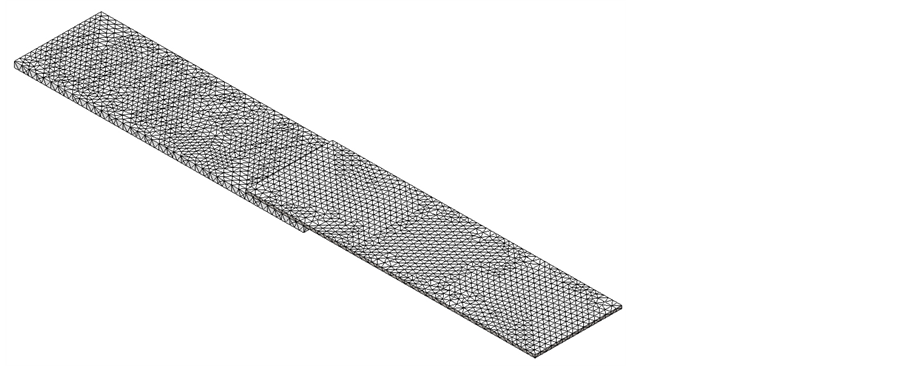
Figure 4. SolidWorks® meshing.
2.4. Boundary Conditions
The initial conditions,  seconds, the two plates have uniform temperature distributed over them. This temperature is the atmospheric temperature. In this case, the ambient temperature was chosen to be 303 K (30˚C).
2.5. Thermal Loading and Solution
The heat power of 200 Watts was applied to the 10 points with a time step of 0.1 seconds. As the study is linear, we could eventually use a multiplier to approach a closer power. In this way, the laser beam power acted on the first point from 0 to 0.1 seconds and the last at 0.9 - 1 second. Therefore, for each time step (0.1 seconds) a solution was provided for each node.
2.6. Results and Discussion
Figure 5 shows the temperature distribution at the first and the final points (through the thickness) of the laser-welded parts. The values of temperature distribution are shown to the right of the figure.
These results show a concentration of high temperatures at the point of contact in line with the expectations and temperature decreasing as we move in (between laser and the top face) to the thickness of the part. It is also clear that the variation of the temperature/with time as the application of the power source is only partial on a certain region at a certain time. These observations are similar and comparable to those reported by Hussein et al. [3] . However, we do remark that the accumulated temperature or maximum temperature at the end of the laser movement is higher than at the initial starting point: this may be due to the accumulation of the temperature before arriving at the end. Considering this method and with the 3D meshing we characterize the temperature at every point (with assumption that the PMMA is behaving linearly). We could even have better results if we model the non-linearity of the material as it comes to handling high variations of temperatures and phase changes (solid to molten state). However, this behavior requires the use of advanced software.

Figure 5. Temperature distributions for first and last point of the laser.
3. Conclusion
This work illustrates that SolidWorks® software can be used to model temperature field during laser welding of metallic and nonmetallic materials. However, it is challenging to model a moving source of power with this software. Furthermore, non-linearity behavior of materials cannot be modeled using this software. As such, SolidWorks® models can be used as a preliminary study into the temperature field during laser welding of different materials.
Cite this paper
Mwema, F.M. (2017) Transient Thermal Modeling in Laser Welding of Metallic/Nonmetallic Joints Using SolidWorks® Software. International Journal of Nonferrous Metallurgy, 6, 1-16. https://doi.org/10.4236/ijnm.2017.61001
References
- 1. Munro, W.S.H., Pomeroy, S., Rafiq, M., Williams, H.R., Wybrow, M.D. and Wykes, C. (1990) Ultrasonic Vehicle Guidance Transducer. Ultrasonics, 28, 350-354.
https://doi.org/10.1016/0041-624X(90)90054-R - 2. Wang, X., Li, P., Xu, Z., Song, X. and Liu, H. (2010) Laser Transmission Joint between PET and Titanium for Biomedical Application. Journal of Materials Processing Technology, 210, 1767-1771.
https://doi.org/10.1016/j.jmatprotec.2010.06.007 - 3. Hussein, F.I., Akman, E., Oztoprak, B.G., Gunes, M., Gundogdu, O., Kacar, E., Hajim, K.I. and Demir, A. (2013) Evaluation of PMMA Joining to Stainless Steel 304 Using Pulsed Nd:YAG Laser. Optics & Laser Technology, 49, 143-152.
https://doi.org/10.1016/j.optlastec.2012.12.028 - 4. Cenigaonaindia, A., Liebana, F., Lamikiz, A. and Echegoyen, Z. (2012) Novel Strategies for Laser Joining of Polyamide and AISI 304. Physics Procedia, 39, 92-99.
https://doi.org/10.1016/j.phpro.2012.10.018 - 5. Bergmann, J.P. and Stambke, M. (2012) Potential of Laser-Manufactured Polymer-Metal Hybrid Joints. Physics Procedia, 39, 84-91.
https://doi.org/10.1016/j.phpro.2012.10.017 - 6. Ramarathnam, G., Libertucc, M., Sadowski, M.M. and North, T.H. (1992) Joining of Polymers to Metal: The Joining of High-Strength Thermoplastics to Aluminum Is One Phase of an Ongoing Study of Polymer-to-Metal Joints. Welding Research Supplement, 71, 483-490.
- 7. Quintino, L., Miranda, R., Dilthey, U., Iordachescu, D., Banasik, M. and Stano, S. (2012) Laser Welding of Structural Aluminium. Advanced Structured Materials, 8, 33-57.
https://doi.org/10.1007/8611_2010_46 - 8. Amancio-Filho, S.T. and Santos, T.H. (2009) Joining of Polymers and Polymer-Metal Hybrid Structures: Recent Developments and Trends. Polymer Engineering and Science, 49, 1461.
- 9. Ion, J.C. (2000) Laser Beam Welding of Wrought Aluminum Alloys. Science and Technology of Welding and Joining, 5, 265-276.
https://doi.org/10.1179/136217100101538308 - 10. Klein, R. (2012) Laser Welding of Plastics. Wiley-VCH Verlag GmbH & Co. KGaA, Weinheim.
- 11. PKF Laser & Electronics AG (2006) LQ-TMG 2 Handheld Transmission Measurement for Plastics. Product Information Brochure, LPKF, Erlangen.
- 12. Kawahito, Y. and Katayama, S. (2010) Innovation of Laser Direct Joining between Metal and Plastic. Transactions of JWRI, 36, 50-52.
- 13. Rosler, J., Harders, H. and Baker, M. (2006) Mechanical Behaviour of Engineering Materials. Teubner VerlagWiesbaden, Germany.
- 14. Farazila, Y., Miyashita, Y., Hua, W., Mutoh, Y. and Otsuka, Y. (2011) YAG Laser Spot Welding of PET and Metallic Materials. Journal of Laser Micro/Nanoengineering, 6, 69-74.
https://doi.org/10.2961/jlmn.2011.01.0015 - 15. Katayama, S., Kawahito, Y., Niwa, Y., Tange, A. and Kubota, S. (2007) Laser Direct Joining between Stainless Steel and Amorphous Polyamide Plastic. Transactions of JWRI, 25, 316-322.
https://doi.org/10.2207/qjjws.25.316 - 16. Katayama, S. and Kawahito, Y. (2014) Laser Joining Carbon Fiber-Reinforced Plastic to Stainless Steel. Industrial Laser Solutions for Manufacturing, 29, 1-16.
http://www.industrial-lasers.com/articles/print/volume-29/issue-4/features/laser-joining-carbon-fiber-reinforced-plastic-to-stainless-steel.html - 17. Jung, K.W., Kawahito, Y. and Katayama, S. (2013) Laser Direct Joining of CFRP to Metal or Engineering Plastic. Transactions of JWRI, 42, 5-8.
- 18. Katayama, S. and Kawahito, Y. (2008) Laser Direct Joining of Metal and Plastic. Scripta Materialia, 59, 1247-1250.
- 19. Tillmann, W., Elrefaey, A. and Wojarsk, L. (2010) Toward Process Optimization in Laser Welding of Metal to Polymer. Prozessoptimierung beim Laserstrahlschweißen von Metall mit Kunststoff. Materialwissenschaft und Werkstofftechnik, 41, 879-883.
https://doi.org/10.1002/mawe.201000674 - 20. Kah, P., Suoranta, R., Martikainen, S. and Magnus, C. (2014) Techniques for Joining Dissimilar Materials: Metals and Polymers. Reviews on Advanced Materials Science, 36, 152-164.
- 21. Wang, X., Li, P., Xu, Z., Song, X. and Liu, H. (2010) Laser Transmission Joint between PET and Titanium for Biomedical Application. Journal of Materials Processing Technology, 210, 1767-1771.
- 22. Georgiev, D.G., Baird, R.J., Newaz, G., Auner, G., Witte, R. and Herfurth, H. (2004) An XPS Study of Laser-Fabricated Polyimide/Titanium Interfaces. Applied Surface Science, 236, 71-76.
- 23. Georgiev, G.L., Sultana, T., Baird, R.J., Auner, G., Newaz, G., Patwa, R. and Herfurth, H. (2009) Laser Bonding and Characterization of Kapton® FN/Ti and Teflon®FEP/Ti Systems. Journal of Materials Science, 44, 882-888.
https://doi.org/10.1007/s10853-008-3187-8 - 24. Georgiev, D.G., Sultana, T., Mian, A., Auner, G., Herfurth, H., Witte, R. and Newaz, G. (2005) Laser Fabrication and Characterization of Sub-Millimeter Joints between Polyimide and Ti-Coated Borosilicate Glass. Journal of Materials Science, 40, 5641-5647.
https://doi.org/10.1007/s10853-005-1291-6 - 25. Mian, A., Newaz, G., Vendra, L., Rahman, N., Georgiev, D.G., Auner, G., Witte, R. and Herfurth, H. (2005) Laser Bonded Microjoints between Titanium and Polyimide for Applications in Medical Implants. Journal of Material Science: Materials in Medicine, 16, 229-237.
https://doi.org/10.1007/s10856-005-6684-1 - 26. Newaz, G., Sultanan, T., Nusier, S. and Herfurth, H. (2008) Miniaturized Samples for Bond Strength and Hermetic Sealing Evaluation for Transmission Laser Joints. Journal of laser Micro/Nanoengineering, 3, 186-195.
- 27. Sultana, T. (2007) Bond Quality and Failure Mode Assessment for Polymer-Metal and Polymer-Glass Transmission Laser Joints. ProQuest.
- 28. Farazila, Y., Miyashita, Y., Mutoh, Y. and Shukor, M.H.A. (2012) Effect of Anodizing on Pulsed Nd:YAG Laser Joining of PET and Aluminum Alloy (A5052). Materials and Design, 37, 410-415.
- 29. Ghorbel, E., Casalino, G. and Abed, S. (2009) Laser Diode Transmission Welding of Polypropylene: Geometrical and Microstructure Characterisation of Weld. Materials and Design, 30, 2745-2751.
- 30. Xie, J. and Kar, A. (1999) Laser Welding of Thin Sheet Steel with Surface Oxidation. Welding Research Supplement, 78, 343-348.
- 31. Katayama, S., Kawahito, Y. and Mizutani, M. (2010) Laser Welding and Hybrid Welding of Aluminum Alloys. In: New Frontiers in Light Metals, 80-150.
- 32. Katayama, S. and Kawahito, Y. (2010) Evolution of Laser Welding to Dissimilar Materials Joining. Transactions of JWRI, 39, 268-269.
- 33. Hino, M., Mitooka, Y., Murakami, K., Urakami, K., Nagase, H. and Kanadani, T. (2011) Effect of Aluminum Surface State on Laser Joining between 1050 Aluminum sheet and Polypropylene Resin Sheet Using Insert Materials. Materials & Transactions, 52, 1041-1047.
https://doi.org/10.2320/matertrans.L-M2011804 - 34. Kim, K., Lee, J. and Cho, H. (2010) Analysis of Pulsed Nd:YAG Laser Welding of AISI 304 Steel. Journal of Mechanical Science and Technology, 24, 2253-2259.
https://doi.org/10.1007/s12206-010-0902-6 - 35. Shanmugam, N.S., Buvanashekaran, G. and Sankaranarayanasamy, K. (2009) Finite Element Simulation of Nd:YAG Laser Lap Welding of AISI 304 Stainless Steel Sheets. In: Recent Advances in Mechanical Engineering and Automatic Control, 174-179.
- 36. Carmignani, C., Mares, R. and Toselli, G. (1999) Transient Finite Element Analysis of Deep Penetration Laser Welding Process in a Single Pass Butt-Welded Thick Steel Plate. Journal of Computational Methods in Applied Mechanics and Engineering, 179, 197-124.
- 37. Mian, A., Mahmood, T., Amin, M.R. and Newaz, G. (2006) Characterization of Laser Micro Joining Process Using a Computation Technique. Proceedings of the 3rd BSME-ASME International Conference on Thermal Engineering.
- 38. Nawi, I.N., Ali, J., Fadhali, M. and Yupapin, P.P. (2011) Nd:YAG Laser Welding for photonics Devices Packaging. Universiti Teknologi MARA, Malaysia.
- 39. Dowden, J.M. (2001) The Mathematics of Thermal Modeling—An Introduction to the Theory of Laser Material Processing. Chapman & Hall/CRC, London.
- 40. Akin, J.E. (2009) Finite Element Analysis Concepts: Via Solid Works. World Scientific, New Jersey.