Computational Water, Energy, and Environmental Engineering
Vol. 1 No. 2 (2012) , Article ID: 21281 , 15 pages DOI:10.4236/cweee.2012.12002
Tuul River and Its Catchment Area Delineation from Satellite Image*
School of Earth Sciences, National University of Mongolia, Ulaanbaatar, Mongolia
Email: altansukh@num.edu.mn
Received April 30, 2012; revised June 2, 2012; accepted June 19, 2012
Keywords: Tuul River; its catchment area; basic parameters of the river; satellite image; modeling
ABSTRACT
The purpose of this research is to define basic parameters of Tuul River and its catchment area using satellite images. The study has been done by two datasets 1) Shuttle Radar Topography Mission (SRTM) at a horizontal spatial resolution of 90 meters, 2) The Advanced Spaceborne Thermal Emission and Reflection Radiometer (ASTER) at a horizontal spatial resolution of 30 meters, using two different models of ArcHydro and Integrated Land and Water Information System (ILWIS) softwares. Main methods of models, that were used in this research are the Deterministic-8, the steepest slope, the spread, the seek computations and the trace analysis. Moreover, input data of the modeling are digital elevation model (DEM) and outlet location of the river. DEM based ArcHydro model was run on the both datasets, and ILWIS model was run on SRTM data. Several intermediate results were produced while the models run, and basic parameters of the Tuul River, its catchment area have been defined at the end of the model. Moreover, final results of the models were compared with each other and with the result of previous research. The result of this study can be used in baseline and advanced research on the catchment area. Besides of that, the result can define a spatial boundary of study on Tuul River and its catchment area. Moreover, it would have support for decision-making on ground and surface water resource, distribution and management. Further research, which will cover the entire territory of Mongolia, has to be done using same methodology. The 332nd decision on “River catchment areas of Mongolia” of the Minister of Nature, Environment and Tourism in 2009 has to renew, if a result of that study would be accepted from vocational organization and experts.
1. Introduction
The Tuul River, flowing through the heart of the Ulaanbaatar city, is consumed by drinking and industrial purposes andis a most polluted river in Mongolia [1]. There are many different levels of national and international study on surface and ground water, its pollution, quality, consumption, resource, modeling and trend analysis of the Tuul River and its catchment area. Moreover, there are various scientific researches, such as soil, water, flora, fauna, geomorphology and environmental economy on the catchment area. For instance: “Economic significance of upper Tuul River’s ecosystem” research report was written by Emerton L., and N. Erdenesaihan in 2009, “River flow and quality modeling—A case study in Tuul River” dissertation was written by Altansukh O. in 2010, “Mongolian national case study—Reference to Tuul river basin” book was published by Basandorj D., and G. Davaa in 2006 and many more. Spatial boundary of all these studies has been defined by catchment area of Tuul River, which was delineated from the topographic map of Mongolia, scaled 1:100000 and produced in 1980th, using the traditional method.
A traditional method is catchment area delineation from the topographic map, drawing lines to connecting elevation points and contour lines. It is not an easy task precisely to define watershed lines, and related hydrographic and morphometric parameters in plane land areas using topographic map. The manual delineation of drainage networks and catchments from topographic maps has been widely replaced by the automatic extraction from Digital Elevation Model [2].
Figure 1 shows the Tuul River and its catchment area that were defined by the traditional method, mentioned in a majority of research reports and papers. For instance, main sources that researchers cite are 1) “Climate and surface water resource atlas of Mongolian Republic” published 1985, 2) “Scheme of integrated water resource management in the catchment area of Selenge River” published in 1986, 3) “National atlas of Mongolian
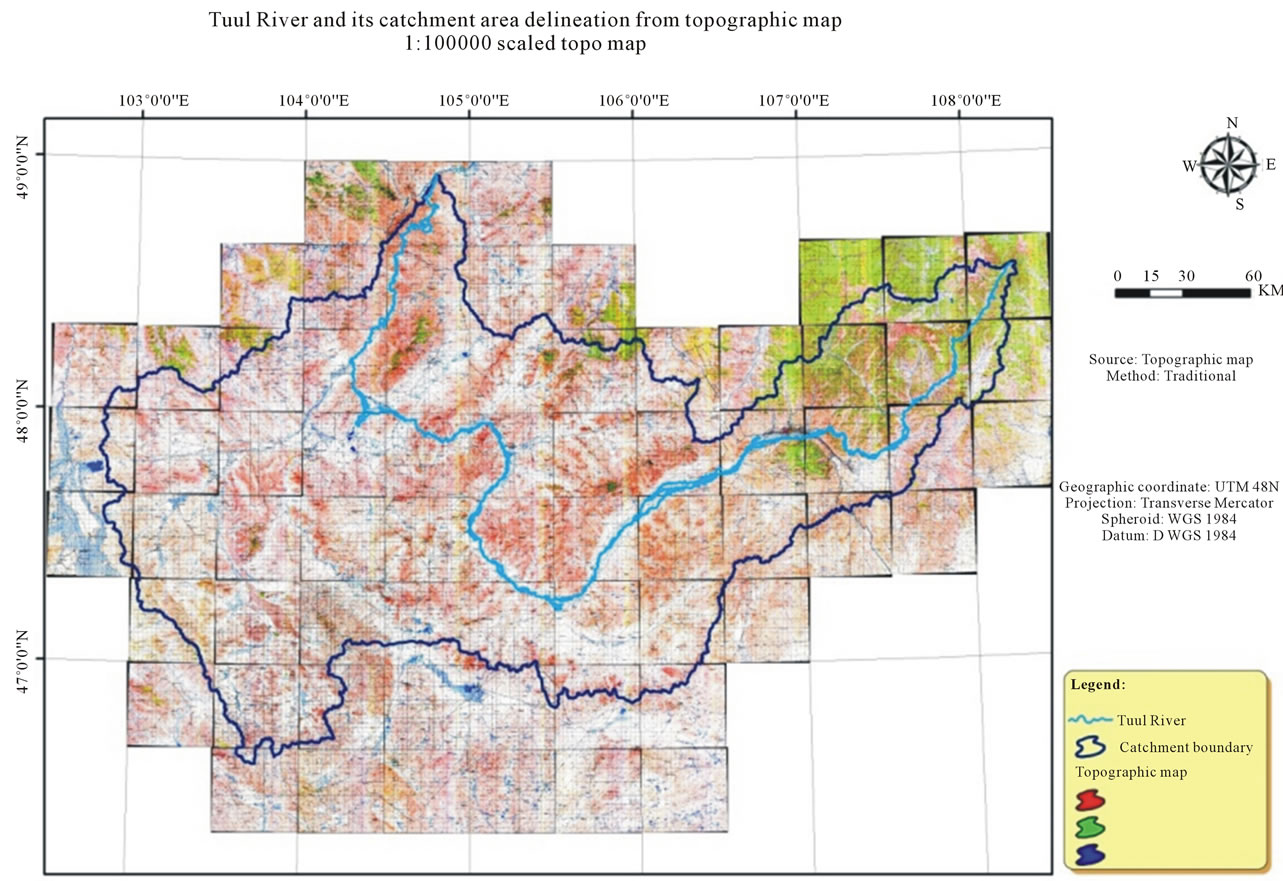
Figure 1. Tuul River and its catchment area delineation from the topographic map. Source: [3].
Republic” pressed in 1990, 4) “Catchment area of Tuul River-Integrated water resource management” book printed in 2006, 5) “National atlas of Mongolia” pressed in 2009, 6) the 332nd decision on “River catchment areas of Mongolia” by the Minister of Nature, Environment and Tourism in 2009, and 7) “Geo-information atlas of environment” printed in 2010. Shapes of the river and its catchment area, described in above-mentioned publications are shown in figure 2.
The catchment area of Tuul River was drawn same in aforesaid publications and according to the 332nd decision by the Minister; its area is 49416.1 km2.
In recent times, DEM that extracted from satellite image is widely applied to environmental science. It is used to get various information such as terrain slope, gradient, aspect, contour line, hill shade and view shade. Due to free access, SRTM-based DEM with 90 m spatial resolution commonly is used. Accurate delineation of watershed plays an extremely important role in the management of the watershed [11].
The research implementation is important in recent time when a water resource management is recognized a vital issue in the world and national level. Therefore, basic parameters of river and its catchment area have to define by modern method, and the result will be used in research in different scientific field and would have support for decision-making in the near future. The purpose of this research is to define basic parameters of Tuul River and its catchment area using satellite images.
2. Study Area, Data and Method
2.1. Study Area
The Minister of Nature, Environment and Tourism of Mongolia made a decision #332 in 2009 on river catchment areas and according to it, whole territory of Mongolia was divided into 29 larger river catchments (figure 3). It is being used to water resource management of Mongolia.
From these, catchment area of Tuul River that is located in the center of Mongolia has been selected as a study field for this research. As the capital of Mongolia is located in this catchment area and almost a half of population is lived in it. Therefore, this catchment area is very significant environmentally, economically and socially for our country.
The origins of the Tuul River are the Namiya and the Nergui streams at the southwestern slope of the Khentii mountain range that is located in approximately 2000
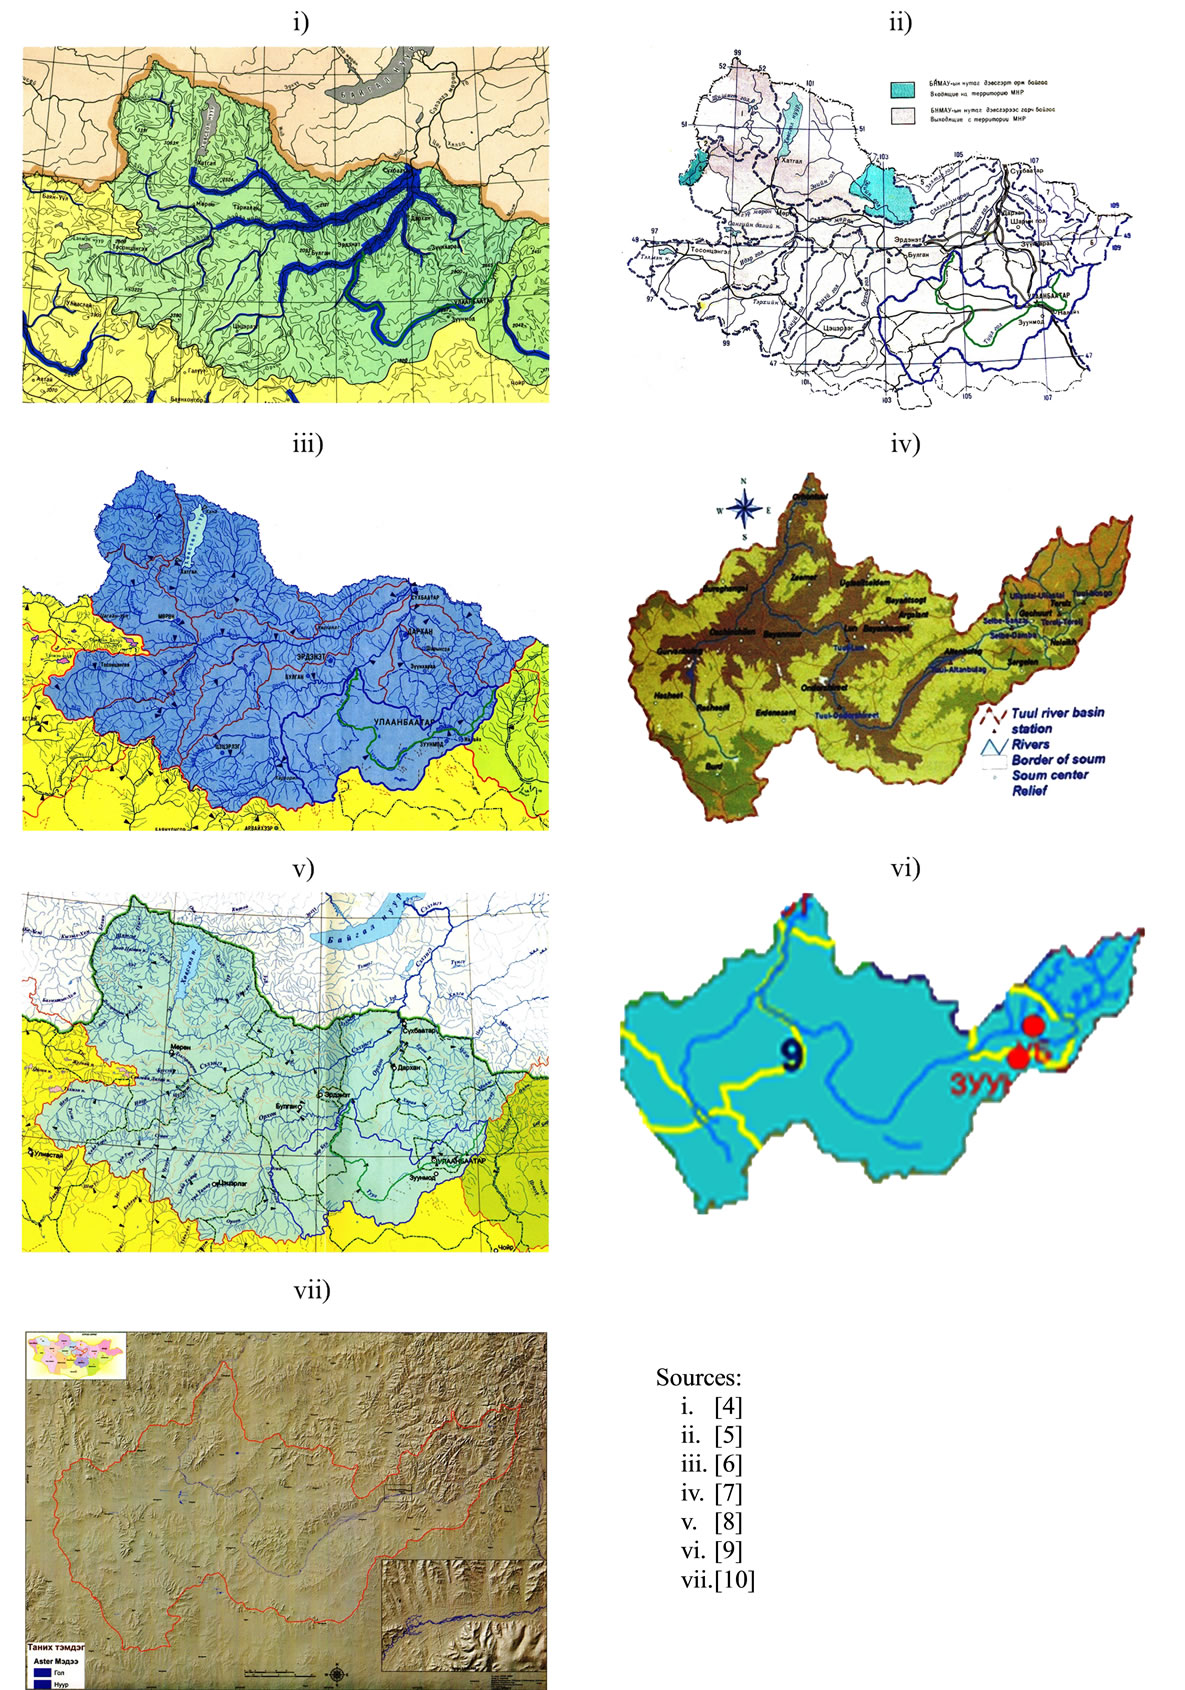
Figure 2. Tuul River and its catchment area in previous publications.
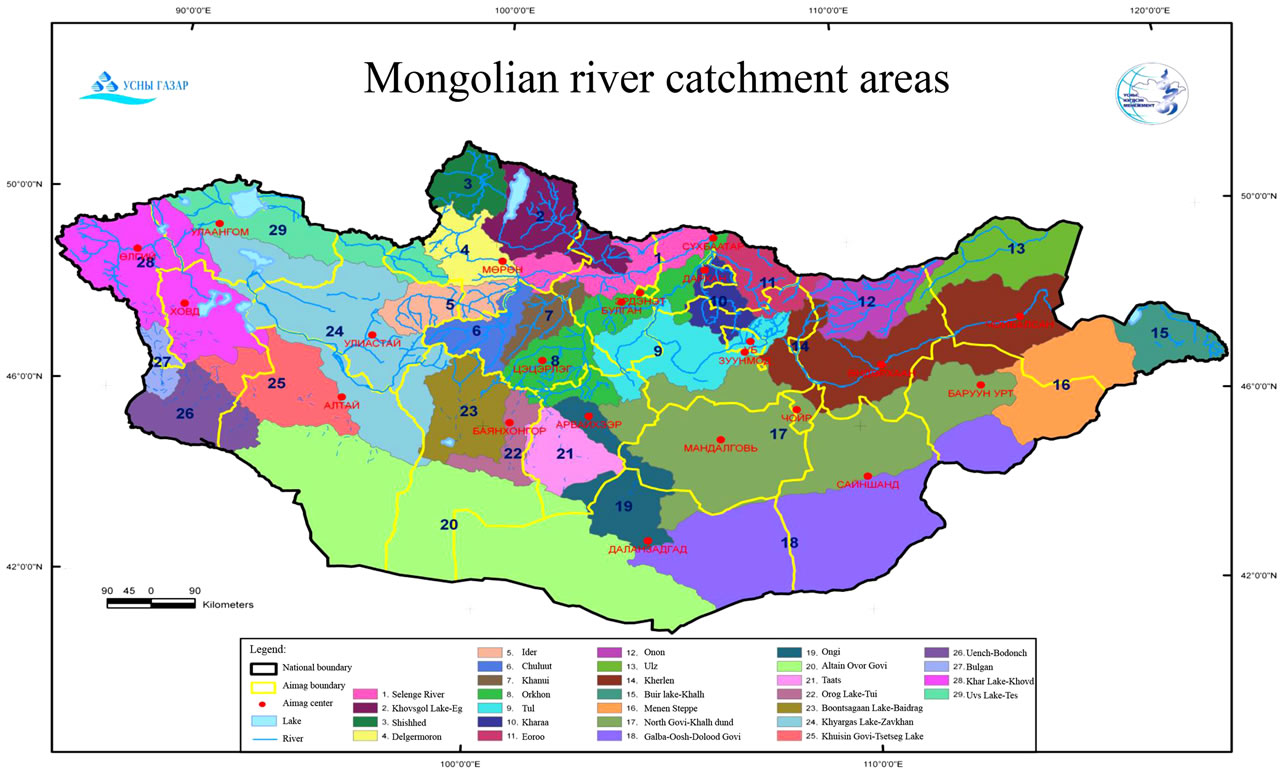
Figure 3. River catchment areas of Mongolia. Source: [9].
meters above the mean sea level. Terrain of the Tuul River basin ranges from 1200 - 2700 meters above mean sea level [12]. According to 1:100000 scaled topographic map of Mongolia, total length of the river is approximately 725 km (did not consider meandering). The runoff module of the river is 0.36 l sec−1∙km2-1; the drainage density is 0.12 km∙km2-1; the length of permanent rivers in the catchment is 5947 km, and the river slope is 0.0015. The Tuul River flows from the northeast to southwest and meanders to the north (figure 4). The catchment area is located in The Arctic Ocean basin and covers approximately 50371 km2, which is equal to 3.2% of entire territory of the country [1].
Consistent with Mongolian river classification, developed by Davaa G., which is based on longtermannual mean flow, the Tuul River is a moderately big river. As shown in Table 1, the Tuul River catchment can be divided into following eight sub-basins.
2.2. Dataset
Two datasets 1) Shuttle Radar Topographic Mission (SRTM)-DEM at a horizontal spatial resolution of 90 meters, 2) ASTER-DEM at a horizontal spatial resolution of 30 meters have been used in this study. Fourth versions of SRTM-DEM datasets, ID 57-03 and 58-03 have been downloaded freely, mosaiced and processed (figure 5). Columns and rows of the one raster data are 6001:6001, respectively. Spatial extent of 57-03 is 100.0, 50.0 decimal degree at the top left and 105.0, 45.0 decimal degree at the bottom right. Spatial extent of 58-03 is 105.0, 50.0 decimal degree at the top left and 110.0, 45.0 decimal degree at the bottom right.
Totally, 45 ASTER-DEM datasets, ID N45-49 E101- 109 have been downloaded, mosaiced and processed (figure 6). Columns and rows of the one raster data are 3601:3601, respectively. Spatial extent of a mosaiced image is 101.0, 50.0 decimal degree at the top left and 110.0, 45.0 decimal degree at the bottom right.
Aforesaid two datasets, SRTM and ASTER, can be downloaded from online database and can be used in scientific research. For that reason, these datasets are widely applied in worldwide.
2.3. Research Method and Methodology
This research has been done by two different models of ArcHydro and ILWIS softwares using aforesaid two datasets. Main methods of the research are the Deterministic-8 [17], the steepest slope [18], the spread, the seek computations and the trace analysis [19]. Seek computation will mainly apply for primary data processing. Briefly, we illustrate the principle of the seek computation with a simple elevation data, provided in Figure 7. For each cell in that data, the steepest downward slope to a neighbor cell is computed, and its direction is stored in a new raster
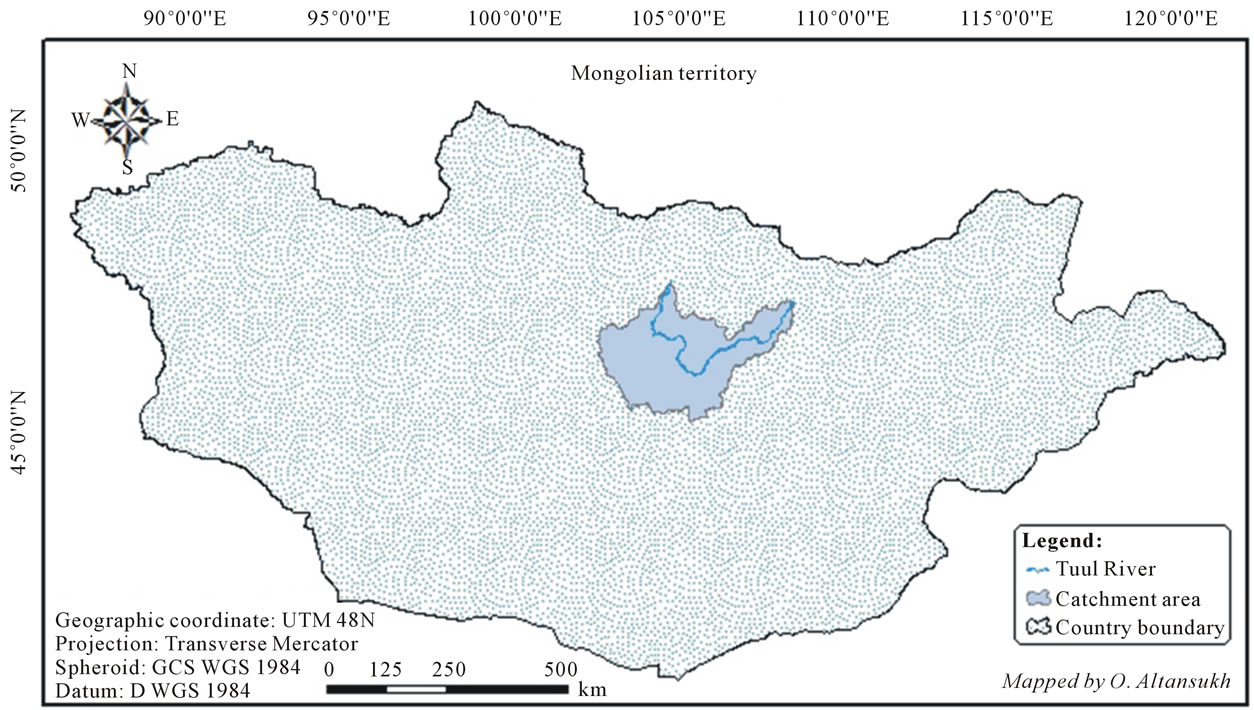
Figure 4. Tuul River, its catchment area in Mongolia. Source: [13].
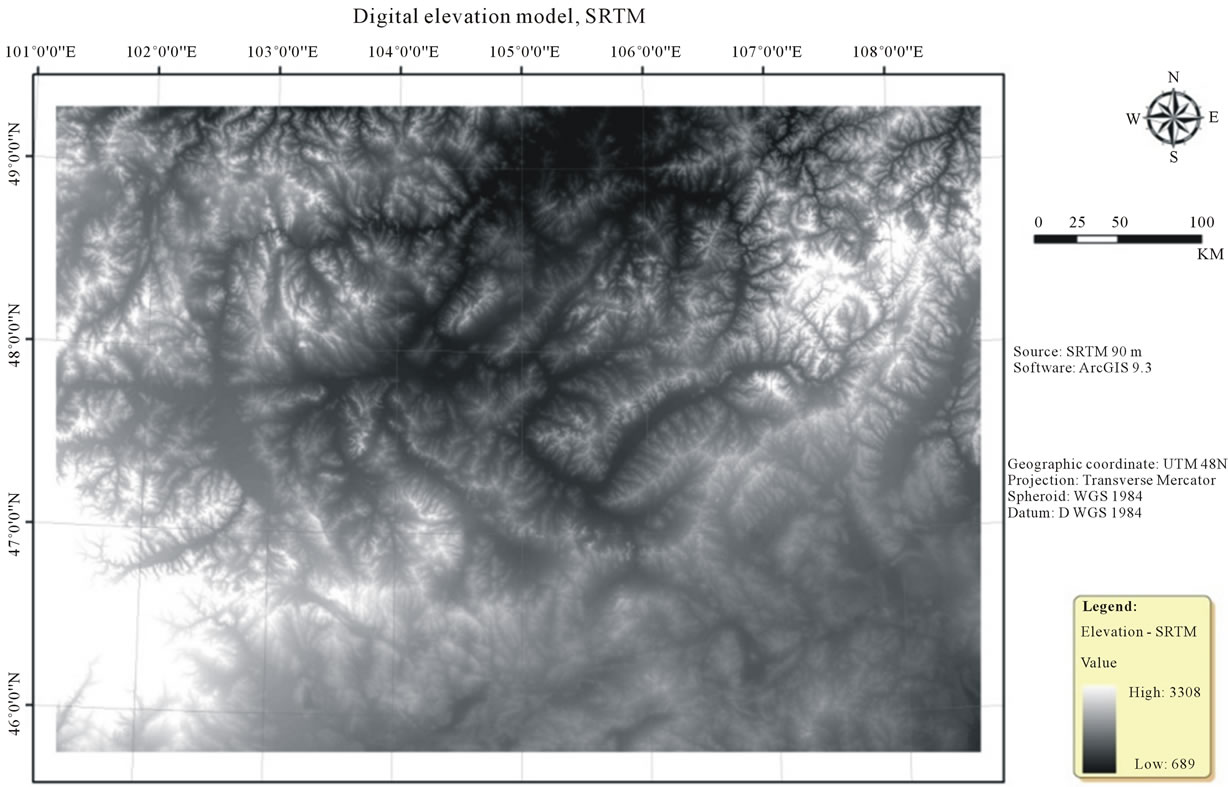
Figure 5. Digital elevation model, SRTM. Data source: [15].
data. This computation determines the elevation difference between the cell and a neighbor cell, and takes into account cell distance 1 for neighbor cells in N-S or W-E direction,  for cells in NE-SW or NW-SE direction. Among its eight neighbor cells, it picks the one with the steepest path to it. The directions in data, thus obtained,
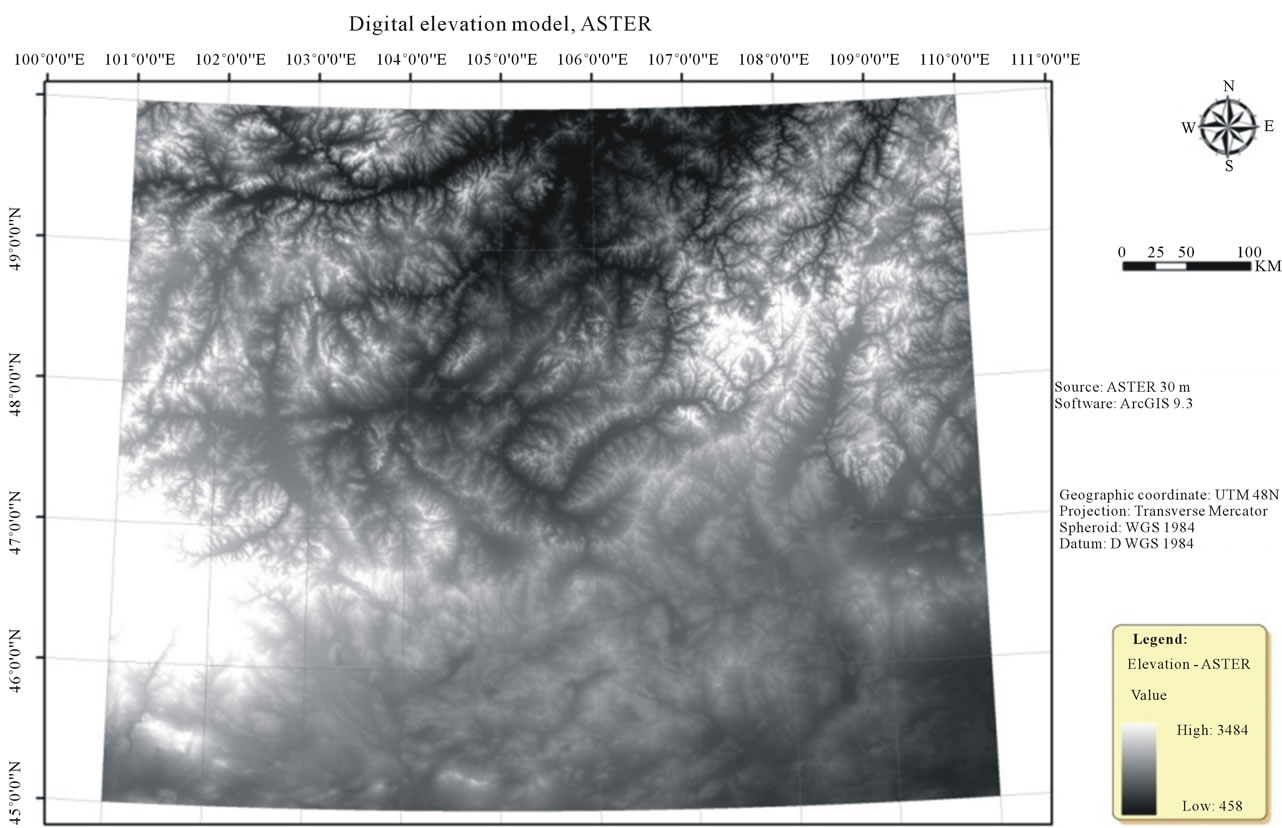
Figure 6. Digital elevation model, ASTER. Data source: [16].
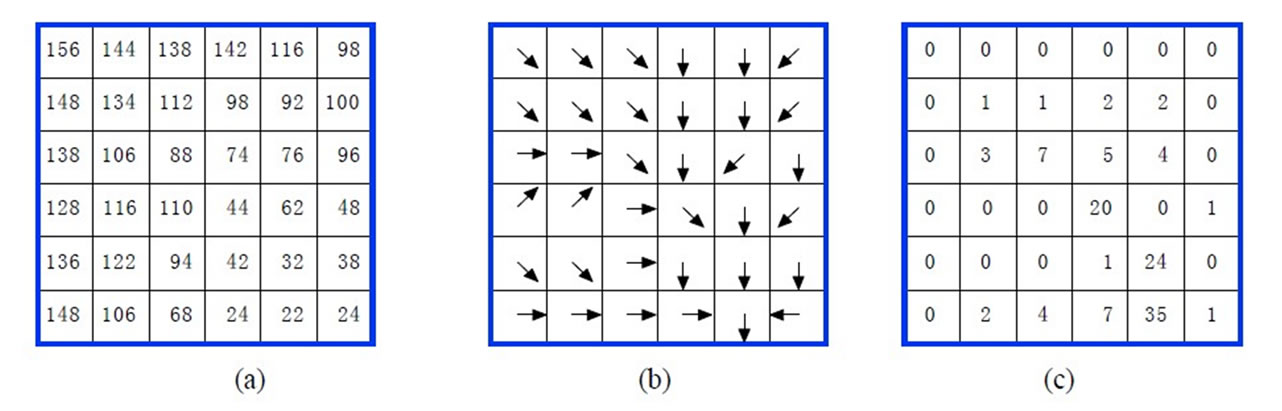
Figure 7. Seek computation. (а) The original elevation data; (b) The flow direction data computed from it; (c) The mathematical model of catchment gathered from it.
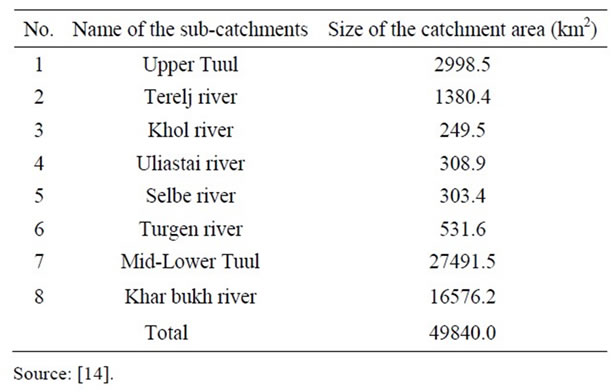
Table 1. Sub-catchments area of the Tuul River.
are encoded in integer values, and we have decoded them for the estimation of flow direction.
Cells with a high accumulated flow count represent areas of concentrated flow, and thus may belong to a stream. Cells with an accumulated flow count of zero are local topographic highs, and can be used to identify ridges [19].
2.3.1. ILWIS Model
Using ILWIS model, basic parameters of the Tuul River and its catchment area have been defined and flowchart of the model is shown in figure 8. Based on “DEM based hydro-processing” handbook [20]; the following
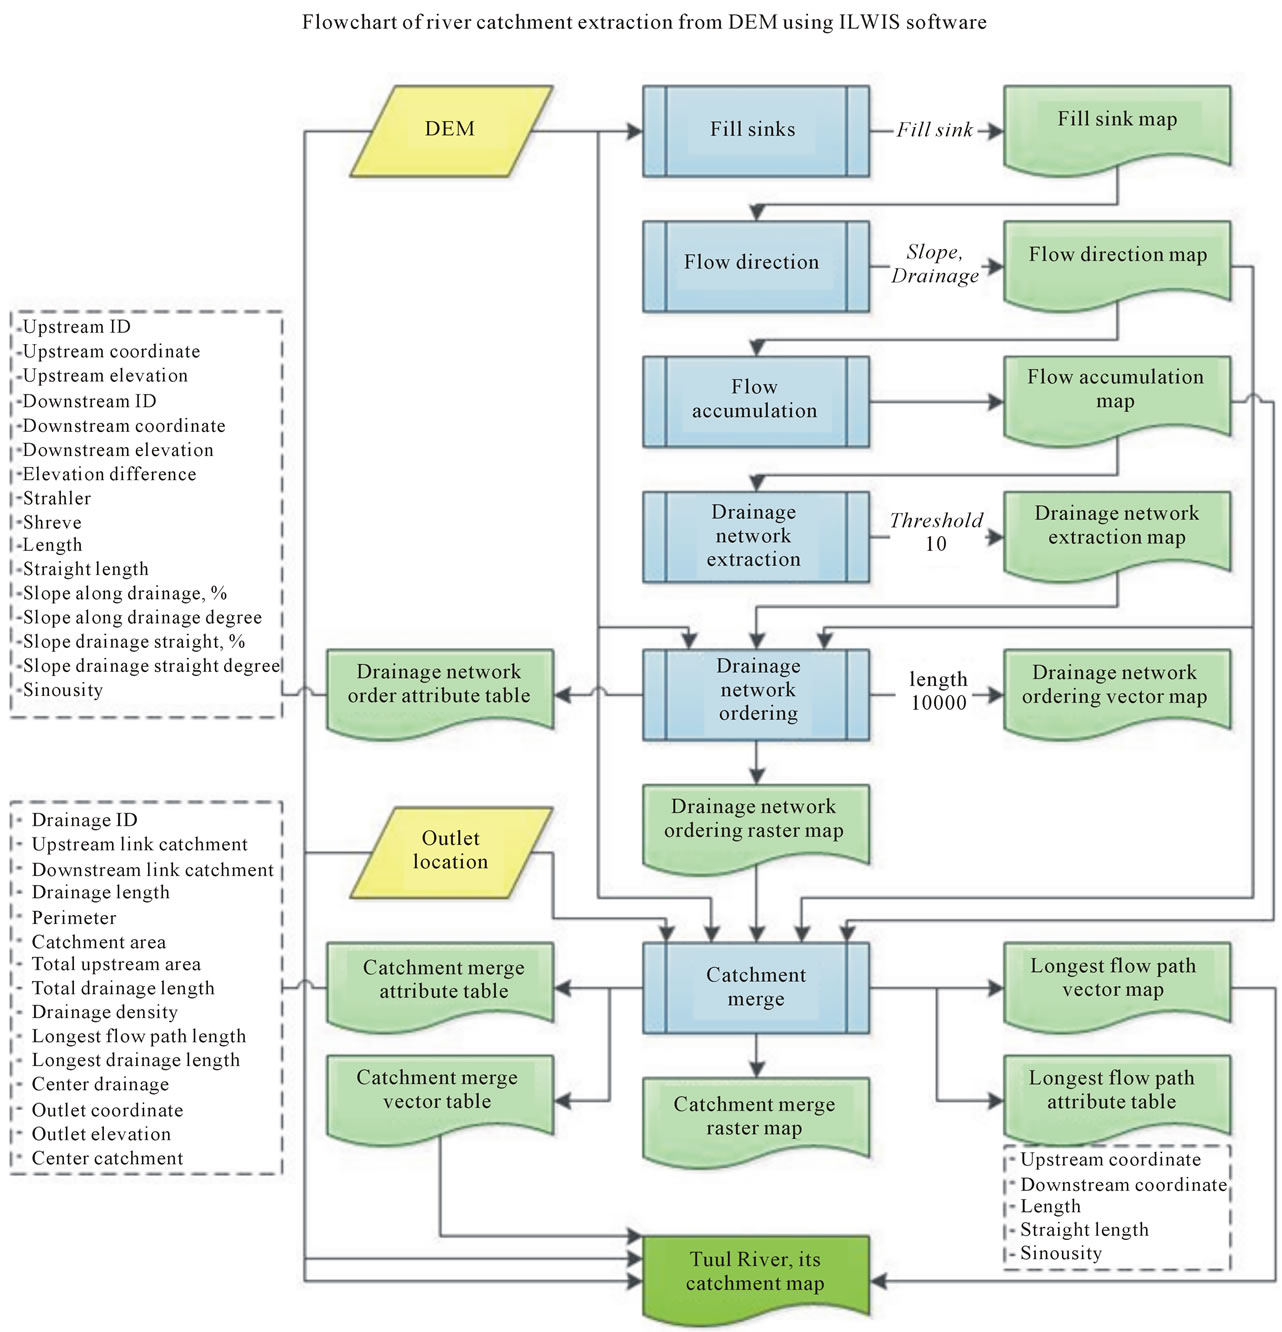
Figure 8. Methodology of ILWIS model.
flow-chart is drawn.
Primary data of the modeling are DEM and outlet location of the river, and processed in above-mentioned 7 phases. Several intermediate results such as flow direction, flow accumulation, drainage network order, catchment boundary and longest flow path are produced while the models run [21].
2.3.2. ArcHydro Model
Using ArcHydro model, basic parameters of the Tuul River and its catchment area have been defined and flowchart of the model is shown in figure 9. Based on “ArcHydro tools—Tutorial” handbook [22]; the following flowchart is drawn.
Primary data of the modeling are DEM and outlet location of the river, and processed in above-mentioned 14 phases. Several intermediate results such as flow direction, flow accumulation, stream definition, drainage line, catchment boundary, watershed point, drainage area centroid and longest flow path are produced while the models run.
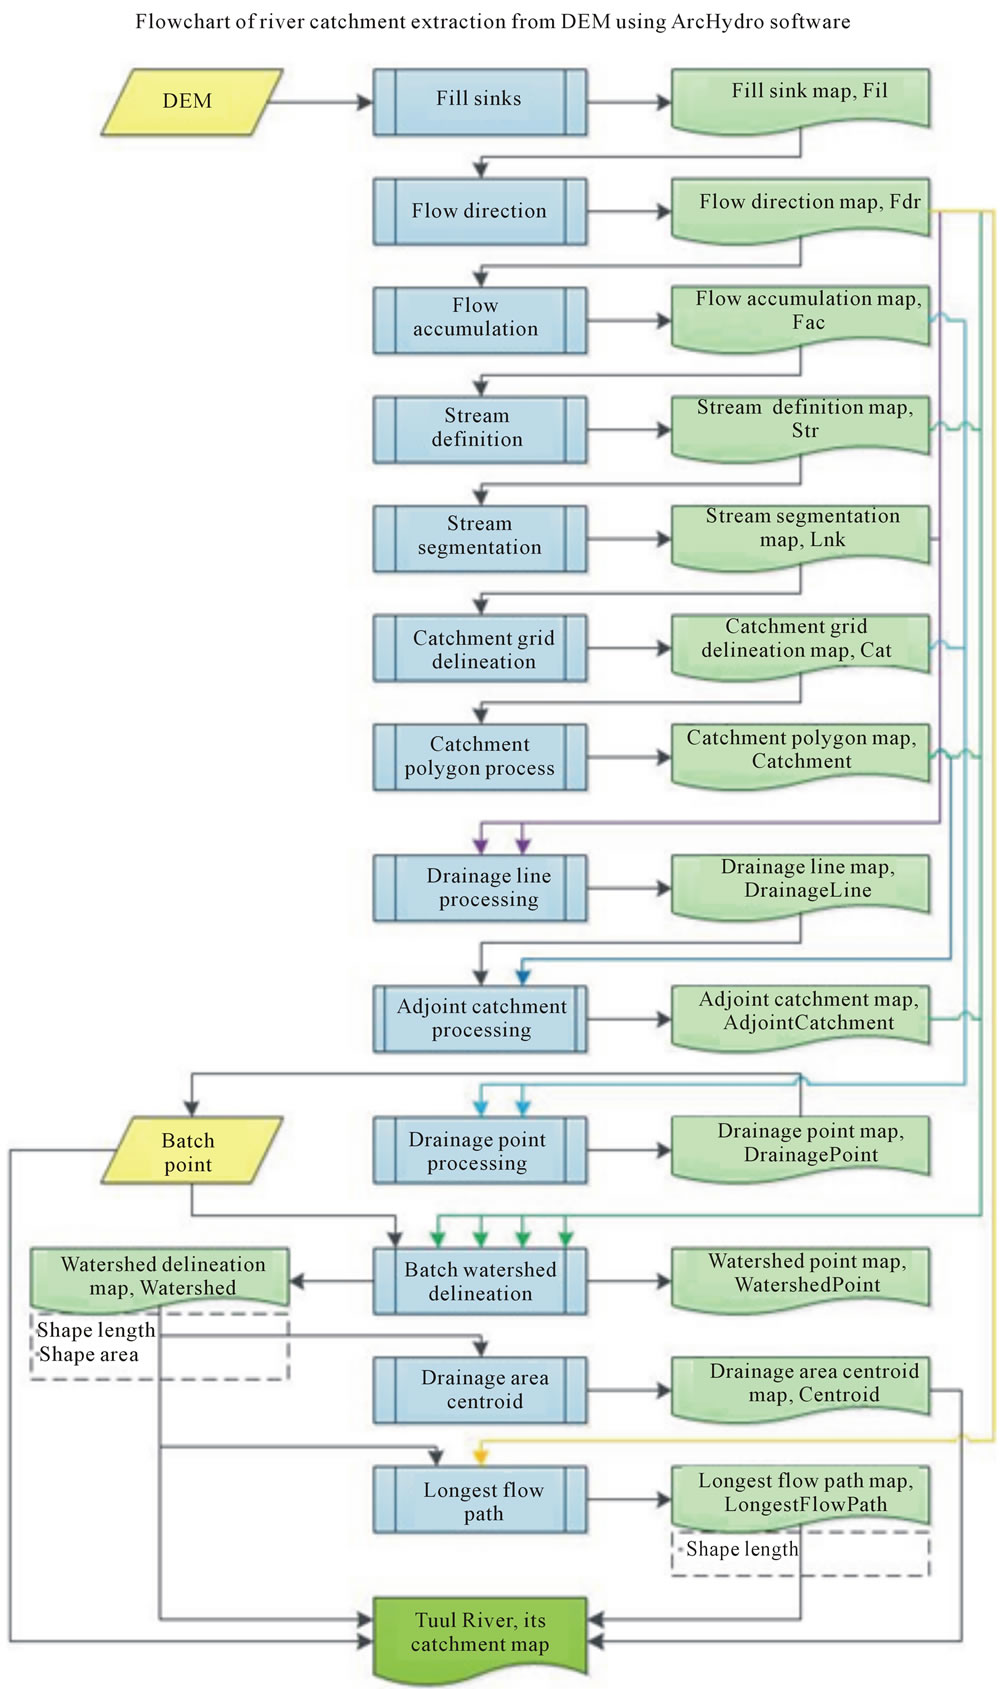
Figure 9. Methodology of ArcHydro model.
3. Results
3.1. Results of ArcHydro Model
DEM based ArcHydro model was run on the both datasets. A horizontal spatial resolution of the SRTM-DEM is coarser than ASTER-DEM. Depending on data quality;a result can be different than actuality. Fourteen intermediate results are produced and basic parameters of the Tuul River, and its catchment area have been definedat the end. Some of the intermediate results are shown in figure 10.
Final results of the model are mapped, and a result of SRTM-DEM data is shown in figure 11; a result of ASTER-DEM data is shown in figure 12.
According to the final result of ArcHydro model, which SRTM-DEM was used, the geographic coordinate of the Tuul River head is 108˚17'54.16'', 48˚33'44.52'', location of the river mouth is 104˚47'54.94'', 48˚57'02'', length of the river is 791.6 km, perimeter of the catchment area is 2326.1 km, area of the catchment is 57780.9 km2, location of the center of the catchment area is 105˚10'20.37'', 47˚36'22.48''.
According to the final result of ArcHydro modelwhich ASTER-DEM was applied, the geographic coordinate of the Tuul River head is 108˚4'36.09'', 48˚34' 33.7'', location of the river mouth is 104˚46'23.17'', 48˚ 54'2.9'', length of the river is 755.8 km, perimeter of the catchment area is 2499.6 km, area of the catchment is 57744.8 km2, location of the center of the catchment area is 105˚10'18.7'', 47˚36'21.9''.
3.2. Results of ILWIS Model
ILWIS model was run on SRTM data. Due to weakness of the software, ASTER data was not run. It occupied 1400 Mb on a computer system. Nine figures and three tabular intermediate results are produced and basic parameters of the Tuul River; its catchment area have been defined at the end. Some of the intermediate results are shown in figure 13.
Final results of the model are mapped in figure 14.
According to the final result of ILWIS model, which SRTM-DEM was applied, perimeter of the catchment area is 2013.8 km, area of the catchment is 57803.8 km2, overall length of the drainage is 15100.3 km, drainage density is 0.26 km∙km2-1, length of longest flow path is 818.5 km, length of the Tuul River is 818.5 km, center of
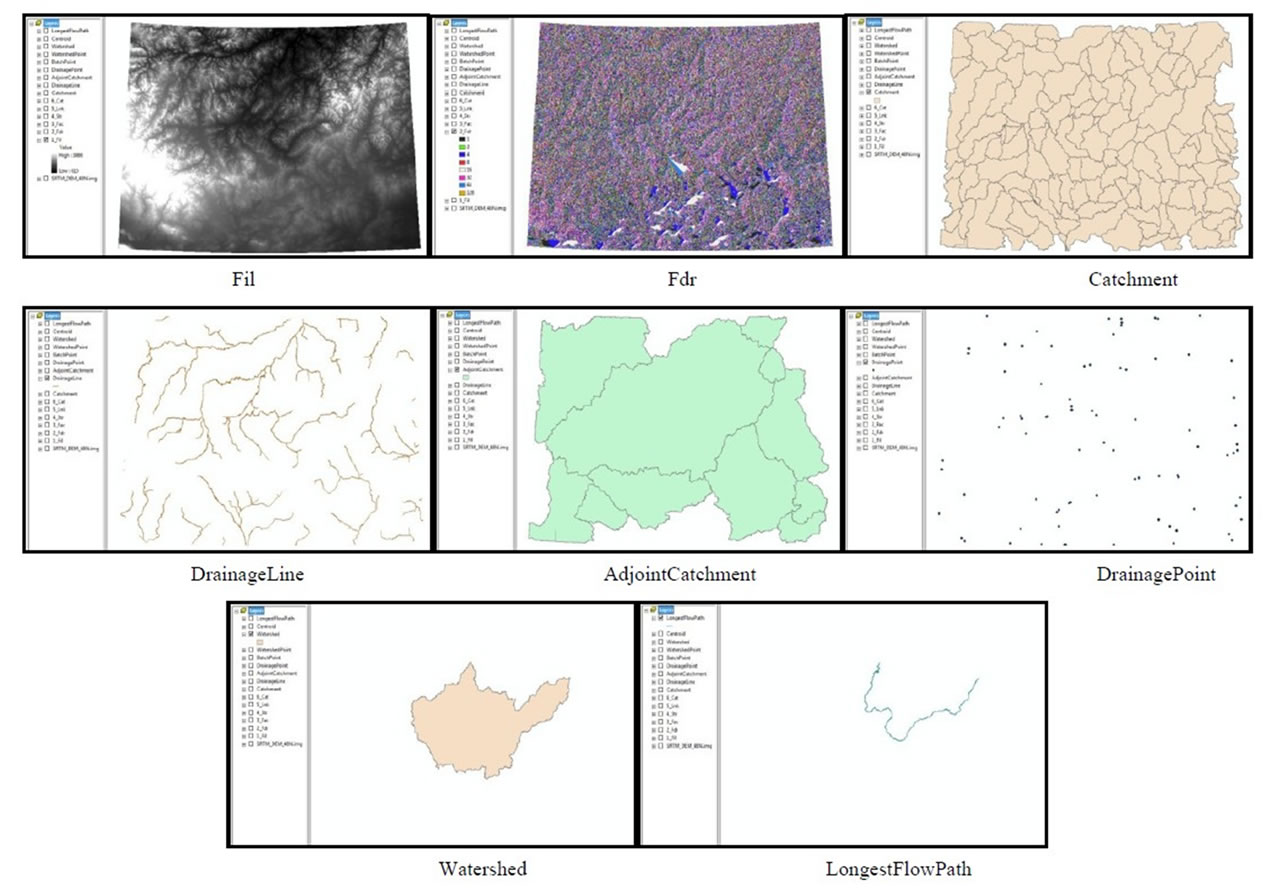
Figure 10. Some intermediate results of ArcHydro model.
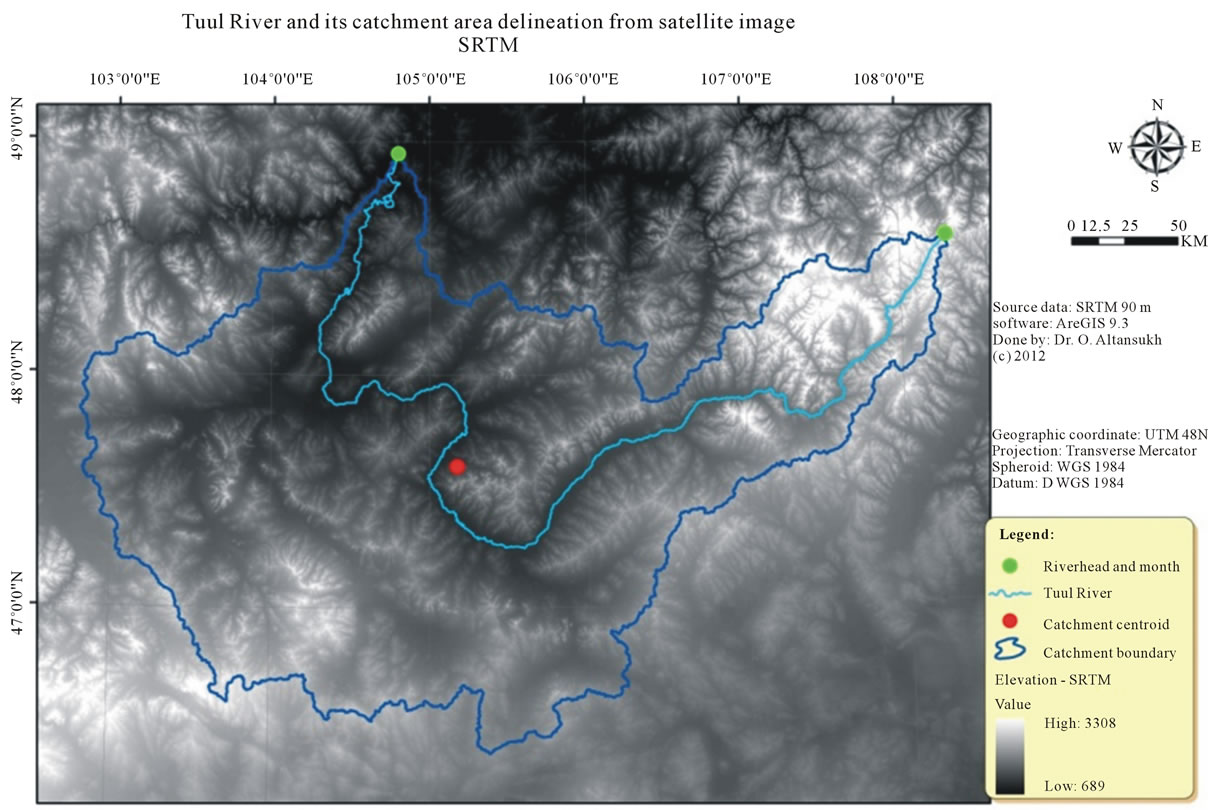
Figure 11. ArcHydro model—A final result of SRTM-DEM.
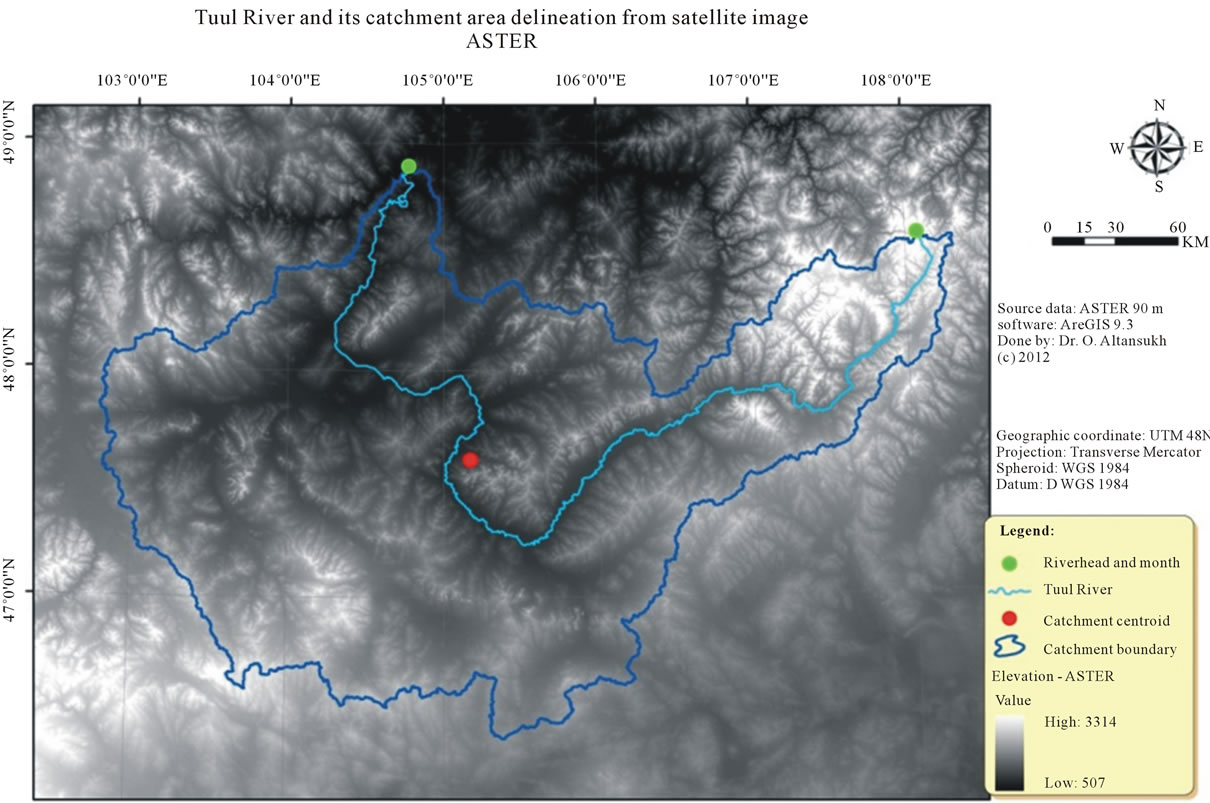
Figure 12. ArcHydro model—A final result of ASTER-DEM.
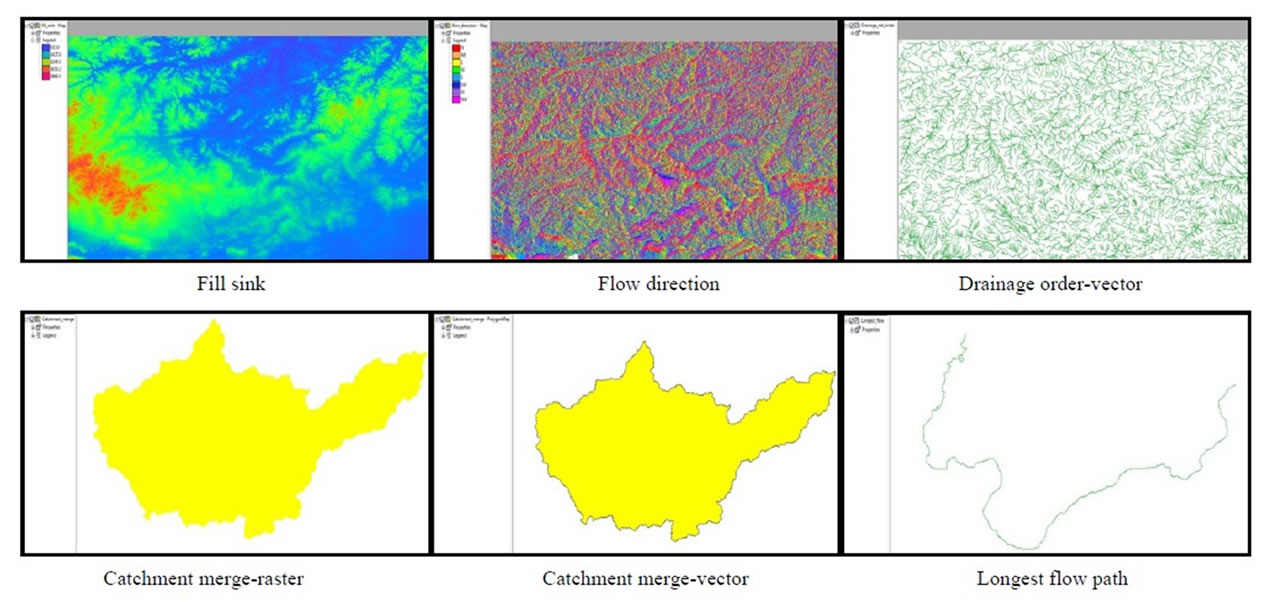
Figure 13. Some intermediate results of ILWIS model.
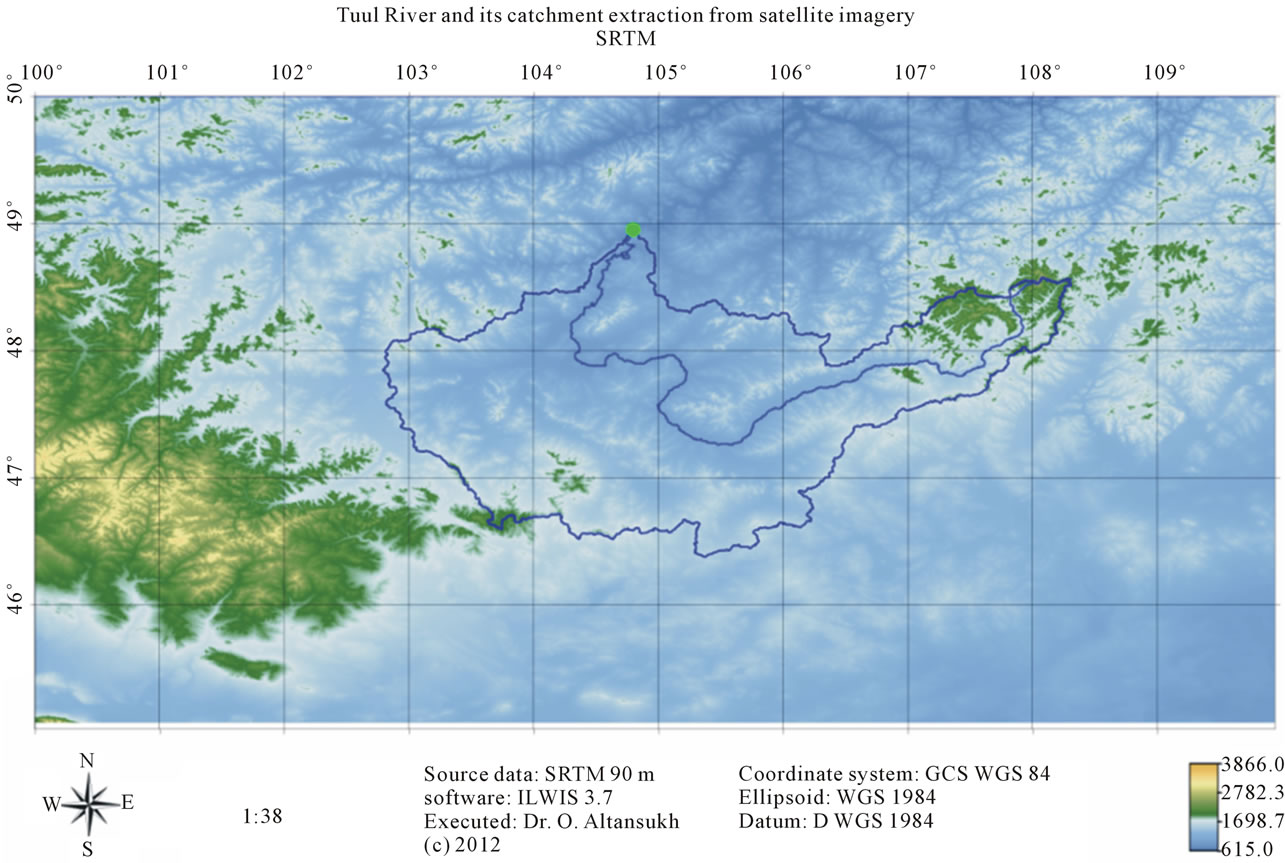
Figure 14. ILWIS model—A final result of SRTM-DEM.
the catchment according to half of the length of the longest flow path is 47˚19'6.0'', 105˚16'12.0'', the geographic coordinate of the Tuul River head is 48˚32'18.0'', 108˚01'27.0'', elevation of the riverhead is 2326.0 m, the geographic coordinate of the Tuul River mouth is 48˚56'48.0'', 104˚47'57.0'', elevation of the river mouth is 778.0 m, catchment center is 47˚39'45.0'', 105˚13'57.0'', elevation difference is 1548.0 m, according to Strahler ordering system, the river belongs to 6th order, according to Shreve ordering system, the river belongs to 704th order, slope drainage is 0.0018 and sinuosity 3.4.
Also, Horton’s statistics calculated and result is shown in table 2 and figure 15 per Strahler order.
As shown table and figure, number of streams is decreased, and average length and area of catchment are increased when river order increased.
3.3. Comparison between Results and Its Application
Two different datasets are applied in two different models, and the final results were compared with each other and with the result of previous research. Differences between maximum and minimum values of the obtained results from models were calculated. In table 3, the sign (-) indicates that parameter cannot be calculated by the model.
The result of this study can be used in baseline and advanced research on the catchment area. Besides of that, the result can define a spatial boundary of study on Tuul River and its catchment area. Moreover, it would have support for decision-making on ground and surface water resource, distribution and management.
4. Conclusion and Discussion
The catchment area of the Tuul River that is located in the center of Mongolia, almost half of population is lived, and an environmentally, economically and socially very significant, has been selected as the study field for this research. The study has been done by two datasets 1)
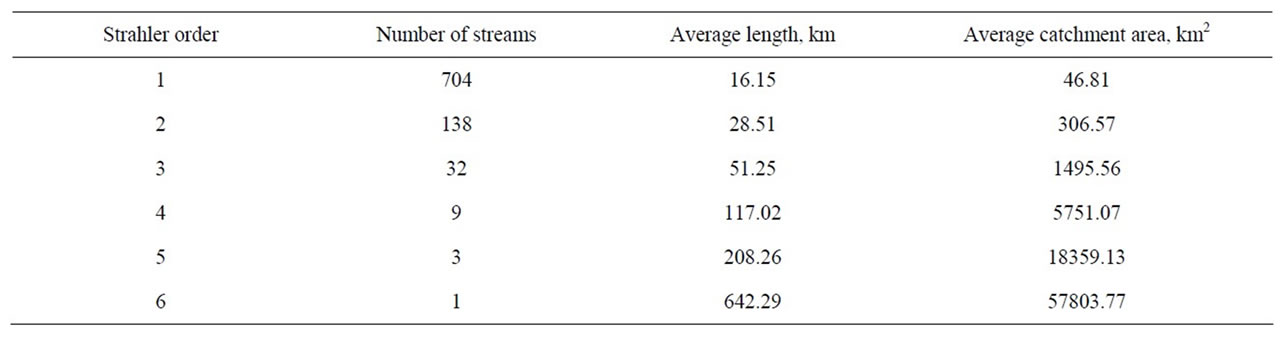
Table 2. Horton’s statistics.
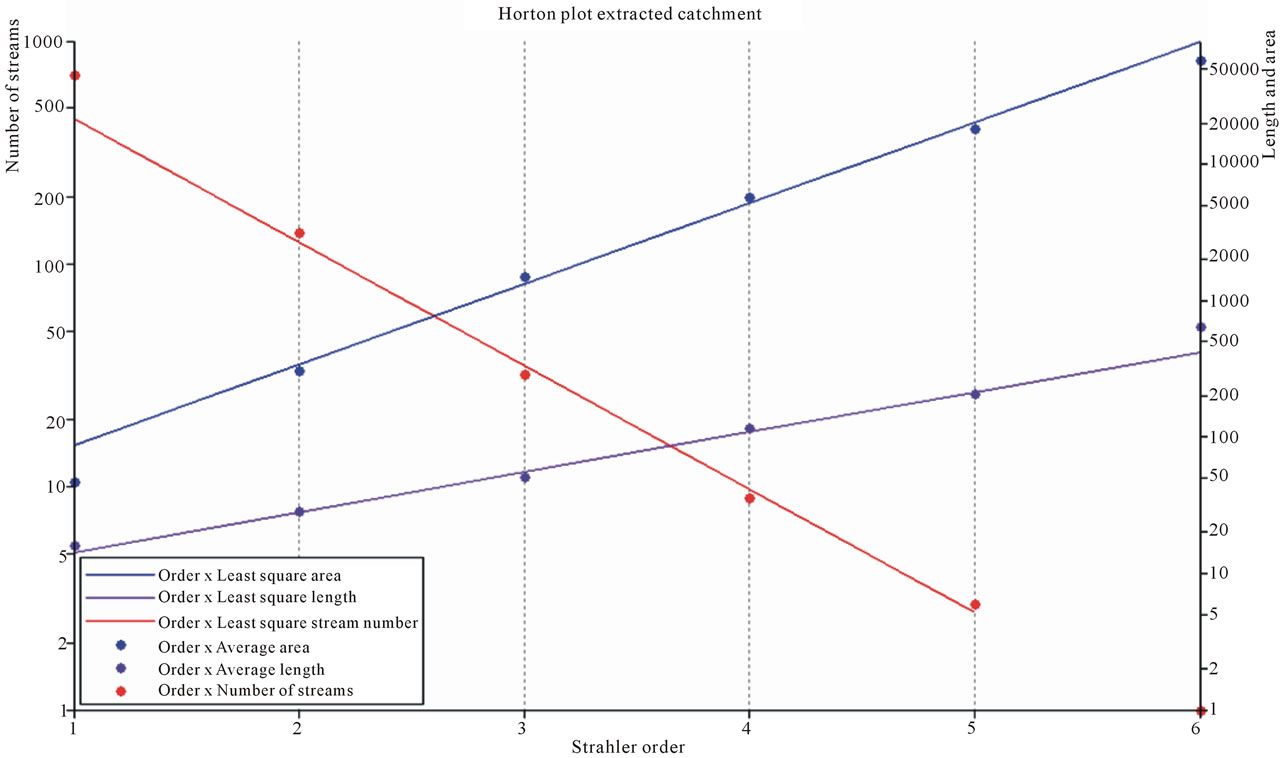
Figure 15. Horton plot.
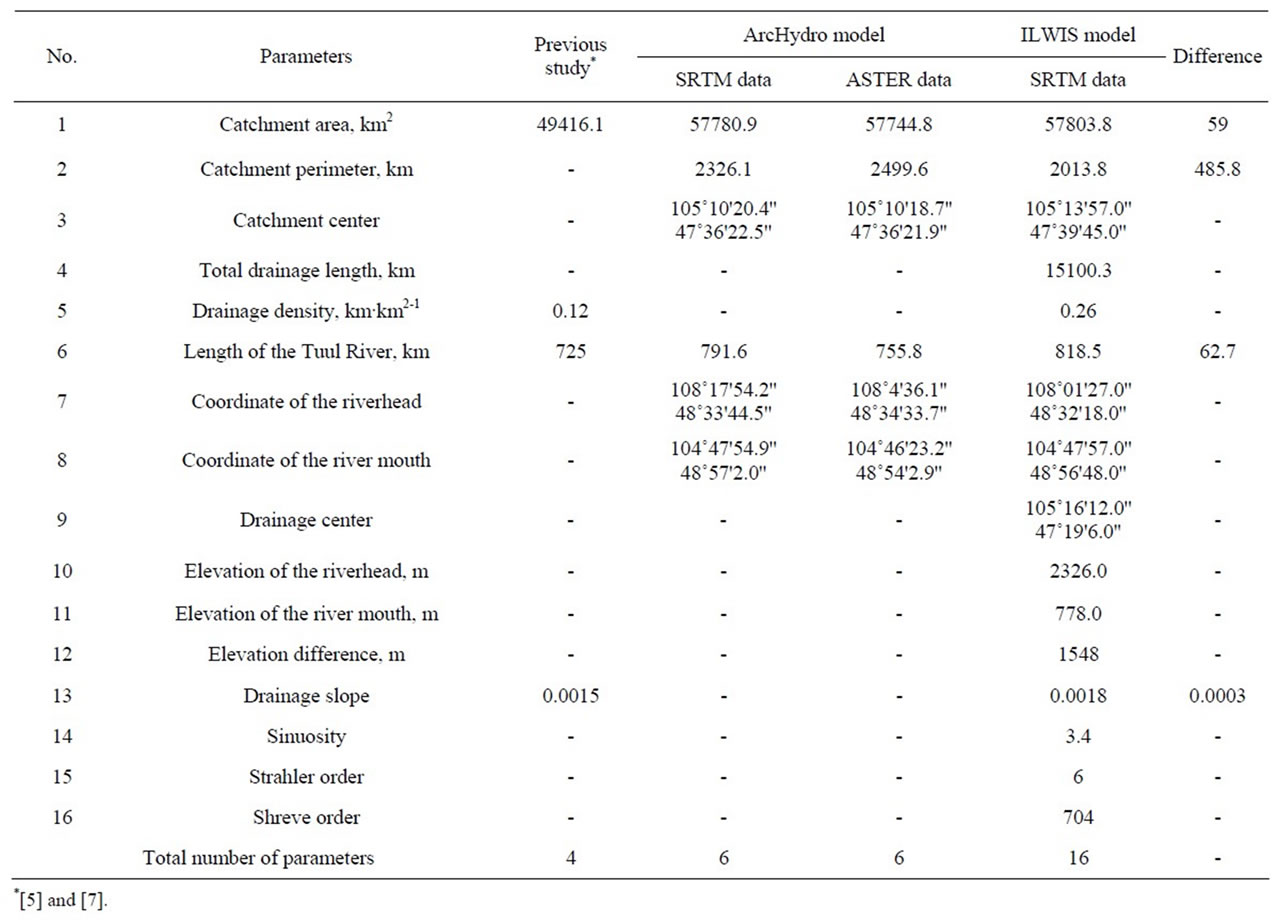
Table 3. Research results, and its comparison.
Shuttle Radar Topography Mission (SRTM) at a horizontal spatial resolution of 90 meters, 2) The Advanced Spaceborne Thermal Emission and Reflection Radiometer (ASTER) at a horizontal spatial resolution of 30 meters, using two different models of ArcHydro and Integrated Land and Water Information System (ILWIS) softwares. Main methods of models, that were used in this research are the Deterministic-8, the steepest slope, the spread, the seek computations and the trace analysis. Moreover, input data of the modeling were digital elevation model (DEM) and outlet location of the river.
In total, six parameters have been defined at the end of the ArcHydro model, and thereof, three parameters were belonged to the catchment area, and three were defined the river spatial characteristics. Moreover, sixteen parameters have been defined by ILWIS model, and hereof, five parameters were defined the catchment area, and eleven measurements were defined the river morphology.
There are some differences between the results of the two models. For instance; minimum and maximum value of the results of the catchment area is 59 km2, which equals to 0.1% of the maximum value. This error is acceptable. On the contrary, minimum and maximum value of the catchment perimeter is 485.8 km, which equals to 19.4% of the maximum value. This error is recognized as unacceptable. Furthermore, minimum and maximum value of the river length is 62.7 km that equals to 7.6% of the maximum value. Therefore, it needs to recheck. So, the river channel has been checked with the river line on the topographic map. From aforesaid three results, ArcHydro-SRTM result was coincided with the map.
At the end of this study, sixteen parameters of the Tuul River and its catchment area have been redefined. In previous research, total length of the Tuul River had been estimated 725 km, and this parameter has been redefined as 791.6 km. Moreover, elevation of the riverhead is defined as 2326 m, and altitude of the river mouth is 778 m, and difference is 1548 m. Therefore, drainage slope is 0.0018; sinuosity is 3.4 and according to Strahler ordering, the Tuul River is pertained to 6th order.
Related to the research result, the raised issue among the researchers is the catchment area and perimeter of the Tuul River. Because of the difference between a previous and recent research result on the catchment area is 8387.7 km2. As shown in figure 16, there is a vast difference in southern border of the catchment.
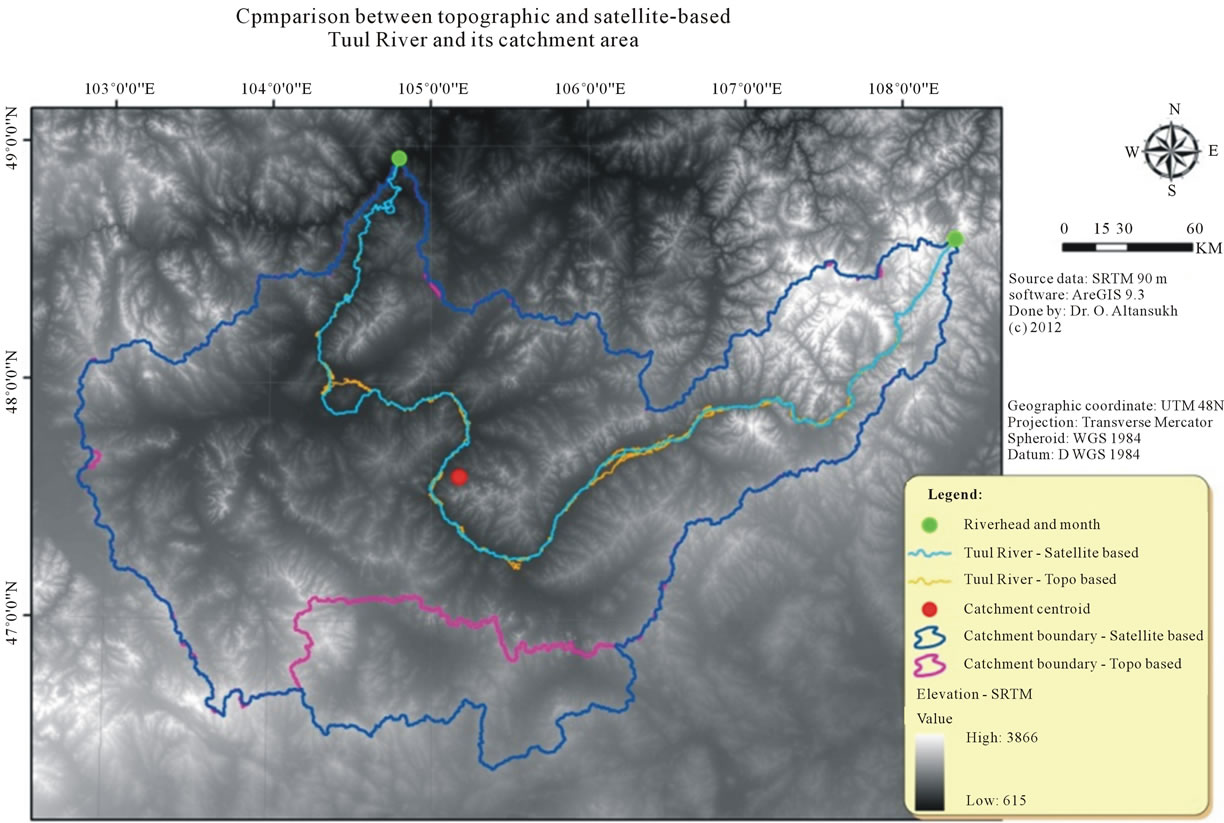
Figure 16. Comparison between topographic and satellite-based Tuul River and its catchment area.
In case of the catchment area of the Tuul River, same results with this study were obtained by other scholars. For instance; Jadambaa N. “Map of the underground water resource in Tuul River basin” [23] and Khudulmur S. “Map of the Tuul River basin” [24].
Thus, it is necessary to check a difference between previous and this study on the catchment area delineation, and based on the discussion among scholars, to select most appropriate one. The selected one will be used in further research.
5. Recommendation
Methodology, applied in this study, can be used to define all 29 bigger rivers and its catchment areas in Mongolia, and results would have positively influenced on national water resource management. Also, the obtained results would be used as a base data in modeling of ground and surface water. The 332nd decision on “River catchment areas of Mongolia” of the Minister of Nature, Environment and Tourism in 2009 has to renew, if a result of further study, which will cover entire Mongolia, would be accepted from vocational organization and experts.
6. Acknowledgements
The authors would like to thank all staffs of Asian Research Center and Open Society Foundation for the research funding. We wish to express our honest gratitude to all staffs of Environmental Information Center, Water Research Sector, especially Dr. G. Davaa and Water Authority for their support for my research.
REFERENCES
- O. Altansukh, “River Flow and Quality Modeling—A Case Study in Tuul River,” Department of GeoecologyEnvironmental Science, National University of Mongolia, Ulaanbaatar city, 2010.
- M. A. E. Bastawesy, R. R. Ali and A. H. Nasr, “The Use of Remote Sensing and GIS for Catchments Delineation in Northwestern Coast of Egypt: An Assessment of Water Resources and Soil Potential,” The Egyptian Journal of Remote Sensing and Space Sciences, Vol. 11, 2008, pp. 3-16.
- O. Altansukh, “Surface Water Database of Mongolia,” Environmental Information Center, 2009.
- MPR, “The Atlas of the Climate and Ground Water Resources in the Mongolian People’s Republic,” In: D. Tuvdendorj and B. Myagmarjav, 10th Factory of DUDK, Ulaanbaatar city, 1985.
- MPR, “Schematization of Integrated Water Resources Management of the Selenge River Basin,” In: E. Damba, Administration of Geodesy and Cartography, Ulaanbaatar city, 1986.
- MAS, “The National Atlas of the Mongolian People’s Republic,” Cartographic Factory of the Minsk City, Ulaanbaatar city.
- D. Basandorj and G. Davaa, “Tuul River Basin of Mongolia—Integrated Water Resource Management,” Interpress, Ulaanbaatar, 2006.
- MAS-IG, “Mongolian National Atlas,” Institute of Geography, Ulaanbaatar city, 2009.
- WA, “Mongolian River Catchment Area,” MNET, Ministry of Nature, Environment and Tourism, Ulaanbaatar city, 2009.
- NGIC, “Geoinformation Atlas of the Environment,” Ulaanbaatar city, 2010.
- N. Donia, “Application of Remotely Sensed Imagery to Watershed Analysis; A Case Study of Lake Karoun Catchment, Egypt,” Thirteenth International Water Technology Conference, IWTC, Hurghada, 2009, pp. 1035- 1049.
- N. Dashdeleg and B. Bat, “Mongolian Rivers,” Sukhbaatar Press, Ulaanbaatar city, 1971.
- O. Altansukh and G. Davaa, “Application of Index Analysis to Evaluate the Water Quality of the Tuul River in Mongolia,” Journal of Water Resource and Protection, Vol. 3, No. 6, 2011, pp. 398-414. doi:10.4236/jwarp.2011.36050
- B. Myagmarjav and G. Davaa, “Surface Water of Mongolia,” Interpress, Ulaanbaatar city, 1999.
- A. Jarvis, et al., “Hole-Filled Seamless SRTM Data V4,” International Centre for Tropical Agriculture (CIAT), 2008.
- NASA, “Land Processes Distributed Active Archive Center (LPDAAC)-ASTER GDEM L1B,” USGS/Earth Resources Observation and Sciences (EROS) Center, 2001.
- ESRI, “ArcHydro—GIS for Water Resources,” ESRI. 203, California, 2002.
- W. Koolhoven, J. Hendrikse and W. Nieuwenhuis, “ILWIS,” ITC, Enschede, 2007.
- R. A. D. By, R. A. Knippers and M. J. C. Weir, “Principles of Geographic Information Systems,” 3rd Edition, In: R. A. D. By, Ed., An Introductory Textbook, ITC, Enschede, 2004.
- B. H. P. Maathuis, “DEM Based Hydro-Processing,” ITC, Enschede, 2007.
- B. H. P. Maathuis and L. Wang, “Digital Elevation Model Based Hydro-Processing,” Geocarto International, Vol. 21, No. 1, 2006, pp. 21-26. doi:10.1080/10106040608542370
- ESRI, “ArcHydro—Tools and Tutorial,” ESRI, New York, 2009.
- N. Jadambaa, “Map of the Underground Water Resource in Tuul River Basin,” MAS-Institute of Geoecology, Ulaanbaatar, 2009.
- S. Khudulmur, “Tuul River Basin Map,” NGIC Project, Ulaanbaatar, 2009.
NOTES
*The research is financed by Asian Research Center (ARC) and Open Society Foundation (OSF).