Pharmacology & Pharmacy
Vol.07 No.11(2016), Article ID:71964,16 pages
10.4236/pp.2016.711051
Combination of Paracetamol and the Glutathione Depleting Agent Buthionine Sulfoximine Show Differential Effect on Liver Cancer Cells and Normal Hepatocytes
Marwa E. Sayour1, Rania M. Abd El Salam2, Mohamed F. Elyamany2, Abeer M. El Sayed3, Raafat A. El-Awady1,4*
1National Cancer Institute, Cairo University, Cairo, Egypt
2Department of Pharmacology & Toxicology, Faculty of Pharmacy, Cairo University, Cairo, Egypt
3Department of Pathology, National Cancer Institute, Cairo University, Cairo, Egypt
4Sharjah Institute for Medical Research and College of Pharmacy, University of Sharjah, Sharjah, UAE

Copyright © 2016 by authors and Scientific Research Publishing Inc.
This work is licensed under the Creative Commons Attribution International License (CC BY 4.0).
http://creativecommons.org/licenses/by/4.0/


Received: October 10, 2016; Accepted: November 11, 2016; Published: November 14, 2016
ABSTRACT
Background: Paracetamol exerts toxic effects on liver cells through its metabolism into N-acetyl-p-benzoquinone imine (NAPQI), which is detoxified by conjugation with cellular glutathione (GSH). Once GSH is depleted, NAPQI stimulates a range of oxidative reactions that result in cell necrosis. The aim of the present investigation is to find a new strategy that would selectively protect normal hepatic tissues and sensitize liver cancer cells to the toxic effects of paracetamol or its metabolite. This may lead to the development of a targeted therapy for liver cancer. Methods: The anti- proliferative effects of paracetamol and buthionine sulfoximine BSO (a glutathione depleting agent) alone and in combination on the liver cancer cells HepG2 and normal rat hepatocytes were investigated by sulphorhodamine-B assay. Effects on cell cycle regulation and induction of apoptosis were tested by flow cytometry. The level of prostaglandin expression was measured by ELISA. Results: The present study showed that both agents alone or in combination have anti-proliferative effects on both cell types. Surprisingly, BSO showed a cytoprotective effects on normal hepatocytes treated with high concentrations (1.75 and 2 mM) of paracetamol. This was confirmed by cell cycle analysis that recorded decreased fraction of sub-G1 cells indicating reduction of apoptosis in normal hepatocytes. Analysis of prostaglandin E2 revealed differential effects of paracetamol on normal and liver cancer cells. A signi- ficant increase in PGE2 level over the control was observed in normal hepatocytes whereas a significant decrease was seen in HepG2 cells after treatment with paracetamol. Conclusion: These results indicate that combination of paracetamol/BSO has differential effects on liver cancer cells and normal hepatocytes, which opens the avenue for a new effective and selective combination for management of liver cancer.
Keywords:
Paracetamol, Buthionine Sufoximine (BSO), Selective GSH Depletion, HepG2, Prostaglandin E2 (PGE2)

1. Introduction
Being the current leading cause of death worldwide, cancer is considered as one of the major health problems. Primary cancers of the liver represent the fifth most common malignancy worldwide and the second most common cause of death from cancer [1] . Traditional treatments for liver cancer are not entirely effective and their applications are limited. The goal of this study is to find strategies that would produce preferential protection of normal tissues or preferential sensitization of tumor cells.
In addition to its ability to treat pain and fever, Paracetamol was found to induce apoptosis and necrosis in various types of cultured liver carcinoma cells specially HepG2 cell line [2] . The key event of paracetamol cytotoxicity is its transformation into the reactive metabolite N-acetyl-p-benzoquinone imine (NAPQI) by cytochrome P450 family [3] [4] [5] [6] which can induce apoptosis or necrosis on different cell models [7] [8] . It’s worth mentioning that HepG2 cells show high expression of mRNA and protein levels of cytochrome P450 2E1; the one responsible for bioactivation of NAPQI. In normal cases NAPQI is primarily detoxified by conjugation with intracellular glutathione (GSH). Many human tumor cells cultured in vitro were shown to contain extremely high levels of GSH [9] [10] which are particularly relevant in regulating mutagenic mechanisms. However, after cellular GSH depletion it is thought that NAPQI causes cytotoxicity by binding to cellular macromolecules, although the exact mechanism of cellular toxicity remains a subject of controversy [11] [12] . High levels of PGs have been reported for many types of cancer and it has been shown that GSH is needed for PGE2 production [13] . In vivo, paracetamol inhibits cyclooxygenase enzymes (COX) peripherally and centrally suppressing prostaglandins production. Buthionine sulfoximine (BSO) is a glutathione depleting agent that inhibits the enzyme gamma-glutamylcysteine synthetase which is required in the early steps of glutathione synthesis. It is being investigated as an adjunct with chemotherapy in the treatment of cancer and parasitic diseases [14] . The aim of the present study is to test the effect of buthionine sulfoximine and prostaglandin E level on the cytotoxic effects of paracetamol on cancer and normal liver cells. The ultimate goal is to find a novel more effective therapy for liver cancer.
2. Material and Methods
2.1. Cell Lines and Culture Conditions
Human liver carcinoma cell line (HepG2) and primary normal rat hepatocytes were used in this study. HepG2 cell line was purchased from American Type Culture collection and was maintained in Dulbeco’s Modified Eagle’s Medium with phenol red (DMEM, Lonza, Belgium) supplemented with 10% fetal bovine serum (Cambrex, Belgium), penicillin/streptomycin (Lonza, Belgium). The Primary liver cells were isolated from male rat liver by two-step collagenase perfusion method according to Seglen [15] and were cultured in collagen-coated 96-well plates and 25 cm2 tissue culture flasks in DMEM without phenol red. Platting Supplement kit A (FBS + Dexamethasone + Penicillin/Streptomycin + Human Insulin + Glutamax + HEPES buffer) (Gibco/Invitrogen, USA) was added to 500 ml of DMEM. This assures perfect platting and attachment criteria. Eight hours later, old medium was replaced with William’s E medium (without phenol red) supplemented with maintenance supplement kit B (Dexamethasone + Penicillin/Streptomycin + Human Insulin + Transferrin + Selenium Complex + Bovine Serum Albumine + Lenoleic Acid + Glutamax + HEPES buffer) (Gibco/Invitrogen, USA). All incubations were done at 37˚C in a humidified atmosphere of 5% CO2. Mycoplasma was tested at 3 months intervals.
2.2. Chemosensitivity Assay
Cytotoxicity of paracetamol alone (Bristol-Myers Squibb Pharmaceuticals Ltd, Anagni, Italy) or in combination with DL-Buthionine-(S, R)-Sulfoximine (Sigma, USA) was determined using sulpho Rhodamine-B (SRB) method as previously described [16] . Cells were seeded in 96-well microtiter plates at a density of 5 × 10³ cells/well. After 24 h, cells were incubated with either paracetamol alone (1, 1.25, 1.5, 1.75, and 2 mM) or BSO alone (1 mM). Control cells treated with DMSO (not exceeding a final concentration of 0.5% were included in each experiment. Triplicate wells were prepared for each drug concentration. For combination therapy BSO (1 mM) was added to the cells 8 h before every paracetamol concentration (1, 1.25, 1.5, 1.75, and 2 mM). Following 48 h treatment, the cells were fixed. Wells were washed, stained with 0.4% (w/v) SRB dissolved in 1% acetic acid and then washed several times in 1% acetic acid. The bound dye was solubilized with 10 mM Tris base (pH 10.5). The optical density was measured spectrophotometrically at 564 nm with an ELIZA microplate reader (Meter tech. S960, USA). The IC50 values were calculated using sigmoidal concentration-response curve fitting models (GraphPad, Prism software, USA).
2.3. Cell Cycle Distribution Analysis
Cell cycle and apoptosis were analyzed by flowcytometry as previously described [17] . A population of 105 cells was seeded in 25 cm2-cell culture flasks and treated after 24 h with either paracetamol alone or in combination with BSO then flasks were incubated at 37˚C. After 48 h, cells were collected and the cell suspension was fixed in 70% ethanol, treated with RNAse and 50 µl propidium iodide solution (1 mg/ml) was added and the DNA content was analysed by flowcytometry in FACScan (Becton Dicenson, Germany).
2.4. Prostaglandin E2 Quantitative Assay
The level of prostaglandin E2 (PGE2) in control and treated cells was measured colorimetrically using PGE2 assay kit purchased from R & D Systems (Minneapolis, USA). It is an accurate competitive immunoassay method that was done according to the manufacturer’s instructions. Briefly, 105 cells were seeded in 25 cm2-cell culture flasks and treated after 24 h with either paracetamol alone or in combination with BSO then flasks were incubated at 37˚C. After 48 h, cell culture supernatants were collected and centrifuged. This cell extract was used to measure PGE2 quantitatively by mixing in a 96-well plate with the reagents supplied with the kit. The PGE2 standard dilution series was made from the highest standard stock (supplied with the kit). The color development is stopped, and the absorbance is read at 450 nm using a spectrophotometric ELISA microplate reader (Meter tech. S960, USA).
2.5. Data Analysis
Statistical analysis, data fitting and graphics were performed by the Prism 5.03 computer program (GraphPad Software, USA). Data are given as mean ± SEM of at least three independent experiments. Multiple comparisons were carried out using one way analysis of variance (ANOVA) followed by LSD (least significant difference) post-hoc test. Statistical significance was acceptable at a level of p < 0.05.
3. Results
3.1. Effect of Paracetamol Alone and in Combination with BSO on the Survival of Hepatoma Cell Line (HepG2) and Normal Rat Hepatocytes
Survival of hepatoma (HepG2) cells was reduced following treatment with paracetamol alone in a concentration-dependant manner. Addition of BSO enhanced the anti-proliferative effect of paracetamol on HepG2 cells (Figure 1). The IC50 of paracetamol on HepG2 cells was reduced from 1.389 mM to 0.995 mM after addition of BSO. The highest anti-proliferative effect of the combined treatment was noticed at 1.5 mM paracetamol plus 1 mM BSO (Figure 1).
On the other hand, the addition of BSO potentiated the cytotoxic effect of paracetamol on normal hepatocytes at low (1.00, 1.25 and 1.5 mM) but not at high concentrations (1.75 and 2 mM) of paracetamol (Figure 2). Combination of 1 mM BSO with either 1.75 or 2 mM of paracetamol produced a cytoprotective effect seen obviously as an enhancement in the survival of normal hepatocytes. The best cytoprotective effect was noticed when BSO was combined with 2 mM paracetamol leading to an elevation in the cell survival and increased resistance to the cytotoxic effect of paracetamol (Figure 2). The IC50 of paracetamol on normal hepatocytes was reduced from 2.221 to 1.527 mM after addition of BSO. Summary of all survival results of both cell lines are given in Table 1.
3.2. BSO Modifies the Cell Cycle Progression of Paracetamol Treated Cells
In order to understand the mechanisms underlying the anti-proliferative effects of

Figure 1. Sensitivity of the liver cancer HepG2 cells to paracetamol, BSO and their combination. (a) Sensitivity of HepG2 cell line to Paracetamol in the presence or absence of 1 mM BSO was measured by SRB assay. After seeding, HepG2 cells were treated with paracetamol alone (1 - 2 mM) or in combination with BSO (1 mM) 8 hours before each paracetamol concentration and cell survival was measured 48 h later by SRB assay. Each value represents the mean ± SEM of 3 independent experiments performed in triplicates. Statistical analysis was carried out using paired t test. asignificantly different from the respective control group at p < 0.05. bsignificantly different from the respective paracetamol only treated group at p < 0.05. (b) Sensitivity of HepG2 cell line to the best effective dose of paracetamol alone (1.5 mM), BSO alone (1 mM) and their combination. The highest anti-proliferative effect was noticed with that combination. Each value represents the mean ± SEM of 3 independent experiments performed in triplicates. Statistical analysis was carried out using one way ANOVA followed by Tukey’s multiple comparison as post-hoc test. asignificantly different from the respective control group at p < 0.05. bsignificantly different from the respective paracetamol alone group at p < 0.05. (c) Sensitivity of HepG2 cell line to paracetamol alone and in combination with BSO expressed as IC50a values. aIC50, concentration of the drug that results in 50% cell growth inhibition when compared to control cell growth.
paracetamol and BSO and to understand the mechanism of their interaction, effects on cell cycle regulation and induction of apoptosis were measured.
Treatment of HepG2 cells with BSO alone for 48 h showed no remarkable changes in cell cycle distribution compared with control cells while treatment with paracetamol alone for the same period arrested cells at G1 phase. Upon combining BSO and paracetamol, a complete G1 block was noticed (Figure 3).
Longer exposure to drugs (72 and 96 hr) revealed a fraction of subG1 cells indicative of apoptosis. This SubG1 area was greatly increased upon treatment of HepG2 with paracetamol alone and in combination with BSO for 72 and 96 h (Figure 3(a), Figure 3(b)).
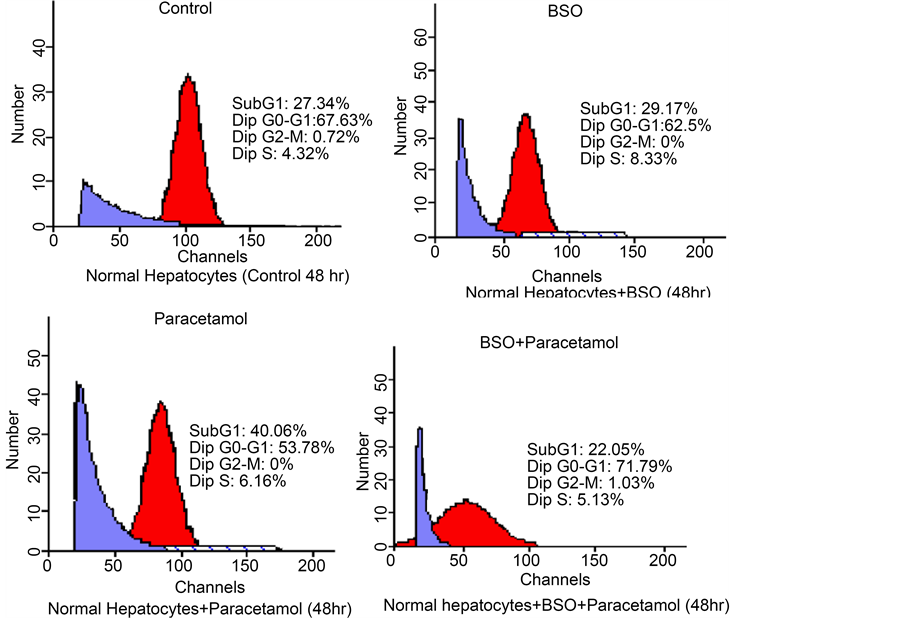
Control primary normal rat hepatocytes showed a high fraction of subG1 cells which may be attributed to the use of collagenase and hyaluronidase in cells isolation. After 48 hr treatment with paracetamol, a strong amplification of the subG1 phase was noticed denoting the occurrence of apoptosis and/or necrosis. However, pretreatment of
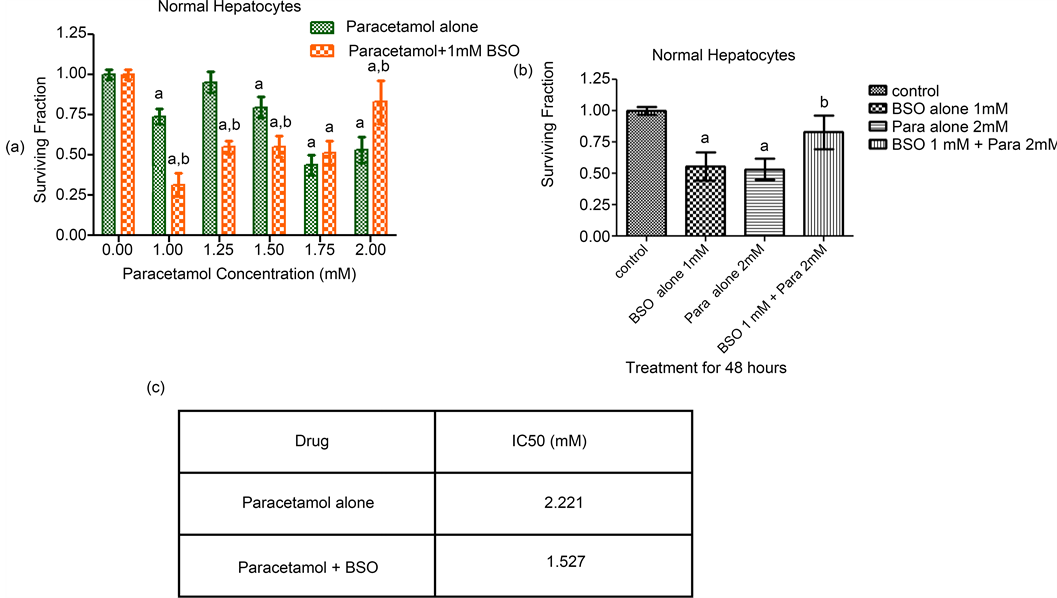
Figure 2. Sensitivity of normal hepatocyte cells to paracetamol, BSO and their combination. (a) Sensitivity of normal rat hepatocytes to Paracetamol in the presence or absence of 1 mM BSO was measured by SRB assay. After seeding, normal hepatocytes cells were treated with paracetamol alone (1 - 2 mM) or in combination with BSO (1 mM) 8 hours before each paracetamol concentration and cell survival was measured 48 h later by SRB assay. Each value represents the mean ± SEM of 3 independent experiments performed in triplicates. Statistical analysis was carried out using paired t test. asignificantly different from the respective control group at p < 0.05. bsignificantly different from the respective paracetamol only treated group at p < 0.05. (b) Sensitivity of normal rat hepatocytes to the best effective concentration of paracetamol alone (2 mM), BSO alone (1 mM) and their combination. Each of paracetamol and BSO separately has an anti-proliferative effect on normal hepatocytes but their combination has a cytoprotective effect. Each value represents the mean ± SEM of 3 independent experiments performed in triplicates. Statistical analysis was carried out using one way ANOVA followed by Tukey’s multiple comparison as post-hoc test. asignificantly different from the respective control group at p < 0.05. bsignificantly different from the respective paracetamol alone group at p < 0.05. (c) Sensitivity of normal rat hepatocytes to paracetamol alone and in combination with BSO expressed as IC50a values. aIC50, concentration of the drug that results in 50% cell growth inhibition when compared to control cell growth.

Table 1. Summary of SRB data collected for both cell lines after different treatments.
 (a)
(a) (b)
(b)
Figure 3. (a) Effect of paracetamol, BSO and their combination on cell cycle distribution of HepG2 liver cancer cells. Cells were exposed to either paracetamol alone or paracetamol + BSO pretreated 8 h before. After durations of 48, 72, and 96 h, cells were collected, treated with RNase solution, incubated with propidium iodide and the percent of cells at different phases of the cell cycle was measured by flow cytometry. Data represent means ± SEM of at least 3 independent experiments; (b) Quantitative representation of the effect of paracetamol, BSO and their combination on cell cycle distribution of HepG2 liver cancer cells. BSO modifies the cell cycle progression of paracetamol treated cells. This effect was noticed to be time-dependent.
hepatocytes with BSO surprisingly decreased that subG1 area obviously indicating a cytoprotective effect (Figure 4(a) & Figure 4(b)). All cell cycle analysis data after treatment of both HepG2 and normal hepatocytes is summarized in Table 2.
 (a)
(a) (b)
(b)
Figure 4. (a) Effect of paracetamol, BSO and their combination on cell cycle distribution of normal hepatocytes. Cells were exposed to either paracetamol alone or paracetamol + BSO pretreated 8 h before. After 48 h, cells were collected, treated with RNase solution, incubated with propidium iodide and the percent of cells at different phases of the cell cycle was measured by flow cytometry. BSO modifies the cell cycle progression of paracetamol treated hepatocytes. Data represent means ± SEM of at least 3 independent experiments; (b) Quantitative representation of the effect of paracetamol, BSO and their combination on cell cycle distribution of normal hepatocytes.
Table 2. Summary of cell cycle regulation in both cell lines after different treatments.
3.3. Effect of Paracetamol, BSO and Their Combination on the Expression of PGE2
Quantitative analysis of PGE2 level in normal hepatocytes showed significant increase in PGE2 level over the control after all treatment schedules except for the combination of paracetamol and BSO. That combination, on the contrary, showed a significant decrease compared with control, BSO- or paracetmol-treated cells (Figure 5).
On the other hand, in HepG2 cells a totally reversed effect was noticed. A significant decrease in the level of PGE2 was observed after all treatment regimens except for both drugs combination which showed a significant increase compared with those of the control, BSO- or paracetmol-treated HepG2 cells (Figure 5). Changes in the level of PGE2 after different treatments for both HepG2 and normal hepatocytes are shown in Table 3.
4. Discussion
Despite the great advance achieved in cancer therapy in the last decade, management of some types of malignant diseases such as liver cancer remains a great challenge. Side

Figure 5. Effect of paracetamol, BSO and their combination on prostaglandin E2 expression in HepG2 liver cancer cells and normal hepatocytes. Both Cell types either control or treated with paracetamol, BSO or their combination for 48 h were used to monitor PGE2 expression colorimetrically using PGE2 assay kit from R&D systems (USA). The assay was done according to the manufacturer’s instructions. Data represent means ± SEM of at least three independent experiments each performed in triplicates. Statistical analysis was carried out using two way ANOVA followed by post-hoc test. asignificantly different from the respective control group at p < 0.05. bsignificantly different from the respective BSO alone group at p < 0.05. csignificantly different from the respective paracetamol alone group at p < 0.05. dsignificantly different from the corresponding cell line with the same treatment group at p < 0.05.
Table 3. Summary of PGE2 expression in both cell lines after different treatments.
effects of cancer therapeutics limit the usefulness of many anticancer agents. Therefore, there is a great interest in developing agents with different effects on malignant and normal cells or using additional components that may preferentially sensitize cancer cells to the effect of anticancer agents. Paracetamol that is approved long time ago as analgesic antipyretic is a well established hepatotoxic at high doses. This effect is attributed to its metabolite NAPQI that accumulates after depletion of glutathione stores. The aim of the present study is to investigate the cellular effects of therapeutic- or low-dose paracetamol treatment on hepatoma cells versus normal rat hepatocytes in the presence and absence of the selective GSH-depleting agent BSO. The ultimate goal is to establish a strategy or a paracetamol-based combination therapy that may improve the outcome of liver cancer therapy with least effects on normal hepatocytes. Our results showed that both paracetamol and BSO either alone or in combination have anti-proliferative effects on both liver cancer (HepG2) and on normal rat hepatocytes. A previous study stated that HepG2 cell line constitutively expresses CYP2E1, CYP1A2 and CYP3A4, all are involved in paracetamol metabolism [18] . This finding may explain the resulted cytotoxic effect of paracetamol on HepG2 and normal hepatocytes due to the formation of the cytotoxic metabolite NAPQI. BSO as a glutathione depleting agent induces thiol-mediated oxidative stress in cancer cells [19] . It is well established that GSH plays an important role in multidrug resistance [20] . Moreover, elevation of intracellular GSH has also been associated with mitogenic stimulation [21] . Consequently, depletion of GSH has been found to either precede the onset of apoptosis or render the cells more sensitive to cell death [14] . These facts were confirmed by the current results of SRB cytotoxic assay where BSO sensitizes HepG2 to the inhibitory effect of different paracetamol concentrations especially the dose of 1.5 mM paracetamol. Further flow cytometric investigations and cell cycle analysis of HepG2 cell line revealed an obvious cell cycle G1 arrest upon adding up 1mM BSO to 1.5 mM paracetamol. The induced cell cycle blockade explains our cytotoxicity SRB assay results.
BSO either alone or in combination with low concentrations of paracetamol (1, 1.25, 1.5 mM) was also able to sensitize normal hepatocytes to paracetamol cytotoxic effects. Surprisingly, BSO showed a reversed action when combined with higher concentrations of paracetamol (1.75 and 2 mM). At 2 mM paracetamol, BSO caused a cytoprotective effect on normal hepatocytes and cells showed enhanced survival. Cell cycle analysis of normal hepatocytes revealed that either BSO or paracetamol alone caused an increased sub G1 phase compared with control cells confirming the incidence of apotosis/necrosis or both. On the contrary, their combined effect in normal hepatocytes showed a collapsed sub G1 area, similar to the one of untreated cells, denoting lesser cytotoxicity. This acquired cytoprotective property supported the results of SRB assay which confirmed the ability of BSO to reverse the cytotoxic action of higher doses of paracetamol in normal hepatocytes. This phenomenon might be explained by the report of Syng-ai et al. [22] who noticed that every cell line showed a different response to incubation with BSO. The current conflicting responses of both cell lines upon treatment with BSO and paracetamol combination might be attributed to their different cellular GSH content. This depends on the variability in GSH depleting ability of BSO between tumor and normal tissues [23] .
Incubation time is recognized as a reliable factor that may affect the cytotoxic effects of paracetamol, BSO, and their combination. In the present study, the best cytotoxic effects were achieved after exposure of cells to drug combinations for of 72 and 96 hours. This may be due to the direct activation by paracetamol/BSO of endonucleases leading to induction of cell death. This finding comes in line with Manov et al. [2] who observed that paracetamol induced a significant increase in the frequency of hypodiploid nuclei in HepG2 cells in a time and concentration-dependent manner. This may be attributed to the ability of paracetamol to decrease cellular redox potential and GSH content.
Paracetamol is an inhibitor of cyclooxygenase enzymes that may affect the level of prostaglandin synthesis. Therefore, the role of prostglandins (PGs) in the cytotoxicity of BSO and paracetamol was investigated. PGs, especially PGE2, have been implicated as modulators of tumor metastasis [24] [25] , immuno-suppression [26] [27] , tumor promotion [28] , and cell proliferation [29] . In vitro, detectable quantities of PGs specifically prostaglandins E2 and F2 were isolated from the culture medium of various cell lines [30] . It is well established that paracetamol in vivo reduces the level of PGE2 after systemic administration in humans [31] [32] [33] . However, in vitro it has been shown to either inhibit or stimulate prostaglandins synthesis, depending on the tissue, preparation of the tissue, and constituents of the incubation milieu [34] [35] [36] . Quantitative analysis of PGE2 in the present investigation revealed that paracetamol had a contradictory effect on malignant versus normal liver cells. In tumor cells, the high level of PGE2 in control group was decreased downhill by the addition of BSO, paracetamol and their combination. While on the other hand, a totally reversed effect was shown in normal murine hepatocytes. A possible explanation for that controversy may be the diverse levels of cellular peroxides present in different types of cells [37] [38] . Paracetamol only inhibits the production of PGs from arachidonic acid under specific conditions, namely when the peroxide tone of isolated cells is low [39] .
As a fact, inhibition of COX enzyme by paracetamol and non steroidal anti inflammatory drugs (NSAIDs) is the main reason for the inhibition of PGs synthesis. Unlike aspirin, inhibition of cyclooxygenase (COX) activity by paracetamol is biphasic and requires glutathione and hydroquinone as cofactors [40] . This fact may explain why PGE2 level was increased when normal hepatocytes with low GSH level were treated with both BSO and paracetamol. As a result, the titer of PGE2 increased in normal hepatocytes when treated with paracetamol alone followed by a further increase when BSO was added to paracetamol (Figure 5). This action was totally reversed in case of HepG2 cells due to their higher levels of GSH that facilitate COX inhibition and therefore PGE2 synthesis was decreased.
5. Conclusion
In conclusion, paracetamol alone is more cytotoxic to the liver cancer HepG2 cells than the normal hepatocytes. Addition of BSO to paracetamol showed differential effects on cancer and normal liver cells. Enhancement of paracetamol cytotoxicity on liver cancer cells was observed at low and high paracetamol concentrations while its effect on paracetamol toxicity on normal hepatocytes was dependent on paracetamol concentration with increased cytotoxicity at low but increased protection at high paracetamol concentration. This finding if confirmed on other liver cancer and normal cells may open the avenue for a novel combination with more toxicity to liver cancer cells and protection of normal liver cells.
Compliance with Ethical Standards
Conflict of Interest: All authors declare that have no conflict of interest.
Ethical approval: This article does not contain any studies with human participants or animals performed by any of the authors.
Cite this paper
Sayour, M.E., El Salam, R.M.A., Elyamany, M.F., El Sayed, A.M. and El-Awady, R.A. (2016) Combination of Paracetamol and the Glutathione De- pleting Agent Buthionine Sulfoximine Show Differential Effect on Liver Cancer Cells and Normal Hepatocytes. Pharmacology & Phar- macy, 7, 443-458. http://dx.doi.org/10.4236/pp.2016.711051
References
- 1. Fong, Y., Dupuy, D.E., Feng, M. and Abou-Alfa, G. (2015) Cancer of the Liver. In: De Vita, V.T., Hellman, S., Rosenberg, S.A., Eds., Cancer: Principles and Practice of Oncology, 10th Edition, Lippincott Williams & Wilkins, Philadelphia, 123.
- 2. Manov, I., Hirsh, M. and Iancu, T.C. (2004) N-Acetylcysteine Does Not Protect HepG2 Cells against Acetaminophen-Induced Apoptosis. Basic & Clinical Pharmacology & Toxicology, 94, 213-225.
http://dx.doi.org/10.1111/j.1742-7843.2004.pto940504.x - 3. Dai, Y. and Cederbaum, A.I. (1995) Cytotoxicity of Acetaminophen in Human Cytochrome P4502E1-Transfected HepG2 Cells. Journal of Pharmacology and Experimental Therapeutics, 273, 1497-1505.
- 4. Nelson, S.D. (1995) Mechanisms of the Formation and Disposition of Reactive Metabolites That Can Cause Acute Liver Injure. Drug Metabolism Reviews, 27, 147-177.
http://dx.doi.org/10.3109/03602539509029821 - 5. Tonge, R.P., Kelly, E.J., Bruschi, S.A., Kalhorn, T., Eaton, D.L., Nebert, D. and Nelson, S.D. (1998) Role of CYP1A2 in the Hepatotoxicity of Acetaminophen: Investigation Using Cyp1a2 Null Mice. Toxicology and Applied Pharmacology, 153, 102-108.
http://dx.doi.org/10.1006/taap.1998.8543 - 6. Manyike, P.T., Kharasch, E.D., Kalhorn, T.F. and Slattery, J.T. (2000) Contribution of CYP2E1 and CYP3A to Acetaminophen Reactive Metabolite Formation. Clinical Pharmacology & Therapeutics, 67, 275-282.
http://dx.doi.org/10.1067/mcp.2000.104736 - 7. Liang, Y.L., Zhang, Z.H., Liu, X.J., Liu, X.Q., Tao, L., Zhang, Y.F., et al. (2012) Melatonin Protects against Apoptosis-Inducing Factor (AIF) Dependent Cell Death during Acetaminophen-Induced Acute Liver Failure. PLoS ONE, 7, e51911.
http://dx.doi.org/10.1371/journal.pone.0051911 - 8. Zhao, X., Cong, X., Zheng, L., Xu, L., Yin, L. and Peng, J. (2012) Dioscin, a Natural Steroid Saponin, Shows Remarkable Protective Effect against Acetaminophen-Induced Liver Damage in Vitro and in Vivo. Toxicology Letters, 214, 69-80.
http://dx.doi.org/10.1016/j.toxlet.2012.08.005 - 9. Biaglow, J.E., Clark, E.P., Epp, E.R., Morse-Guardio, M., Varnes, M.E. and Mitchell, J.B. (1983) Non-Protein Thiols and the Radiation Response of A549 Human Lung Carcinoma Cells. International Journal of Radiation Biology, 44, 489-495.
- 10. Mitchell, J.B., Morstyn, G., Russo, A. and Carney, D.N. (1985) In Vitro Radiobiology of Human Lung Cancer. Cancer Treatment Symposia, 2, 3-10.
- 11. Rogers, L.K., Moorthy, B. and Smith, C.V. (1997) Acetaminophen Binds to Mouse Hepatic and Renal DNA at Human Therapeutic Doses. Chemical Research in Toxicology, 10, 470-476.
http://dx.doi.org/10.1021/tx960159i - 12. Kaplowitz, N. (2004) Acetaminophen Hepatoxicity: What Do We Know, What Don’t We Know, and What Do We Do Next? Hepatology, 40, 23-26.
http://dx.doi.org/10.1002/hep.20312 - 13. Rouzer, C.A., Scott, W.A., Griffith, W., Hamill, A.L. and Cohn, Z.A. (1982) Arachidonic Acid Metabolism in Glutathione-Deficient Macrophages. Proceedings of the National Academy of Sciences of the United States of America, 79, 1621-1625.
http://dx.doi.org/10.1073/pnas.79.5.1621 - 14. Anderson, C.P., Tsai, J.M., Meek, W.E., Liu, R.M., Tang, Y., Forman, H.J. and Reynolds, C.P. (1999) Depletion of Glutathione by Buthionine Sulfoxine Is Cytotoxic for Human Neuroblastoma Cell Lines via Apoptosis. Experimental Cell Research, 246, 183-192.
http://dx.doi.org/10.1006/excr.1998.4303 - 15. Seglen, P.O. (1976) Preparation of Isolated Rat Liver Cells: The Enzymatic Preparation of Isolated Intact Parenchymal Cells from Rat Liver. Methods in Cell Biology, 13, 29-83.
http://dx.doi.org/10.1016/S0091-679X(08)61797-5 - 16. El-Awady, R.A., Semreen, M.H., Saber-Ayad, M.M., Cyprian, F., Menon, V. and Al-Tel, T.H. (2016) Modulation of DNA Damage Response and Induction of Apoptosis Mediates Synergism between Doxorubicin and a New Imidazopyridine Derivative in Breast and Lung Cancer Cells. DNA Repair, 37, 1-11.
http://dx.doi.org/10.1016/j.dnarep.2015.10.004 - 17. El-Awady, R.A., Saleh, E.M., Ezz, M. and Elsayed, A.M. (2011) Interaction of Celecoxib with Different Anti-Cancer Drugs Is Antagonistic in Breast but Not in Other Cancer Cells. Toxicology and Applied Pharmacology, 255, 271-286.
http://dx.doi.org/10.1016/j.taap.2011.06.019 - 18. Sumida, A., Fukuen, S., Yamamoto, I., Matsuda, H., Naohara, M. and Azuma, J. (2000) Quantitative Analysis of Constitutive and Inducible SYPs mRNA Expression in the HepG2 Cell Line Using Reverse Transcription-Competitive PCR. Biochemical and Biophysical Research Communications, 267, 756-760.
http://dx.doi.org/10.1006/bbrc.1999.2029 - 19. Fath, M.A., Ahmad, I.M., Smith, C.J., Spence, J. and Spitz, D.R. (2011) Enhancement of Carboplatin-Mediated Lung Cancer Cell Killing by Simultaneous Disruption of Glutathione and Thioredoxin Metabolism. Clinical Cancer Research, 17, 6206-6017.
http://dx.doi.org/10.1158/1078-0432.CCR-11-0736 - 20. Schnelldorfer, T., Gansauge, S., Gansauge, F., Schlosser, S., Beger, H.G. and Nussler, A.K. (2000) Glutathione Depletion Causes Cell Growth Inhibition and Enhanced Apoptosis in Pancreatic Cancer Cells. Cancer, 89, 1440-1447.
http://dx.doi.org/10.1002/1097-0142(20001001)89:7<1440::AID-CNCR5>3.0.CO;2-0 - 21. Shaw, J.P. and Chou, L.N. (1986) Elevation of Intracellular Glutathione Content Associated with Mitogenic Stimulation of Quiescent Fibroblasts. Journal of Cellular Physiology, 129, 193-198.
http://dx.doi.org/10.1002/jcp.1041290210 - 22. Syng-Ai, C., Kumari, A.L. and Khar, A. (2004) Effect of Curcumin on Normal and Tumor Cells: Role of Glutathione and Bcl-2. Molecular Cancer Therapeutics, 3, 1101-1108.
- 23. Lee, F.Y.F., Allalunis-Turner, M.J. and Siemann, D.W. (1987) Depletion of Tumor versus Normal Tissue Glutathione by Buthionine Sulfoximine. British Journal of Cancer, 56, 33-38.
http://dx.doi.org/10.1038/bjc.1987.148 - 24. Honn, K.V., Bockman, R.S. and Marnett, L.J. (1981) Prostaglandins and Cancer: A Review of Tumor Initiation through Tumor Metastasis. Prostaglandins, 21, 833-850.
http://dx.doi.org/10.1016/0090-6980(81)90240-9 - 25. Honn, K.V. and Sloane, B.F. (1985) Prostaglandins in Tumor Cell Metastasis. In: Torisv, M. and Yoshida, T., Eds., Basic Mechanisms and Clinical Treatment of Tumor Metastasis, Academic Press, New York, 311-334.
http://dx.doi.org/10.1016/B978-0-12-695680-1.50024-7 - 26. Meerpohl, H.G., Bauknecht, T., Tritschler, V. and Lang, H. (1981) The Influence of Prostaglandin E2 on Macrophage Mediated Cytotoxicity. In: Forster, W., Ed., International Workshop: Heterogeneity of Mononuclear Phagocytes, Academic Press, New York, 428-461.
- 27. Phipps, R.P., Stein, S.H. and Roper, R.L. (1991) A New View of Prostaglandin E Regulation of the Immune Response. Immunology Today, 12, 349-352.
http://dx.doi.org/10.1016/0167-5699(91)90064-Z - 28. Furstenberger, G., Gross, M. and Marks, F. (1984) Involvement of Prostaglandins in the Process of Skin Tumor Promotion. In: Thaler-Dao, H., Crastes de Paulet, A. and Paoletti, R., Eds., Icosanoids and Cancer, Raven Press, New York, 91-100.
- 29. Furstenberger, G., Gross, M. and Marks, F. (1984) On the Role of Prostaglandins in the Induction of Epidermal Proliferation, Hyperplasia and Tumor Promotion in Mouse Skin. In: Powles, T.J., Bockman, R.S., Honn, K.V. and Ramwell, P.W., Eds., Prostaglandins and Related Lipids, Vol. 2, Alan R Liss, New York, 239-251.
- 30. Hubbord, W.C., Alley, M.C., McLemore, T.L. and Boyd, M.R. (1988) Profiles of Prostaglandin Biosynthesis in Sixteen Established Cell Lines Derived from Human Lung, Colon, Prostate, and Ovarian Tumors. Cancer Research, 48, 4770-4775.
- 31. Green, K., Drvota, V. and Vesterqvist, O. (1989) Pronounced Reduction of in Vivo Prostacyclin Synthesis in Humans by Acetaminophen (Paracetamol). Prostaglandins, 37, 311-315.
http://dx.doi.org/10.1016/0090-6980(89)90001-4 - 32. Lee, Y.S., Kim, H., Brahim, J.S., Rowan, J., Lee, G. and Donne, R.A. (2007) Acetaminophen Selectively Suppresses Peripheral Prostaglandin E2 Release and Increases COX2 Gene Expression in a Clinical Model of Acute Inflammation. Pain, 129, 279-286.
http://dx.doi.org/10.1016/j.pain.2006.10.020 - 33. Crawley, B., Saito, O., Malkmus, S., Fitzsimmons, B., Hua, X.Y. and Yaksh, T.L. (2008) Acetaminophen Prevents Hyperalgesia in Central Pain Cascade. Neuroscience Letters, 442, 50-53.
http://dx.doi.org/10.1016/j.neulet.2008.06.062 - 34. Kehoe, M.J., Cohen, S.M., Zarrinnia, K. and Cowan, A. (1996) The Effect of Acetaminophen, Ibuprofen and Misoprostol on Prostaglandin E2 Synthesis and the Degree and Rate of Orthodontic Tooth Movement. Angle Orthodontist, 66, 339-350.
- 35. Botting, R.M. (2000) Mechanism of Action of Acetaminophen: Is There a Cyclooxygenase 3? Clinical Infectious Diseases, 31, S202-S210.
http://dx.doi.org/10.1086/317520 - 36. Kis, B., Snipes, J.A., Simandle, S.A. and Busija, D.W. (2005) Acetaminophen-Sensitive Prostaglandin Production in Rat Cerebral Endothelial Cells. American Journal of Physiology-Regulatory Integrative and Comparative Physiology, 288, R897-R902.
http://dx.doi.org/10.1152/ajpregu.00613.2004 - 37. Hanel, A.M. and Lands, W.E.M. (1982) Modification of Anti-Inflammatory Drug Effectiveness by Ambient Lipid Peroxides. Biochemical Pharmacology, 31, 3307-3311.
http://dx.doi.org/10.1016/0006-2952(82)90565-2 - 38. Hertz, F. and Cloarec, A. (1984) Pharmacology of Free Radicals, Recent Views on Their Relation to Inflammatory Mechanisms. Life Sciences, 34, 713-720.
http://dx.doi.org/10.1016/0024-3205(84)90378-3 - 39. Graham, G.G., Davies, M.J., Day, R.O., Mohamudally, A. and Scott, K.F. (2013) The Modern Pharmacology of Paracetamol: Therapeutic Actions, Mechanism of Action, Metabolism, Toxicity and Recent Pharmacological Findings. Inflammopharmacology, 21, 201-232.
http://dx.doi.org/10.1007/s10787-013-0172-x - 40. Simmons, D.L., Wagner, D. and Westover, K. (2000) Nonsteroidal Anti-Inflammatory Drugs, Acetaminophen, Cyclooxygenase 2, and Fever. Clinical Infectious Diseases, 31, S211-S218.
http://dx.doi.org/10.1086/317517