Open Journal of Air Pollution
Vol.1 No.3(2012), Article ID:25513,8 pages DOI:10.4236/ojap.2012.13008
Impacts of Atmospheric Conditions on Influenza in Southern China. Part I. Taking Shenzhen City for Example
1School of Environmental Studies, China University of Geosciences, Wuhan, China
2Department of Geography and Geoinformation Science, George Mason University, Fairfax, USA
3Yunnan Meteorology Bureau, Kunming, China
4Hubei Meteorology Bureau, Wuhan, China
5Shenzhen Meteorology Bureau, Shenzhen, China
6Shenzhen Center for Disease Control and Prevention, Shenzhen, China
Email: *qinjunnj@126.com, fanghongwh@126.com, chenzh64@126.com, nannan-8025@163.com, lilywjj@sohu.com, szcdc-hxd@163.com
Received August 24, 2012; revised September 27, 2012; accepted October 13, 2012
Keywords: Vapor Pressure; Air Pollutants; Acid Rain; Influenza; The Rate of ILI
ABSTRACT
In this study, we analyse the relationship between the occurrences of influenza in Shenzhen, a rapid developing city in subtropic regions of southern China with over 10 million populations, and the vapor pressure (VP), the concentrations of atmospheric pollutants (SO2, NO2, PM10) for the period of 2003-2008. Using the data such as the rate of Influenza-Like-Illness (ILI (%)), the concentrations of pollutants and vapor pressure, we show quite different results from previous research conducted in other regions in China which are dominated by temperate climate and with influenza outbreak in Winter and Autumn. Our results show that the rate of ILI in Shenzhen reaches its maximum in Summer and minimum in Winter and the concentrations of pollutants were significantly correlated with ILI (%), there are significant positive correlations between ILI (%) and VP which can explain over 25% the variance of ILI (%) variations. Quite surprisingly, both atmospheric SO2 and PM10 concentrations are negatively correlated with ILI (%), this is because acid deposition may limit the spread of disease, the seasonal variations of acid rain in Shenzhen could contribute to the seasonality of its influenza. Furthermore, there are some significant correlations between preceding VP and SO2 and PM10 concentrations to ILI occurrence and such connections can be used for ILI predictions.
1. Introduction
The threats of atmospheric pollutants to human health have been intensively studied in the past decades. The Particulate Matters (PM10), Sulfur dioxide (SO2) and Nitrogen dioxide (NOx) have the highest exposure risk to human respiration system and immunization system. A number of studies examined the relationships between atmospheric pollutants and respiration system diseases in several cities in China [1-4]. Reference [1] pointed out that airborne pollutants such as PM, SO2, NOx accompanied by harsh meteorological conditions could have harmful risk on human health. Reference [5] showed that the rate of diagnosis for pedology and upper respiration system increased when the concentrations of airborne SO2, NOx, CO, PM10 increased. Furthermore, Reference [6] analyzed the influence of airborne pollutants, especially the PM, on influenza and found that dry air conditions may favor for reproducing and diffusing flu virus because precipitation could reduce the concentrations of atmospheric pollutants by 60% through dissolutions and chemical reactions. Similar results were also reported in other countries. For instance, Reference [7] showed that the rate of respiration system sickness in Australia increased 8% for per unit increase of the SO2 concentration in ambient atmosphere.
Studies have also been conducted to explore the mechanism of such relationships between air pollution and respiration diseases. For example, Reference [8,9] found that atmospheric pollutants influenced the human immunity system by changing the level of immunodeficiency, therefore increasing RTI (respiratory tract infection) and allergy diseases. Despite of the fact that the epidemiological studies overall supported the conclusion that pollutants in ambient atmosphere have a negative effect on the human health [10-12], a number of recent studies reported that atmospheric pollutants could reduce certain diseases. For example, Reference [13] emphasized that the spread of SARS (Severe Acute Respiratory Syndromes) showed a negative relationship with the acid rain due to the fact that the acid in precipitation had an effect on diluting and killing virus in the ambient atmosphere. Reference [14] also found that the concentration of PM2.5 led to a reduction of respiration system diseases, pneumonia in adults, and coronary heart diseases in Helsinki. Reference [15] stated that the increasing of ILI in Hong Kong for the period from 1996 to 2002 was closely related to the reduction in concentrations of PM10.
Different climate background and air conditions could have contributed to such inconsistency aforementioned. The dry environment favors the propagation of flu virus in North China and temperate regions [6,16]. Nevertheless, as pointed out by Reference [16], atmospheric humidity could reduce the Influenza Virus Transmission (IVT) and Influenza Virus Survival (IVS) rates in temperate regions, Less is known about the situation in subtropic regions in China which is influenced by a different climate regime. This is the focus of our study. When assessing the impacts of atmospheric pollutants on human health, much more attentions was paid to their influence on human body, while their impacts on flu virus itself are often neglected, therefore we need to make further investigations in different regions to explore the impacts of environmental factors on flu-like diseases.
The industrial emissions and vehicle emissions are the main source of air pollution in China. In recent years, with the rapid development of urbanization in Shenzhen city, the urban air pollution becomes more and more serious, and the number of days that dust haze occurs has increased, causing the entire region heavy haze weather. The ash haze weather appears when the air pollution degree intensifies, specially the PM10 density presents the date in the ash haze to elevate obviously. Previous studies also indicated that the dry environment favors the propagation of flu virus in temperate regions in China, but how about the situation in subtropic regions? So we choose concentrations of atmospheric pollutants (SO2, NO2, PM10) and Vapor Pressure (VP) as the study object in this paper.
Accordingly, the paper is organized as follows. In Section 2, we present the data source and analytical method in our study, Then in Section 3 we concentrate on discussing the relationships between ILI, vapor pressure (VP) and concentrations of atmospheric pollutants (SO2, NO2, PM10) collected in Shenzhen (22˚N, 113˚E), a rapid developing city in subtropical region of southern China. Conclusions and discussions from our analysis will be presented in Section 4.
2. Data Sources and Methods
In this study, we use the definition of Influenza-Like Illness (ILI) from the World Health Organization (WHO) which is also used by China National Flu Center. ILI is defined as the acute respiration system disease with animal heat equal or above 38˚C and accompanied with cough and ache in pharynx or ache from head to foot. ILI rate (%) is then defined as the proportion of outpatient visits diagnosed as Influenza-Like Illness [17]. The ILI (%) data used in this study are provided by the Shenzhen Center for Disease Control and Prevention (CDC). The data are collected from its two monitoring sites which are also part of the national monitoring sites: the Shenzhen People’s Hospital and Shenzhen Center for Maternal and Child Health Care. The CDC started the flu monitoring since 1984 and has strict quality-control process and experience to ensure the quality and reliability of its ILI data. In our analysis, all the atmospheric environmental data are provided by the Shenzhen Meteorology Bureau which records and maintain high-quality meteorological observations.
Both weekly averaged data and daily data are used to analyze the relationship between ILI (%) and atmospheric environmental conditions. The weekly-averaged ILI (%) is the rate of weekly total patients diagnosed as influenza divided by the total patients visiting the above two hospitals during the 261 weeks from 2003 to 2007. Furthermore, daily ILI (%), daily vapor pressure and concentrations of SO2, NO2, PM10 for the period of 11th February to 20th April 2008 are used for some case studies. In addition, rainfall PH data from 3th July 2006 to 9th March 2009 are also used. In the analysis, the four seasons in Shenzhen are defined as Winter (December to following February), Spring (March to April), Summer (May to September) and Autumn (October to November).
When analysing the relationships between ILI (%) and environmental factors, we need to know the percentage of the variance of ILI (%) which can be explained by the variations of environmental factors. In this study, the variance contribution of environmental factors (VP, SO2, NO2, PM10) to ILI (%) equals to the square of correlation coefficient between ILI (%) and environmental factors.
3. Results and Discussions
3.1. The Correlation between the ILI (%) and Ambient Conditions
To reveal the overall relationship between ILI (%) and environment elements, we first calculate the correlations between weekly averaged ILI (%) and VP, the concentrations of SO2, NO2 and PM10 (Table 1). Weekly averaged ILI (%) shows a significant correlation with VP, concentrations of SO2 and PM10, but not with NO2. It has a positive relationship with VP, but negative relationships with concentrations of SO2 and PM10. Furthermore, significant correlations still retain even when the time series of VP,
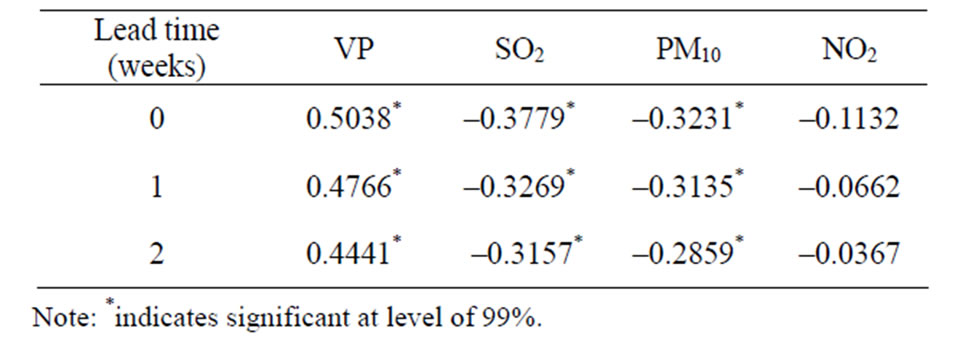
Table 1. The time-lag correlation coefficients between ILI (%) and environmental elements (2003-2007).
SO2 and PM10 leading ILI (%) by 1 - 2 weeks. These lag correlations suggest potential predictions of ILI rate based on preceedng VP, SO2 and PM10 observations.
Vapor pressure measures the vapor density in the atmosphere and Table 1 shows that, ILI (%) increased with the increase of VP. Such a result is different from previous studies of Reference [6,16] in which they found dry environment is in favor of the propagation of flu virus. Reference [16] showed that the atmospheric humidity had a negative correlation with Influenza Virus Transmission (IVT) and Influenza Virus Survival (IVS) rates in temperate regions and the seasonality of its flu occurrence follows the local weather conditions. Nevertheless, Shenzhen City is dominated by subtropical maritime monsoon climate. Its weather conditions are quite different from that in the temperate zone.
The ILI (%) shows a negative correlation with SO2 concentration. This is also different from the findings of Reference [5,7]. This phenomenon could be explained by the fact that flu virus may be hard to survive in acid environment. Indeed, Reference [18] compared the growth rates of virus in mice body under normal condition and under enhanced SO2 concentration and found that beyond a certain threshold the SO2 could reduce the transmission of influenza virus.
As shown in Table 1, the ILI (%) also shows a significant negative relationship with the concentration of PM10. This is different from that of the results in temperate regions where ILI (%) is positively correlated to the PM10 concentration [19,20], the underlying mechanism is such that the increases in PM10 reduce ultraviolet radiation reaching the ground which helps to the development of flu virus, therefore, more PM10 leads to the acceleration of development and transmission of influenza virus. However, our knowledge of how ultraviolet radiation influences human’s immunity system is less certain. Studies have shown that ultraviolet radiation can also harm the respiration system [21]. Furthermore, Reference [14,22] found that the PM10 had both positive and negative effects on human health and its effects were closely related to pollution sources in the region. Shenzhen city is a coastal city and sea salt aerosol above Shenzhen can turn acid pollutants into neutral salt through chemical interacttion [23]. This may reduce the possibility of PM10 endangering respiration system. Therefore the negative relationship between PM10 and ILI (%) in Shenzhen is probably due to the combined effects of ultraviolet radiation and sea salt aerosol. Furthermore, the changes between Winter and Summer monsoon circulations will cause changes in VP, concentrations of atmospheric pollutants and sea salt aerosol, the joint effects of VP, the concentration of atmospheric pollutants and the sea salt aerosol on the seasonal changes of ILI (%) are complicated and remain unknown.
According to section 2 and Table 1, the variations of VP, SO2 and PM10 account for 25.4%, 14.3% and 10.4% variance of ILI (%) respectively and explained 50.1% variation in total. Furthermore, as shown in Table 1, the 1 - 2 weeks time-lag significant correlations between ILI (%) and VP, SO2 and PM10 could be used for forecasting ILI (%).
3.2. The Seasonal Variations of ILI (%) Associated with VP and Atmospheric Pollutants
Figure 1 displays weekly averaged ILI (%), VP, concentrations of SO2 and PM10 for the period of 2003-2007. Meanwhile, Figure 2 illustrates the monthly mean environment factors for many years. Clearly, the peak of ILI (%) occurs in Summer rather than in Autumn and Winter when high ILI rate is observed in temperate regions in China. The seasonal variations of ILI (%) are consistent with VP variations associated with subtropical monsoon climate influencing the city.
As shown in Figure 1, on the average, the ILI (%) in Shenzhen city increases from Winter to Summer, with its highest ILI (%) as 8.9% in June while the lowest of 4.2% in December. This seasonal change corresponds to the the highest VP of 30.3 hPa in August and the lowest VP of 11.9 hPa in January. The time lag between high VP and high ILI (%) indicates there are other environmental factors contributing to the variations of ILI (%). The SO2 and PM10 concentrations show contrary seasonal variations of ILI (%), with higher concentrations of SO2 and PM10 in Winter and their maximum and minimum occurring around January and July, respectively.
3.3. The Relationships between ILI (%) and PH of the Rainfall
The Pearl River Delta is one of the regions with serious acid rain in China. Shenzhen is located southeast of the region. With the rapid economic development, a large amount of acidic contaminants from local and external sources have been released into the atmosphere. It results in acid rain as a common phenomena in this city [24,25].
Previous studies have shown in the impact of acid rainfall on virus generation and propagation. As an exam-

Figure 1. Time series of weekly averaged SO2, PM10, VP and ILI (%) (The unit for SO2 and PM10 are mg/m3; The VP was multiplied by 2/5 and the unit is hPa, 2003-2007).
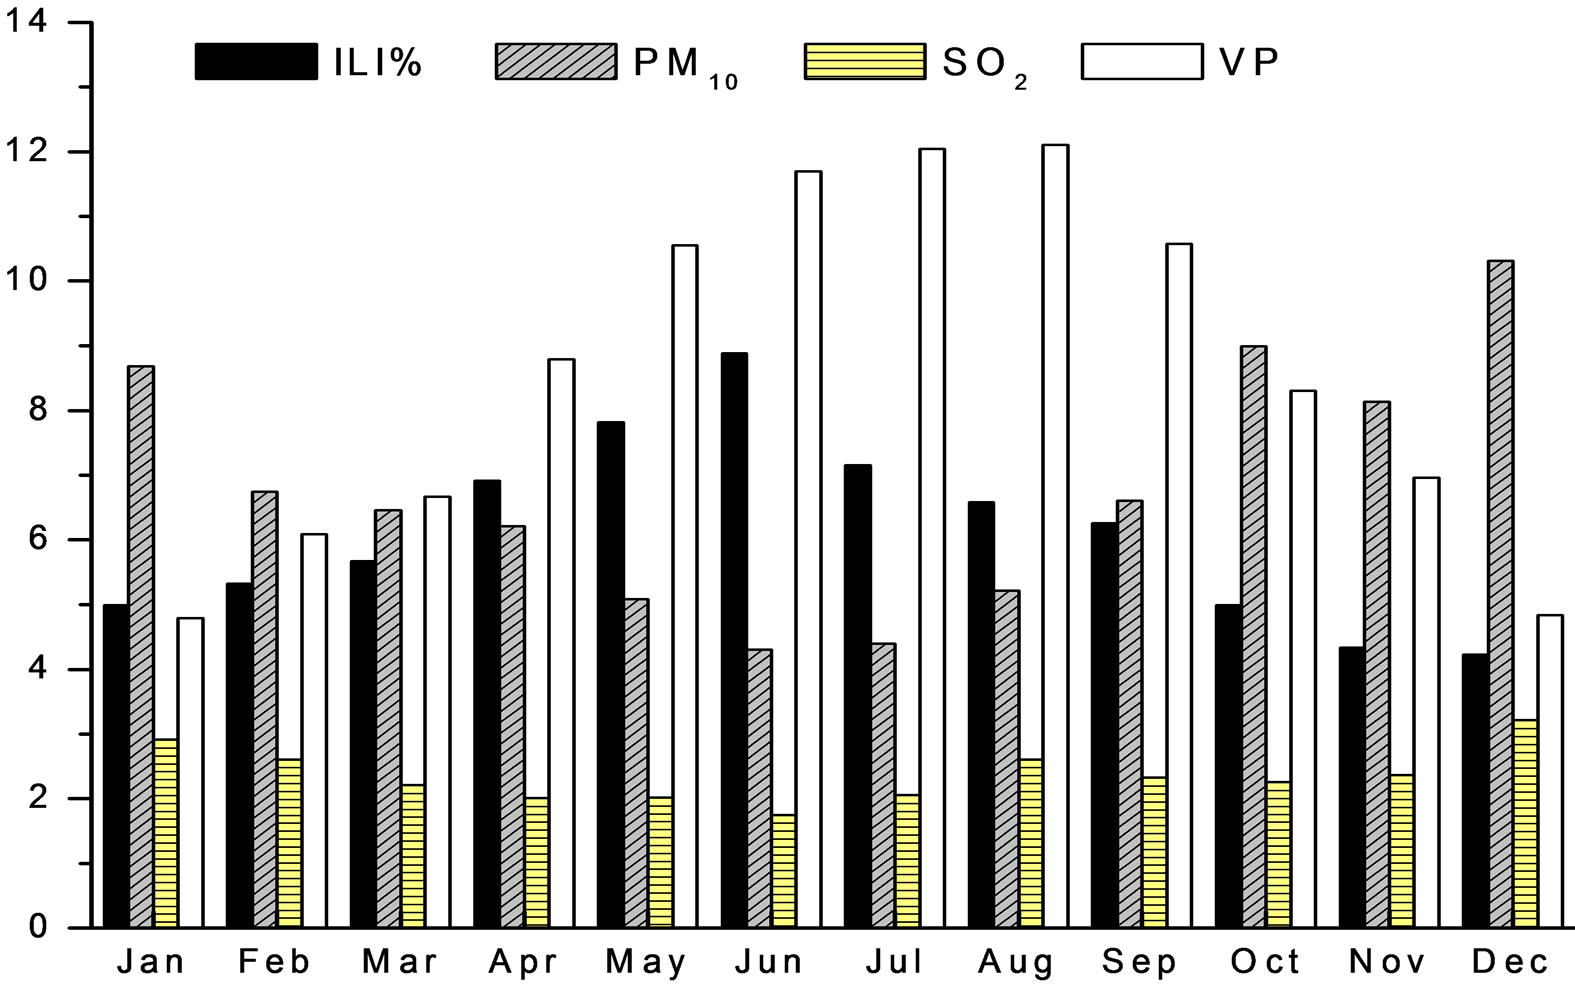
Figure 2. Monthly mean ILI (%), VP and concentrations of SO2, PM10 for many years from 2003-2007. The VP is multiplied by 0.4 and the concentrations of SO2, PM10 are multiplied by 100. The units are the same as in Figure 1.
ple, Reference [13] showed that the acid in precipitation had an effect on diluting and killing SARS virus in the ambient atmosphere. Thus, in this study, we also examine the connections between ILI rates and acid rainfall.
The monthly time series of ILI (%) and PH of the rain from Jul. 2006 to Jul. 2007 is shown by Figure 3. Clearly, the variation of ILI (%) follows closely with the PH of the rain. There is a statistically significant positive correlation between the two, with the correlation coefficient up to 0.72. This result is in agreement with the study of Reference [13] on the relationships between SARS outbreaks and acid rain. Our results also support their interpretation that high acid rain is in favour of killing the airborne viruses and leading to the suppression of virus spreading in the air.
Using daily observations of acid rain and ILI (%) for the period of 3th July 2006 to 9th Mar 2009 in Shenzhen, the seasonal averages of PH of the rain and ILI (%) are shown in Figure 4. Its rainfall PH values exhibit notable seasonal characteristics, with the averaged values in Winter, Spring, Summer and Autumn are 4.87, 5.09, 5.46 and 5.30 respectively. In Winter, quasi-stationary frontal synoptic systems dominate the weather in Shenzhen and air pollutants often accumulate under this stable condition, leading to more severe acid rain in Winter. In contrast, convective weather systems in its Summer such as thunderstorm and typhoon results in strong air convections which are favorable for pollutants dispersion and dilution. As a result, pollutant concentration declines in Summer. Therefore, the changes in SO2 and PM10 concentrations in Shenzhen are consistent with the local atmospheric conditions.
3.4. A Case Study
Besides the analysis of weekly, monthly and seasonal averages in the above sections, here we also conduct a detailed case study, using the daily data collected from Feb. 11 to Apr. 20, 2008. During this period, the H3N2 flu widely spread out in the adjacent Hong Kong City, causing the death of four young children. The Shenzhen city has similar climate conditions to Hong Kong and was also suffered pandemic flu during the same period.
Figure 5 shows daily ILI (%) from 11 February to 20 April, 2008 in Shenzhen. From the beginning of February to the middle of March, the ILI (%) fluctuated between 1% and 5%, and it began to show an significant increasing trend from the middle of March and the highest ILI (%) occurred at the middle of April. The peak ILI (%) occurred on 21 March, 6 April and 12 April, and
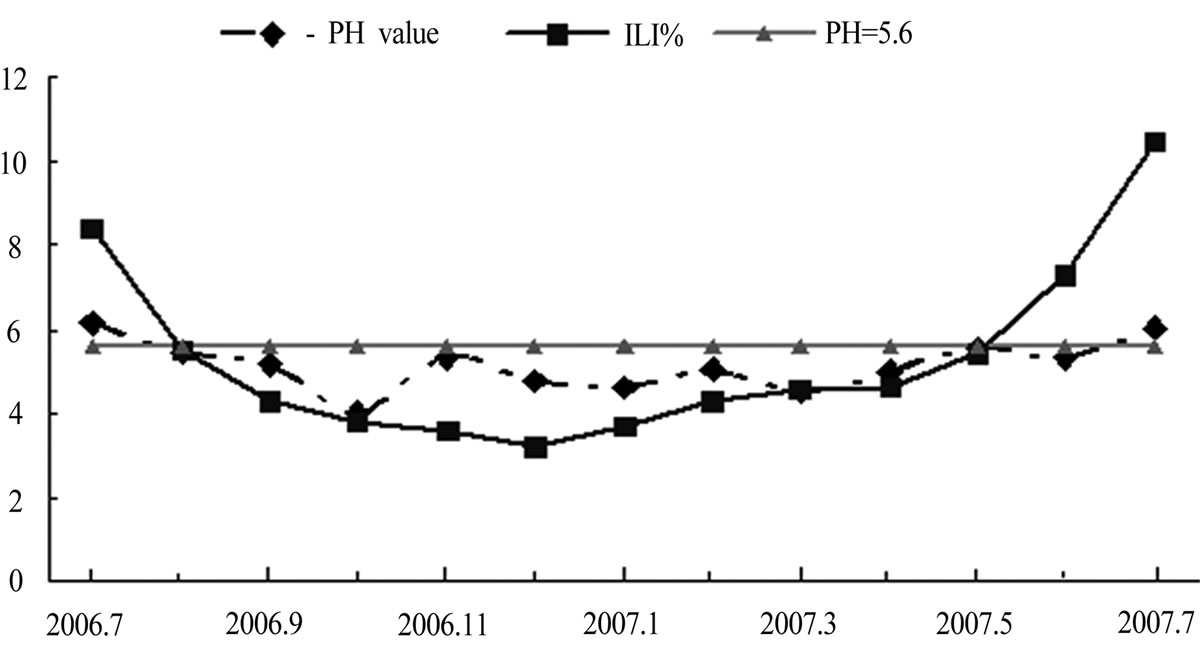
Figure 3. Time series of monthly averaged ILI (%) and PH of the rain in Shenzhen from July 2006 to July 2007.

Figure 4. Column diagram for ILI (%) and PH of the rain in different seasons (Daily data from 3rd July 2006 to 9th March 2009 in Shenzhen City).
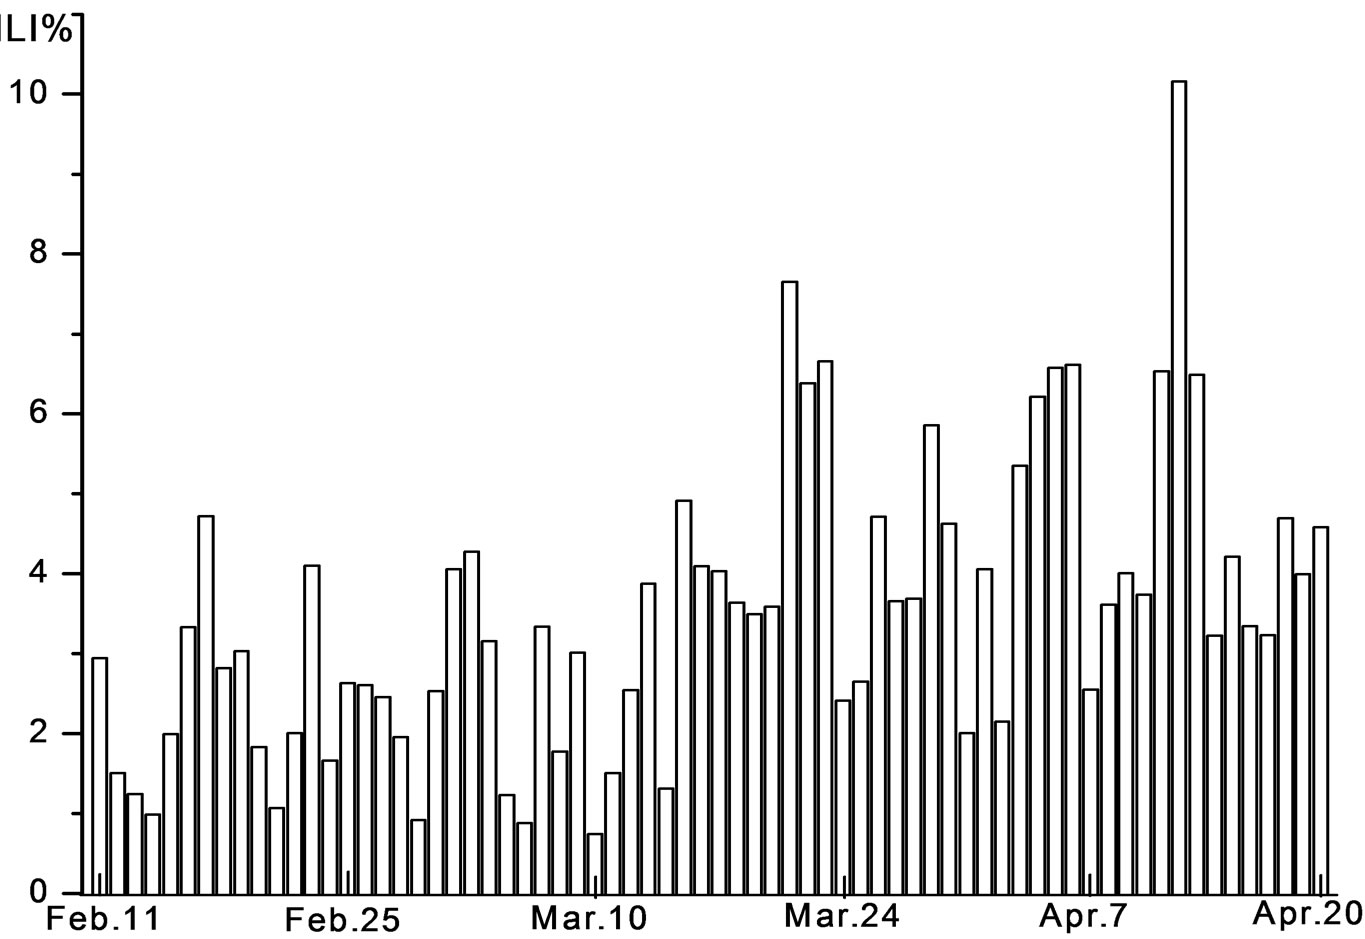
Figure 5. Time series of the daily ILI (%) in Shenzhen from 11 February to 20 April, 2008.
the highest ILI (%) values were 10.2% on 12 April.
Table 2 shows the correlation coefficients between daily ILI (%), VP, concentrations of SO2, PM10 and NO2. To explore the connections between ILI and preceding environmental conditions, results including 0 - 7 day leading time are presented here. The ILI (%) shows a significant positive correlation with VP, but a negative correlation with the concentrations of air pollutants. By and large, the correlation coefficients between ILI (%) and these air pollution variables are higher at 5 - 7 day leading time. Such correlations start to decline when the leading time is beyond 7 days (not shown).
From our analysis, we find the reliable relationship between environmental variables one-week leading time and ILI (%), this results can be potentially used to predict the variations of ILI (%).
4. Conclusions
In this study we have analyzed the varying pattern of ILI and its relationships with ambient atmospheric conditions in Shenzhen, a coast city in subtropical region over Southern China, for the period of 2003 - 2009. The results show that:
1) The peak period for ILI (%) in Shenzhen city occurs in its Summer. This is rather different from the observations in temperate regions in China where the flu outbreak often happens in Winter or Autumn.
2) ILI (%) in Shenzhen has significantly negative relationships with the concentrations of PM10 and SO2 but a positive relationship with VP. These relationships are also quite different from the results seen in the temperate regions.
3) The seasonality of acid rain contribute to the seasonal variation of influenza in Shenzhen city. In Summer, Vapor Pressure is relatively high and rain acidity is low, this is in favor of the flu pandemic, while the condition in Winter is almost the opposite.
4) VP, SO2 and PM10 together can explain nearly 50% of the variance of ILI (%), of which half is contributed by VP alone. Based upon the fact that VP, SO2 and PM10 have a significant time-lag correlation with ILI (%), a statistical ILI (%) forecasting method can then be developped.
The mechanism of how VP and air pollutants influence the Influenza-Like-Illness will be revealed in our further study by the comparison analysis of ILI’s chan-

Table 2. The correlation coefficients between ILI (%) and environmental elements (with environmental variables leading ILI (%) by 0 to 7 days).
ging pattern and its relationship with VP and air pollutants in Shenzhen and Wuhan, a inland city in temperate region over Central China. Our research will focus on two main aspects: 1) The difference of the seasonal changing pattern of ILI in this two region. Our preliminary finds tend to suggest that the peak period for ILI (%) in Wuhan city occurs in Winter, this is quite different from that of in Shenzhen. 2) The difference of the chemical composition characteristic of atmospheric precipitation, the difference of the seasonal changing pattern of VP and air pollutants and their relationships with ILI in this two region. Our research purpose is trying to analyze the cause of ILI’s seasonal changing pattern and try to improve its prediction technique.
5. Acknowledgements
The authors thank the Shenzhen Meteorology Bureau for providing meteorological data, air pollutants observationnal data, thank Shenzhen Center for Disease Control and Prevention (CDC) for providing the ILI data, thank professor Huqiang Zhang and Donglian Sun for their kind assistance and good suggestions.
REFERENCES
- C. Z. Chen and W. G. Chen, “Preliminary Analysis of Correlation between Respiratory Disease and Urban Air Pollutants,” Shanghai Environmental Sciences, Vol. 13, No. 9, 1994, pp. 27-30.
- J. W. Dong, X. P. Xu, D. W. Dockery and Y. D. Chen, “Associations of Air Pollution with Unscheduled Outpatient Visits in Beijing Longfu Hospital in 1991,” Chinese Journal of Epidemiology , Vol. 17, No. 1, 1996, pp. 13- 16.
- S. L. Wang, X. B. Guo and J. L. Zhang, “Study on the Effects of Ambient Air Pollution on Respiratory Disease and Symptoms among School-Age Children in Beijing,” Journal of Environmental Health, Vol. 21, No. 1, 2004, pp. 41-44.
- J. G. Tan and Y. F. Zheng, “Prospects and Progress in Researches on Medical Meteorology in Recent 10 Years,” Meteorological Sciences and Technology, Vol. 33, No. 6, 2005, pp. 550-553.
- G. Q. Chang, L. G. Wang and X. C. Pan, “Study on the Associations between Ambient Air Pollutants and the Number of Patients Visiting in Hospital in Beijing,” Chinese Journal of School Doctor, Vol. 17, No. 4, 2003, pp. 295-297.
- Y. C. Shan, T. A. Xu, D. Lu, X. S. Zheng and H. X. Du, “Analysis of Atmospheric Environmental Characteristics during Flu Rage and Flu Categorical Forecasts,” Meteorological Sciences and Technology, Vol. 31, No. 6, 2003, pp. 389-392.
- A. Petroeschevsky, R. W. Simpson, L. Thalib and S. Rutherford, “Association between Outdoor Air Pollution and Hospital Admissions in Brisbane,” Archives of Environmental Health, Vol. 56, No. 1, 2001, pp. 37-52. doi:10.1080/00039890109604053
- C. L. Xiao, L. J. Ye and W. J. Sun, “Effect of Air Pollution on Immuno Function of Body Fluid of Children,” Journal of Shenyang Medical College, Vol. 3, No. 4, 2001, pp. 187-188.
- A. P. An, L. F. Guo and H. Q. Dong, “The Research Progress of the Effects of Atmospheric Environment upon Human Health in China,” Journal of Environmental & Occupational Medicine, Vol. 22, No. 3, 2005, pp. 279- 282.
- I. Andersen, P. L. Jensen, S. E. Reed, J. W. Craig, D. F. Proctor and G. K. Adams, “Induced Rhinovirus Infection under Controlled Exposure to Sulfur Dioxide,” Archives of Environmental Health, Vol. 32, No. 3, 1977, pp. 120- 126.
- S. Becker and J. M. Soukup, “Effect of Nitrogen Dioxide on Respiratory Viral Infection in Airway Epithelial Cells,” Environmental Research, Vol. 81, No. 2, 1999, pp. 159- 166.
- R. D. Brook, B. Franklin, W. Cascio, Y. Hong, G. Howard, M. Lipsett, R. Luepker, M. Mittleman, J. Samet, S. C. Smith and I. Tager, “Air Pollution and Cardiovascular Disease: A Statement for Healthcare Professionals from the Expert Panel on Population and Prevention Science of the American Heart Association,” Circulation, Vol. 109, No. 21, 2004, pp. 2655-2671. doi:10.1161/01.CIR.0000128587.30041.C8
- G. J. Zhang, B. L. Luo and C. Zhang, “An Analysis on Acid Rain and Ultraviolet Impacting on SARS Epidemic Situation,” Practical Preventive Medicine, Vol. 11, No. 5, 2004, pp. 888-891.
- P. Penttinen, M. Vallius, P. Tiittanen, J. Ruuskanen and J. Pekkanen, “Source-Specific Fine Particles in Urban Air and Respiratory Function among Adult Asthmatics,” Inhalation Toxicology, Vol. 18, No. 3, 2006, pp. 191-198. doi:10.1080/08958370500434230
- C. M. Wong, L. Yang, T. Q. Thach, P. Y. K. Chau, K. P. Chan, G. N. Thomas, T. H. Lam, T. W. Wong, A. J. Hedley and J. S. M. Peiris, “Modification by Influenza on Health Effects of Air Pollution in Hong Kong,” Environmental Health Perspectives, Vol. 117, No. 2, 2009, pp. 248-253. doi:10.1289/ehp.11605
- J. Shaman and M. Kohn, “Absolute Humidity Modulates Influenza Survival, Transmission, and Seasonality,” Proceedings of the National Academy of Sciences, Vol. 106, No. 9, 2009, pp. 3243-3248. doi:10.1073/pnas.0806852106
- Chinese Center for Disease Control and Prevention, “Nation Monitoring and Implementary Scheme on Flu and Human Avian Influenza (2005-2010),” 2005. http://www.chinacdc.cn/n272442/n272530/n294176/n339986/appendix/20050819003.doc
- G. A. Fairchild, “Effort of Ozone and Sulfur Dioxide on Virus Growth in Mice,” Archives of Environmental Health, Vol. 32, No. 1, 1977, pp. 28-33.
- X. J. Yin, R. Schafer, J. Y. Ma, J. M. Antonini, D. D. Weissman, P. D. Siegel, M. W. Barger, J. R. Roberts and J. K. Ma, “Alteration of Pulmonary Immunity to Listeria Monocytogenes by Diesel Exhaust Particles (DEPs). I. Effects of DEPs on Early Pulmonary Responses,” Environmental Health Perspectives, Vol. 110, No. 11, 2002, pp. 1105-1111. doi:10.1289/ehp.021101105
- I. Jaspers, J. M. Ciencewicki, W. Zhang, L. E. Brighton, J. L. Carson, M. A. Beck and M. C. Madden, “Diesel Exhaust Enhances Influenza Virus Infections in Respiratory Epithelial Cells,” Toxicological Sciences, Vol. 85, No. 2, 2005, pp. 990-1002. doi:10.1093/toxsci/kfi141
- J. J. Cannell, R. Vieth, J. C. Umhau, M. F. Holick, W. B. Grant, S. Madronich, C. F. Garland and E. Giovannucci, “Epidemic Influenza and Vitamin D,” Epidemiology & Infection, Vol. 134, No. 6, 2006, pp. 1129-1140. doi:10.1017/S0950268806007175
- Z. J. Andersen, P. Wahlin, O. Raaschou-Nielsen, T. Scheike and S. Loft, “Ambient Particle Source Apportionment and Daily Hospital Admissions among Children and Elderly in Copenhagen,” Journal of Exposure Science and Environmental Epidemiology, Vol. 17, No. 7, 2007, pp. 625- 636. doi:10.1038/sj.jes.7500546
- W. L. Chameides and A. W. Stelson, “Aqueous-Phase Chemical Processes in Deliquescent Sea-Salt Aerosols: A Mechanism That Couples the Atmospheric Cycles of S and the Sea Salt,” Journal of Geophysical Research, Vol. 97, No. D18, 1992, pp. 20565-20580. doi:10.1029/92JD01923
- J. P. Zhang, Y. M. Hu and C. W. Wang, “Analysis of Characteristics and Sources of Acid Rain in Shenzhen City,” Journal of Soil and Water Conservation, Vol. 21, No. 2, 2007, pp. 166-169.
- Y. L. Huang, Y. L. Wang, L. P. Zhang, X. K. Zhen, W. B. Zhu and G. P. Fu, “Chemical Composition Characteristic of Atmospheric Precipitation in Shenzhen from 1980 to 2004,” Ecology and Environment, Vol. 17, No. 1, 2008, pp. 147-152.
NOTES
*Corresponding author.