American Journal of Climate Change
Vol.05 No.03(2016), Article ID:69376,17 pages
10.4236/ajcc.2016.53024
Analysis of Extreme Precipitation Events over Central Plateau of Iran
Iman Rousta1*, Mohsen Soltani2, Wen Zhou3, Hoffman H. N. Cheung3
1Department of Geography (Climatology), Yazd University, Yazd, Iran
2Institute of Meteorology and Climate Research, Karlsruhe Institute of Technology, Garmisch-Partenkirchen, Germany
3Guy Carpenter Asia-Pacific Climate Impact Centre, School of Energy and Environment, City University of Hong Kong, Hong Kong, China

Copyright © 2016 by authors and Scientific Research Publishing Inc.
This work is licensed under the Creative Commons Attribution International License (CC BY).
http://creativecommons.org/licenses/by/4.0/


Received 9 February 2016; accepted 30 July 2016; published 2 August 2016
ABSTRACT
This paper describes the results of an analysis of extreme rainfall events in the central plateau of Iran. To study the extreme events, daily records of eighteen stations’ rainfalls in the region for different initial dates up to 2005 gathered from the bureau of meteorology. Then, the extreme rainfall threshold was calculated for each individual station using the statistical index of Gamble type I. Lastly, 22 mm was determined as the extreme rainfall value for the entire stations, and eventually 17 out of 169 extreme precipitation events were extracted in accordance with three factors including a) days with precipitation in not less than 50% of the stations, b) maximum rain- fall is 22 mm or more in at least one of the stations, and c) mean precipitation of the basin is more than 3 mm. In the next step to analyze the synoptic features, the relevant meteorological data i.e. relative vorticity, geopotential height, sea level pressure, u and v wind components, relative humidity, vertical velocity, and precipitable water content at multiple levels of the atmosphere were examined from the NCEP/NCAR reanalysis dataset. The synoptic findings indicate that two patterns of deep trough and high ridge of the eastern Mediterranean were responsible for making the heavy precipitation events over the central plateau of Iran. The most and severest rainfall events occurred via deep tough pattern, which covered 76% of days with extreme precipitations during the examined period. Furthermore, the results suggest that the main moisture resources, which identified by HYSPLIT model’s outputs and moisture convergence/divergence zones for the rainy systems in the first pattern (deep trough) including Persian Gulf, Oman Sea, Indian Ocean, and Red Sea, while for the second pattern (high ridge) Persian Gulf and Red Sea play a significant role in feeding the storms in the central regions of Iran. Moreover, the southward movement of Polar Vortex is also considered as those important factors to produce extreme precipitation events over the central plateau of Iran. In general, the HYSPLIT trajectories model’s outputs confirmed the observed synoptic features in particular for the systems’ moisture feeding discussed in the patterns.
Keywords:
Extreme Precipitation Occurrence, Synoptic Analysis, Trough and Ridge of Eastern Mediterranean, HYSPLIT Trajectories Model, Moisture Convergence, Central Plateau, Iran

1. Introduction
Flash floods associated with extreme rain events are a major hydrological disaster in the central plateau of Iran because of the unique topographic features of the region as well as high frequency of the occurrence of such events. Knowledge of the spatiotemporal distribution of these events in the region and an understanding of the factors responsible for them, therefore, would be immensely useful for appropriate disaster preparedness. Iranian plateau, however, with regard to its specific geographic position is located in conjunction with large-scale synoptic features of the atmospheric general circulation, and also is to be considered as a place for interaction between the tropical and sub-tropical systems. This feature, together with a special topography resulted in a great diversity of precipitation events to be observed for that region [1] . Studies regarding extreme events have received growing attention since the Intergovernmental Panel on Climate Change (IPCC) second assessment report [2] . From a global view, the changes of precipitation patterns extremes are not clear, although increases in heavy precipitation [3] and annual precipitation [4] have been found. However, the differences found at a regional scale have prompted a proliferation in regional studies on trends of extreme precipitation in widely separated and contrasting areas [5] - [13] .
Several studies on extreme precipitation events associated with the statistical and synoptic analyses using various techniques over Iran [14] - [17] and worldwide [18] - [20] carried out by researchers.
[21] , attempted to analyze the effects of cut-off low on the extreme precipitation occurrence over the central and southwest of Iran from a synoptically point of view. They found that the onset of Siberia high as well as formation of an extensive cut-off low over southern Caspian Sea and the center of the country was responsible for the extreme rainfall events for that region. A statistical-synoptically analyses on the extreme precipitation events carried out by [22] over Kerman province. They suggest that Eastern Mediterranean’s trough plays a significant role in producing the extreme rainfalls for that area. [23] Examined the heavy rainfall events synoptically during December 31, 1984 through January 4, 1985 over south Iran. They found that at surface level Siberia high, Azores dynamical high as well as a combined form of Sudanic low with Mediterranean system, and at upper levels, Azores high center behind the rainy system and Saudi’s high center in front of the rainy system as well as a deep trough of north Africa are responsible for occurrence of the heavy rainfall events in that region. A synoptic analysis of heavy rainfall during March 7, through March 15, 2007 was conducted by [24] in West Iran. They suggest that Mediterranean low system together with a tongue of Sudanic low caused this rain event, and Mediterranean, Black and Red Seas played a significant role in feeding the system’s moisture, as well [25] . Identified the synoptic patterns of extreme precipitation events for northeast Iran, and suggest that Sudanic low, combined lows of Sudanic-Mediterranean and Mediterranean lows systems have a great influence on the occurrence of extreme rainfall events for that region.
In other parts of the world analyses were made to investigate the extreme rainfall events using different techniques. [26] , for example, compared the anomalies of extreme precipitation for 1895-1905 and 1990-2000 with respect to an extended period (1895-2000). They found small positive anomalies along the West Coast (except for Oregon) for the recent (1990-2000) period, but noted that the positive anomalies were greater for 1895-1905, suggesting the importance of natural variability. In a similar study, [27] plotted the median value of a set of eight extreme precipitation measures for 1895-2000 (for periods of one, five, and 30 days and one-, five-, and 20-year return periods) and found modest increases over western Washington and northwest Oregon, declines over the central and southern Oregon coastal zones, and little trend over northern coastal California. Madsen and [28] examined the frequency of one-day precipitation events with a recurrence interval of one year or longer for 1948-2006, using the National Climatic Data Center (NCDC) Cooperative and Summary of the Day data set. They found a modest, statistically significant increase over western Washington, little change over northwest Oregon, a statistically significant decrease over southern Oregon and northern California, and a significant increase over the central and southern California coastal zones. Comparative analysis of indices of extreme rainfall events in relation to variations and trends from southern Mexico was conducted by [29] . They found that the variations in extreme events were significantly related to El Nino-Southern Oscillation (ENSO) and the Pacific Decadal Oscillation (PDO), with extreme events tending to occur more frequently during La Nina periods and during the positive phase of the PDO. [30] presented an analysis on extreme precipitation changes across the Iberian Peninsula using a seasonal and annual aggregation of observed precipitation data and showed that the main changes occurred in the intensity of northern and southern stations, with a decreasing trend over time, suggesting that further work will be necessary to obtain a complete view of the spatiotemporal variability of daily precipitation in the Iberian Peninsula [31] . Provide an insight of the spatial distribution of extreme precipitation indices in Southern Portugal, investigating yearly trends and decadal space-time patterns showing that there are no significant trends in the regional extreme indices studied.
The above studies are characterized by considerable differences in the magnitude and sign of extreme precipitation trends, the periods and extreme precipitation measures considered as well as the spatial variability of the these events. Nevertheless, many of these studies had elements in common. An understanding of the atmospheric mechanism controlling extreme rainfall is necessary for assessing natural hazard risk and for developing strategies of mitigation and response to these extreme events. For this purpose, the present study also seeks to identify the main synoptic patterns associated with heavy precipitation events in the central plateau of Iran. The paper is organized as follows: after a brief introduction and review of background related to the extreme precipitation event’s literature, the methodology applied is described in Section 2. The main results are presented in Section 3. Finally, in Section 4, a summary of these results is drawn.
2. Methodology
To identify the extreme precipitation patterns over the central plateau of Iran, at first the daily records of precipitation for 18 sites covering the entire region for different initial dates up to the year 2005 were gathered from the I. R. of Iran Meteorological Organization (IRIMO). Table 1 shows the general long-term characteristics of

Table 1. Long-term characteristics of precipitation in the selected weather stations.
the landfalls, and also the geographical locations of the stations in the central plateau of Iran are shown in Figure 1. It is almost infeasible to determine a specific value for the rainfalls an extreme precipitation index for the entire country due to the diversity of the regions of precipitation in which it varies from place to place in the country. In the present research, therefore, we employed the statistical distribution of Extreme Value Type I, which is usually applied for positive skewness data to calculate the extreme values for each individual site. This distribution is highly recommended for regions with large deviation in the long-term mean rainfall of the stations for that area. This is because, the extreme precipitation index for a given site is determined based on the rainfall characteristics of that station, but not in accordance with the mean precipitations of all the stations in that region Equation (1).
 (1)
(1)
where, µ is mean data (average days with precipitation), σ standard deviation (SD for days with precipitation) and k frequency coefficient of data, which it is computed in terms of different return periods [32] .
In this research, however, the frequency coefficient of data measured for a 50-year return period as well as the extreme precipitation index for each individual station was calculated based on their average rainfall records. Having calculated the extreme values (precipitation) index, an arithmetic mean was carried out of the calculated extreme precipitation and in the long run, 22 mm determined as the extreme value index for the entire study area. With regard to the point that the extreme value index of eighteen stations under study is between 17 mm and 30.8 mm; 22 mm was confirmed as the indicator of the extreme precipitation index over the central plateau of Iran. On the whole, 17 extreme precipitation events out of 169 events were selected Table 2 to be analyzed during the study period, according to the index value (22 mm) as well as the following three factors:
1) Days with precipitation in not less than 50% of the stations;
2) Maximum rainfall is 22 mm or more in at least one of the stations;
3) Mean precipitation of the basin is more than 3 mm.
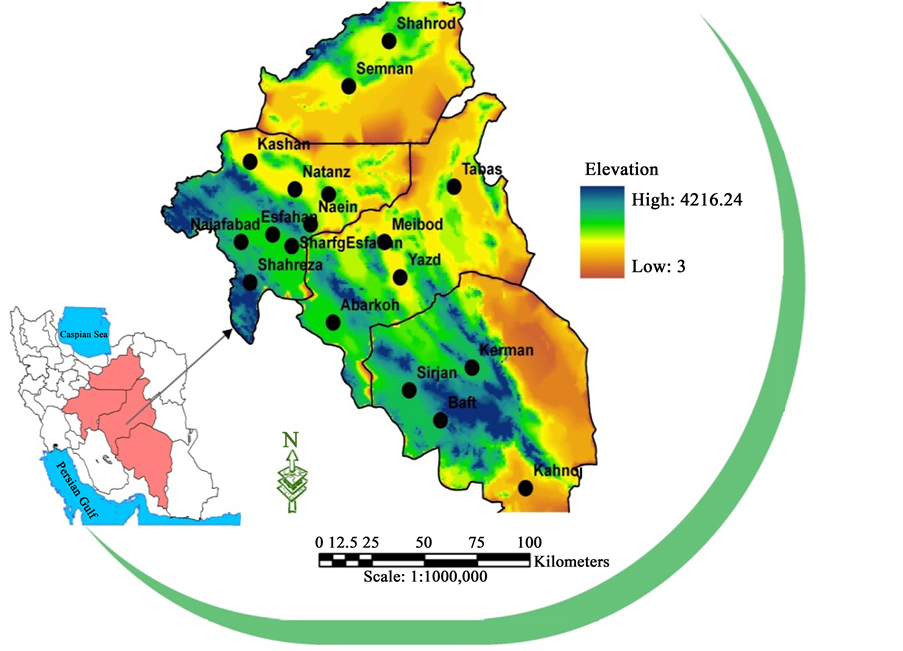
Figure 1. Geographic location of eighteen stations in the central plateau of Iran considered in this study. The stations are identified by black points with underlying topography.
Table 2. The days of study with precipitation values for each weather station.
In the next step, different data sources namely National Centers for Environmental Prediction/National Center for Atmospheric Research (NCEP/NCAR) reanalysis dataset [33] and the European Centre for Medium- Range Weather Forecasts (ECMWF), ranging from hourly to daily variables at multiple levels of the atmosphere were applied.
In synoptic analysis, however, we will consider the following variables: surface (hPa) and upper pressure (m) levels, relative humidity (%), u and v wind components (m/s), precipitable water content (kg/m2), vertical velocity (Pascal/s), and hourly and daily total of precipitation (mm). The weather charts then produced using Grid Analysis and Display System (GrADS) software [34] . Furthermore, the hourly and daily precipitation data used for the selected patterns, gathered from ECMWF. Lastly, the principle features of all extreme precipitation events were closely examined using outputs produced by the software, and eventually the effective patterns in making the extreme precipitations over the central plateau of the country were classified into two major patterns: Eastern Mediterranean’s deep trough pattern and Eastern Mediterranean’s high ridge pattern, as well.
3. Results and Discussion
After examining the monthly pattern of the eastern Mediterranean’s deep trough, we found that March with 4 extreme precipitation occurrences possesses the most events, February ranked as the second one with 3 events and also January and December with 2 events classified as the third rankings. In addition, April with 57 mm was recognized as the severest extreme precipitation event among the selected days as well as December and March months identified as the second and third rankings with 46 mm and 39 mm, respectively in this pattern. On the whole, 13 (76%) out of 17 events of extreme precipitations took place within this pattern.
The second pattern i.e. Eastern Mediterranean’s high ridge pattern includes only 4 events (24%) of the extreme precipitations, which occurred in January, February, November and December months. January with 41 mm ranked first, November classified as the second rank with 37 mm, as well as December and February months with 31 mm and 30 mm, respectively ranked as the next positions in this pattern. The heaviest daily precipitation events taken place in Baft, Abarkoh and Sirjan stations with 57 mm, 46 mm and 39 mm, respectively among the selected weather stations Table 3 and Figure 2.
Furthermore, the years 2000, 1999, 2005, 2003 and 1997 with precipitations 37 mm, 39 mm, 41 mm, 46 mm and 57 mm, respectively hold the heaviest precipitation events among the selected years Table 2. Having identified the extreme precipitation events, we attempted to study the synoptic features of these events. It is believed that, however, there are two major patterns in times of extreme precipitation occurrence over the central plateau of Iran, which nominated as the Eastern Mediterranean’s deep trough pattern as well as the Eastern Mediterranean’s high ridge pattern, which in the following sub-sections they are explained in detail separately.
Table 3. The heaviest, number and frequency of precipitation events for each individual pattern.
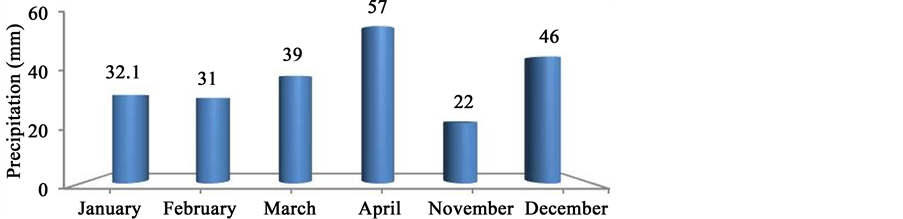
Figure 2. The distribution of extreme precipitations by month.
3.1. Eastern Mediterranean Deep Trough Pattern
3.1.1. Synoptic Analysis
The main features of this pattern with heavy precipitation days are as follows: since low geopotential height (compared to other locations at the same latitude) indicates the presence of a storm or trough at mid-troposphere levels, it can be seen that at 500 hPaa deep trough extended over the Middle East with a direction northeastern-southwestern expanded even to the latitudes 18˚N and 25˚N over Red Sea provided a suitable condition for air rising resulting in a weather turbulence in the regions ahead including the study area, while the surrounding areas where a relatively high geopotential height is predominant with a ridge, the weather is quiescent Figure 3(a). The size of the trough’s enlargement southwards is strongly depending on a ridge to be generated over Europe which enables the trough to be deepened. At surface, the thermal Sudan’s low is converted to a dynamic low moving towards the east and northeast direction and it is extended even to the southwestern Iran and Saudi Arabia as well, due to locating the eastern Mediterranean’s trough axis with a direction of north-south to northeastern-southwestern between the longitudes 25˚E and 40˚E at the level of 500 hPa Figure 3(a).
The streams blow southwestern at 500 hPa over the central plateau of the country. Positive vorticity, which indicates counterclockwise rotation of the winds, and/or lateral shear of the wind with stronger flow to the right of the direction of flow, is quite strong exceeding 9 × 10⁻⁵ s−1 in the eye of the cyclone. The positive vorticity is quite in good agreement with those of geopotential height fields, as positive vorticity at 500 hPa is associated with cyclones or storms at upper levels, and will tend to coincide with troughs in the geopotential height field Figure 3(a). At surface features, in this pattern, it can be seen that the Sudanic low spread out extraordinary towards the higher latitudes so that resulted in a closed low pressure to be formed over Mediterranean Sea with a central pressure 1005 hPa Figure 3(b). It has been always available at least a Sudanic system locating between longitudes 40˚E and 55˚E as well as latitudes 25˚N and 35˚N during the occurrence of the extreme precipitation events under this pattern. In addition, the trough was positively tilted and during January 11, 2004 had started to progress towards the east of the region. The surface high, which situated over the Caspian Sea (with a central pressure 1030 hPa) as a result of the extension of the Siberia high, was located under a diffluent region at upper

Figure 3. Analysis charts derived from NCEP/NCAR reanalysis dataset for: (a) 500 hPa geopotential height contours (m) and relative vorticity (10−5 s−1) shading; (b) SLP in hectopascal pressure (contours and shading); (c) Mean relative humidity (%) at 850 hPa height represented in blue shaded, and streamlines are drawn in black barbs (m/s); (d) Precipitable water content (kg/m2) shading and vertical velocity (Omega) at 850 hPa (Pascal/s) black contours valid at January 11, 2004.
tropospheric levels, which helped maintain weak vertical wind shear above the system Figure 3(b). The surface high moved eastward (not shown) in accordance with the general easterly component of movement of the upper trough and also the northeasterly steering flow between the surface and the mid-troposphere circulation in the apex of the upper level trough.
Southwesterly winds are blown over Iran but changed the direction to northwestward due to the influence of the anticyclonic system over Oman Sea. With regard to this high center locating in front of the trough over the Middle East as well as regarding the location of Sudanic low at beneath the axis of the eastern Mediterranean’s trough and simultaneously convergence of these three systems with together, it has been led to transferring the moisture from Red, and Arabian Seas as well as Persian Gulf to the central plateau of the country resulted in extreme precipitation events for that region. It should be mentioned that the high center over Oman Sea is not affected all of the precipitation events, but it intensifies the events via transferring the moisture of Oman sea and Persian gulf when its axis is located between the longitudes 60˚E and 65˚E and the center is closed between the latitudes 18˚N and 22˚N. Therefore, the relative humidity values varied between 50% - 100% over the region under study Figure 3(c). The amounts of precipitable water exceeded 15 kg/m2 on January 11, 2004 Figure 3(d) over the central plateau of the country. As well as, a relatively strong upward motion (negative vertical velocity values) with more than −0.08 Pas s−1 is seen over the region Figure 3(d). Generally, it is worthwhile to mention that there is a good agreement between the negative vertical velocity values and the amounts of precipitable water contents Figure 3(d).
3.1.2. HYSPLIT Trajectory Model and Moisture Convergence
We also tried to investigate the rainy system in relation to the individual (wet) air parcels value as well as moisture convergence condition Figure 4. A backward trajectory Lagrangian model, therefore, was applied to further investigate the system under study. The model was run for three stations i.e. Esfahan, Abarkoh and Kahnoj stations with ending at the peak time and ending time of the system’s activity over the central regions of Iran at 1200 UTC January 11 Figure 4(a), and 1600 UTC January 12, 2004 Figure 4(b) each one with 72 hours run duration. The result indicates that at the peak time of rainfall event namely at January 11, 2004, due to the activity of an anticyclonic system over Oman Sea at 850 hPa level Figure 3(c) the wet air particles in the selected stations at lower levels i.e. 500 and 1500 meter above ground levels, originated from Indian Ocean and passed through Oman Sea as well as in particular Persian Gulf over the past three days (72-h) till the peak time of system’s activity over the region Figure 4(a). Consequently, as Table 2 indicates, a considerable amount of rainfall recorded at Esfahan (6 mm), Abarkoh (25 mm) and Kahnoj (6.8 mm) sites on January 11, 2004. At the same time, as a result of the eastern Mediterranean deep trough, the air particles at 5000 AGL came from northeast of Africa in particular from Red Sea Figure 4(a). The backward trajectories with ending at end time namely 1600 UTC January 12, 2004 for the system Figure 4(b) also indicate that the high system at lower levels left the Indian Ocean completely westwards located over the Saudi Arabia peninsula resulted in to stop the moisture transport from Indian Ocean through lower levels streams i.e. 500 and 1500 AGL Figure 4(b), despite the fact that the streams were still passing through the Persian Gulf. The air particles at 5000 AGL maintained their directions’ position, though Figure 4(b). In general, the HYSPLIT model outputs confirm the observed synoptic features for the system discussed above.
Figure 4(c) and Figure 4(d), depict surface wind and moisture convergence/divergence zones. This chart is most useful for locating areas where thunderstorms likely to develop. The shading represents moisture convergence, green for convergence―positive areas, and red for divergence―negative areas, represented at a contour interval of 0.5 g∙kg−1∙s−1. Areas of persistent moisture convergence over the central regions of the country are favored regions for the rainy system development, since other factors e.g., instability were quite favorable. Two of the primary factors in developing thunderstorms are a supply of moisture and low-level convergence. These two quantities are combined in these charts Figure 4(c), Figure 4(d) to compute moisture convergence. Surface moisture convergence generally precedes the development of thunderstorms by a few hours. The main resources of moisture for the rainy system on January 11, 2004, as Figure 4(c) indicates, had been transferring from Indian Ocean and Persian Gulf towards the study area, as these resources were identified as divergence zones, which conveyed huge amount of humidity to the region under study Figure 4(c). In contrast, at the ending time of the system’s activity, the focal point of the moisture convergence moved to northern parts of the country, mainly because of displacement of divergence fields towards the southern Iran Figure 4(d). In general, it is worthwhile to mention that there is a very good agreement between the wet air parcels trajectories Figure 4(a),
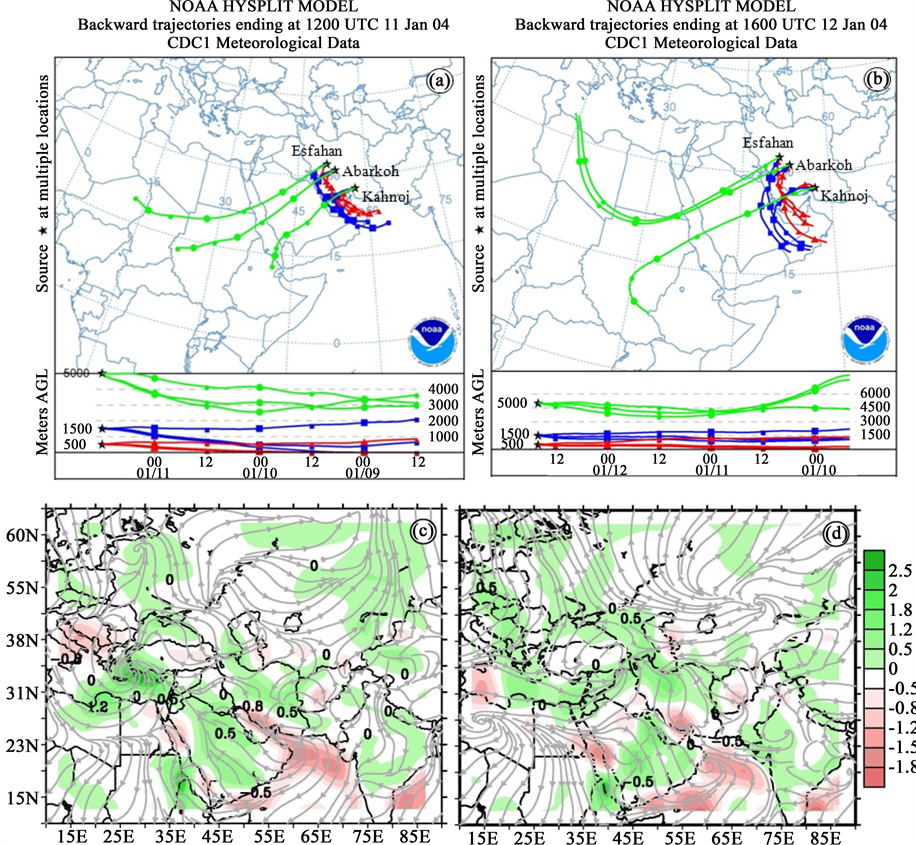
Figure 4. HYSPLIT model backward trajectory outputs ending at the peak time (a) and ending time (b) of system’s activity over the region valid at 1200 UTC January 11, and 1600 UTC January 12, 2004 respectively. Model ran for 72 hours and used a 12 hour time steps (nodes). The figures demonstrate the individual air parcels at three levels (500, 1500 and 5000 m above ground level (AGL)) selected at Esfahan, Abarkoh and Kahnoj stations. Backward trajectory cross sections included in bottom of each figure for same levels. Moisture convergence (green shading) and divergence (red shading) zones (g∙kg−1∙s−1) and wind streams (m∙s−1) at surface level valid at the same as in (a) and (b), respectively. Moisture convergence/divergence was computed with GrADS software using 7 variables: relative humidity, air temperature, vapor pressure, mixing ratio, u and v wind components and dew point temperature using NCEP/NCAR reanalysis dataset.
Figure 4(b), and moisture convergence and divergence fields Figure 4(c), Figure 4(d) during the study period over the region.
3.1.3. Precipitation
Interim-full-daily total of precipitation data derived from ECMWF together with 4-times daily geopotential height at 500 hPa derived from NCEP/NCAR reanalysis dataset for January 11, 2004 are shown in Figure 5. Figures 5(a)-(d), indicate hourly total of precipitation in 3-h steps for 0000 UTC January 11, 0600 UTC January 11, 1200 UTC January 11, and 1800 UTC January 11, 2004 respectively, with the hourly geopotential heights in 6-h steps overlaid for the same dates. According to the figures, in early January 11, the eastern portion of study area was situated in front of an eastern Mediterranean deep trough and due to availability of other criteria such as instability and moisture feeding, a considerable amount of rainfall recorded at 0000 UTC January 11 Figure 5(a). Six hours later i.e. at 0600 UTC January 11, the precipitation values intensified to some extent and moved to the central and eastern parts of the region Figure 5(b) But the heaviest hourly rain occurred 12-hours later after it was affected the central plateau of the country at 1200 UTC January 11, when 500 hPa trough more deepened and other criteria for the event were available, which intensified the landfall over the region Figure 5(c). The spatial distribution of the precipitation pattern is similar to that noted in the pressure patterns (surface and upper levels in Figure 3(a) and Figure 3(b)).
In fact, the extreme rainfall event is due to a deep Mediterranean trough that extended from northwest of the country to central plateau of Iran. The storm’s intensity let up for the next 6 hours, and the precipitation region moved southward to some extent but went on to rain with far less intensity over the southern areas of the central
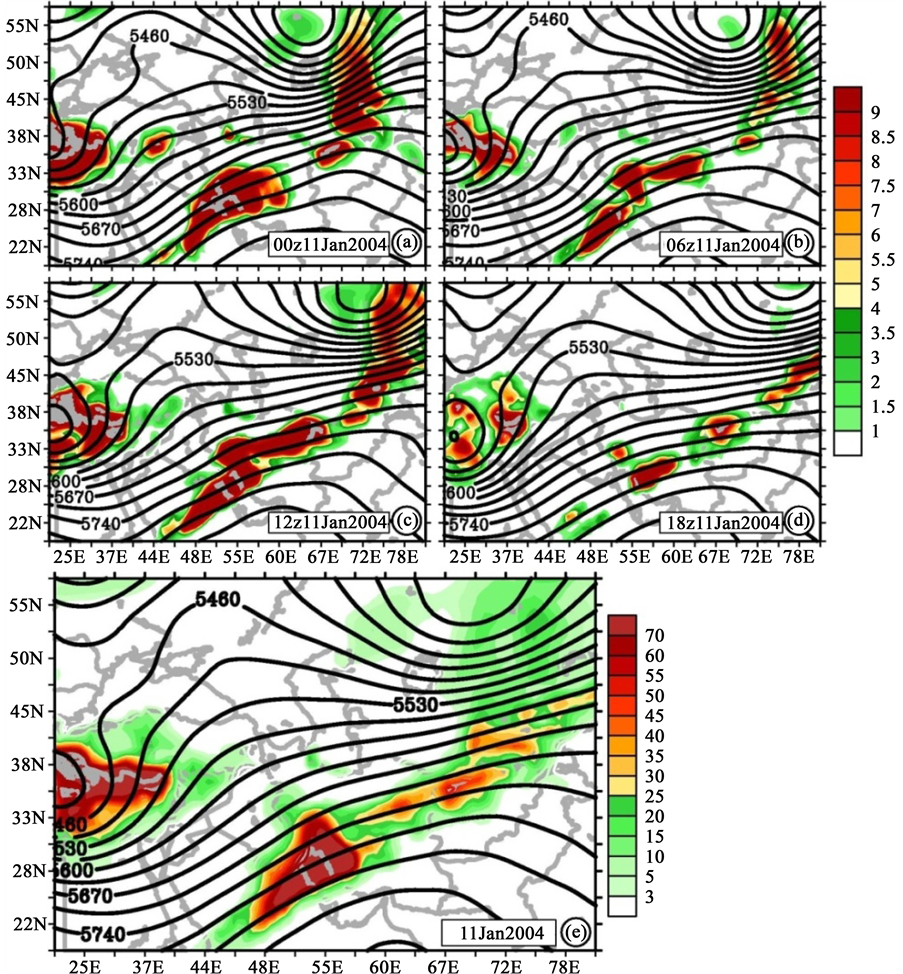
Figure 5. Interim-full-daily total of precipitation (mm) data in 3-hours step derived from ECMWF and 4-times daily geopotential height (m) at 500 hPa derived from NCEP/NCAR reanalysis dataset valid for (a) 0000 UTC January 11, (b) 0600 UTC January 11, (c) 1200 UTC January 11, (d) 1800 UTC January 11, 2004; and (e) daily total of precipitation and 500 hPa mean daily geopotential height valid at January 11, 2004.
plateau Figure 5(d). The daily total of precipitation together with 500 hPa mean daily geopotential height is shown in Figure 5(e). It is quite in a good agreement with those of the hourly total of precipitation discussed above. The position of maximum rainfalls observed out of the study area Figure 5(e) i.e. in Shiraz station (29.32˚N, 52. 36˚E) due to holding a better condition for moisture feeding as well as vertical velocity Figure 4. The result Figure 5 of rainfall distribution over the region highly shows the presence of a large-scale cyclonic circulation at upper levels (over Mediterranean Sea) and anticyclonic circulation at surface (over Caspian Sea) leading to the heavy rainfall event over the central plateau of Iran.
3.2. Eastern Mediterranean High Ridge Pattern
3.2.1. Synoptic Analysis
The principal features of this pattern with heavy precipitation days are as follows: At 500 hPa a high ridge with a northeastern-southwestern direction covered a region from eastern Mediterranean Sea through Black Sea between latitudes 65˚N and 80˚N leading to birth of a deep trough due to the large expansion the ridge over the longitudes, which extended to the longitudes45˚E and 53˚E over central plateau of the country provided a suitable condition for air rising resulting in a weather turbulence over the study area, while the western areas where a relatively high geopotential height is predominant with the ridge i.e. between latitudes 20˚N and 70˚N, the weather is quiescent. The streams blow in a direction of southwestern-northeastern at 500 hPa over the central plateau of Iran. At the same time, the positive vorticity is quite strong exceeding 9 × 10⁻⁵ s−1 in the eye of the cyclone, and it is quite in good agreement with those of geopotential height fields Figure 6(a).
At the surface map, however, a strong high pressure with central pressure 1045 hPa closed over Siberia and north of Baikal Lake resulting in to spread out the 1015 hPa and 1020 hPa isobars over Caspian Sea and some regions in the north of Iran. Concurrently, Sudanic low with the central pressure 1005 hPa formed between longitudes 30˚E and 45˚E in such a way that, at times its core cells even cover north of Indian Ocean. Another huge low pressure, accordantly, with less than 995 hPa central pressure also closed over the southern England, which it is to be considered as a gigantic and strong low along with the weak and regressive behavior of the polar vortex, these factors are to be taken into account as the major reasons of extreme landfalls under this pattern over the central plateau of Iran. In this pattern, with regard to locating a high ridge at the middle atmosphere across
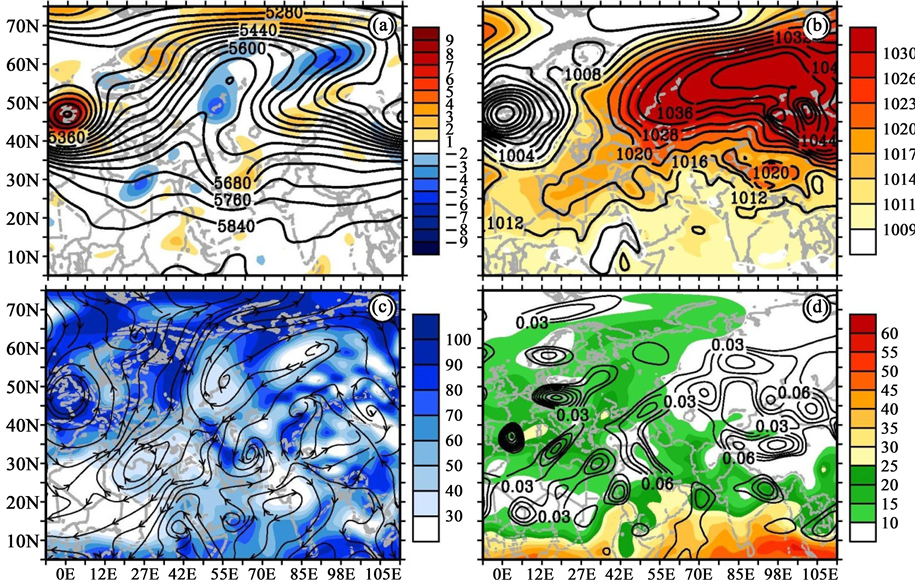
Figure 6. Same as in Figure 3, but for November 6, 2000.
the longitudes where the Sudanic low is situated at surface level, no condition is provided for the Sudanic low to be strengthen and turning into a dynamical form. This issue is clearly shown in the form of the lack of isobars concentration in the vicinity of the low center at the surface chart Figure 6(b).
With an anticyclonic circulation placing over the Persian Gulf, the moisture is absorbed feeding the rainy system over the study areaFigure6c. Therefore, Persian Gulf plays a significant role in feeding the system’s moisture over the region, although the weak role of Mediterranean and Black seas also should not be ignored. The outstanding features regarding the occurrence of landfalls under this pattern include: weakening the polar vortex which regressed and moved backward to above the latitudes 80˚N and also more influence of Red Sea in feeding the humidity for rainfall under this pattern as well as the movement of Indian Ocean high to the longitudes between 60˚E and 65˚E, which with an anticyclonic circulation, it is admittedly transferring the moisture of the Indian Ocean and Oman Sea to the region under study, to some extent. On the other hand, the moisture resources of this pattern similar to the previous pattern, originated from Persian Gulf and Red sea locating between the latitudes 20˚N and 30˚N Figure 6(c). Therefore, the relative humidity values varied between 50% - 90% over the central plateau of Iran Figure 6(c). The amounts of precipitable water exceeded 18 kg/m2 on November 6, 2000 Figure 6(d) over the region under study. In addition, a strong upward motion (negative vertical velocity values) with more than −0.1 Pas s−1 is seen over the area Figure 6(d). On the whole, it is worthwhile to mention that there is a great agreement between the negative vertical velocity values and the amounts of precipitable water contents Figure 6(d).
3.2.2. HYSPLIT Trajectory Model and Moisture Convergence
The backward trajectory model for this pattern also was run for three stations of Shargh Esfahan, Yazd and Baft, which had recorded the highest amount of rainfall see Table 2 on November 6, 2000, with ending at the peak time and ending time of the system’s activity over the region at 0300 UTC November 6 Figure 7(a), and 0600 UTC November 7, 2000 Figure 7(b) each one with 72 hours run duration. The result indicates that at the peak time of rainfall event i.e. at November 6, 2000, owing to the activity of a cyclonic system over Persian Gulf at 850 hPa level Figure 7(c) the wet air particles in the selected stations at lower levels i.e. 500 and 1500 meter above ground levels, originated mainly from Persian Gulf over the past three days (72-h) till the peak time of system’s activity over the study area Figure 7(a). As a result, as Table 2 indicates, a considerable amount of rainfall recorded at the stations of Shargh Esfahan (14 mm), Yazd (37 mm) and Baft (32 mm) on November 6, 2000. Simultaneously, due to the eastern Mediterranean high ridge, the air particles at 5000 AGL came from Red Sea towards the central regions of Iran Figure 7(a). The backward trajectories with ending at end time i.e. 0600 UTC November 7, 2000 at Shargh Esfahan and Yazd sites Figure 7(b) indicate a northerly and Baft site shows a westerly lower levels streams i.e. 500 and 1500 AGL. Also, the air particles at 5000 AGL indicate a northwesterly direction. All meaning that no moisture was transferring into the region anymore, which resulted in to stop the rainfall over the study area Figure 7(b). On the whole, the HYSPLIT model outputs confirm the observed synoptic features for this pattern’s system discussed above, as well.
The surface wind and moisture convergence/divergence zones are shown in Figure 7(c) and Figure 7(d). The main resources of the moisture for the rainy system on November 6, 2000, as Figure 7(c) indicates, had been transferring from Persian Gulf as well as Red Sea to some extent, towards the central regions of the country, as these resources were identified as divergence zones (negative areas―red shading) on the map, which conveyed a considerable amount of moisture at a rate of more than 2 g∙kg−1∙s−1 to the region under study Figure 7(c). These regions Figure 7(c) are quite in good agreement with those of HYSPLIT model’s outputs Figure 7(a). In contrast, at the ending time of the system’s activity, the focal point of the moisture convergence displaced by those of divergence zones over the study area Figure 7(d).
3.2.3. Precipitation
Figure 8 indicates the hourly total of precipitation data derived from ECMWF together with 4-times daily geopotential height at 500 hPa derived from NCEP/NCAR reanalysis dataset for November 6, 2000. The hourly total of precipitation in 3-h steps for 0000 UTC November 6, 0600 UTC November 6, 1200 UTC November 6, and 1800 UTC November 6, 2000, with the hourly geopotential heights in 6-h steps overlaid is shown in Figures 8(a)-(d), respectively. Based on the figures, in early November 6, the northeastern section of the study area was situated in front of a deep trough as a result of the extension of the Mediterranean’s high ridge toward the higher latitudes and due to availability of other criteria such as instability and moisture feeding, some amount of rainfall recorded mainly on the northwestern parts of the region at 0000 UTC November 6 Figure 5(a). Six hours later i.e. at 0600 UTC November 6, the intensity of precipitation values dwindled to some extent, but covered a larger area through moving to the central and northeastern parts of the region Figure 8(b).
The heaviest hourly rain, however, tookplace at 1200 UTC November 6, when 500 hPa trough highly deepened and other criteria for the event were available that intensified the landfall over the region Figure 8(c). The spatial distribution of the precipitation pattern is quite similar to that noted in the pressure patterns (surface and upper levels in Figure 6. A cyclonic circulation was noticed between the height 4-km and 5-km over the central plateau, especially over the western parts, where Esfahan station located and the surrounding area Figure 8(c). The intensity of the storm dwindled for the next 6 hours, and the precipitation region moved to the eastern parts of the country meaning that only a small portion of the southeastern region in the study area recorded some rainfall Figure 8(d). The daily total of precipitation together with 500 hPa mean daily geopotential height is shown in Figure 8(e). It is quite in a good agreement with those of the hourly total of precipitation discussed above. The position of maximum rainfalls observed Figure 8(e) in Esfahan station (32.37˚N, 51.40˚E) in the study area due to possessing a better condition for moisture feeding as well as vertical velocity Figure 7.
4. Summary
A climatology of extreme precipitation events over the central plateau of Iran has been conducted from a syn-
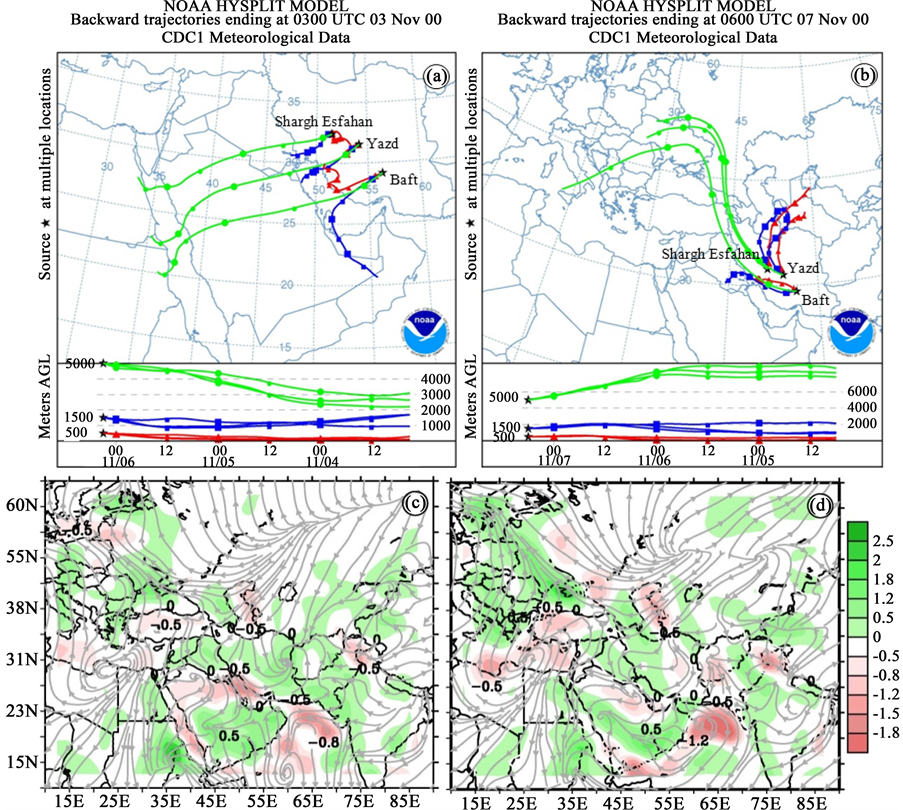
Figure 7. Same as in Figure 4, but for (a) 0300 UTC November 6, and (b) 0600 UTC November 7, 2000 respectively; at Shargh Esfahan, Yazd and Baft stations. (c) and (d) are valid at the same as in (a) and (b), respectively.
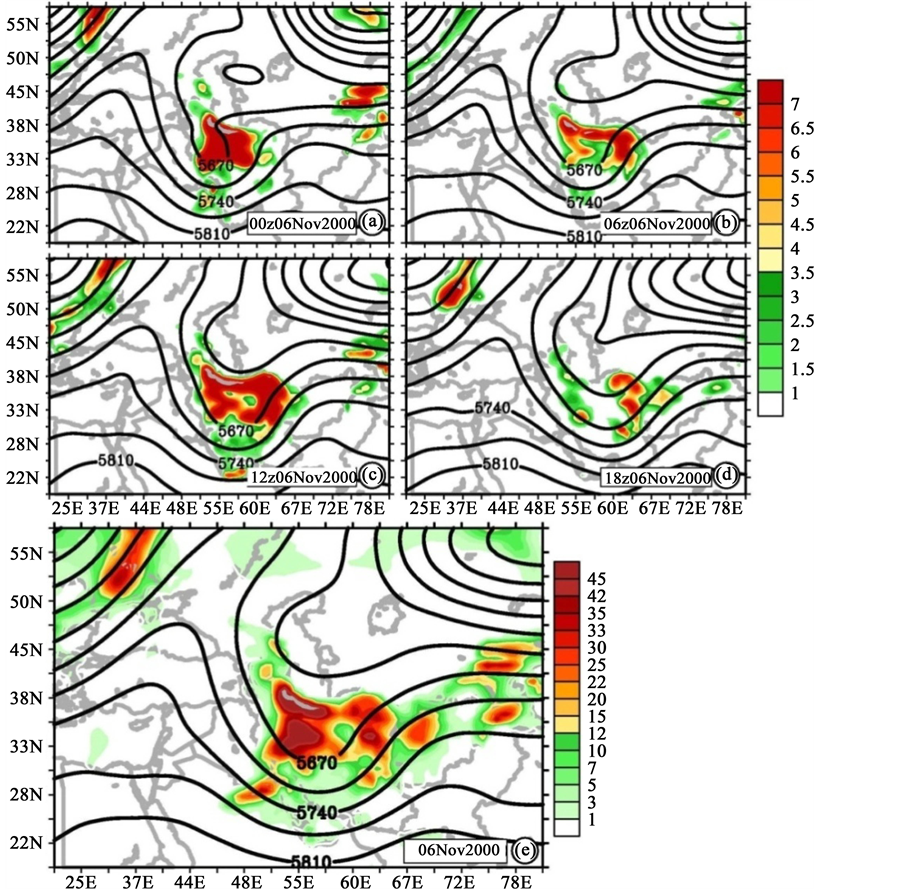
Figure 8. Same as in Figure 5, but for November 6, 2000.
optically point of view. The synoptic conditions suggest that the major drivers of the extreme precipitation events could be classified into two patterns i.e. Eastern Mediterranean’s deep trough pattern as well as Eastern Mediterranean’s high ridge pattern, which were nominated on the basis of the dynamical-synoptically features of 500 hPa level. However, our results show that the patterns of deep trough (76%) and high ridge (24%) of the eastern Mediterranean were responsible for the extreme rainfall events, which the severest events caused by the deep trough pattern. The axes of trough and ridge, in two patterns, were fluctuating between northeast-southwest and north-south directions, respectively. The dynamical conditions of eastern Mediterranean and west of Europe as well as enlargement of polar vortex towards the lower latitudes were identified as the most factors for making the extreme rainfalls over the central plateau of the country.
The analysis of surface features also suggested that in the first pattern (deep trough), a low pressure center was situated over the northwest Iran as well as Sudanic low was located over the southwest Saudi Arabia so that it was extended towards the southwest of the country with 1010 hPa and 1015 hPa isobars passing through south Iran and Persian Gulf when the extreme rainfalls were taken place over the region. While the second pattern (high ridge) representing a strong low pressure center over west Europe and a robust high pressure center over Siberia and north of Baikal lake, meanwhile Sudanic low highly weakened with far less isobar intensity and 1010 hPa isobars were traveling through the west of the country. The major moisture recourses feeding the extreme rainfall events, which identified by HYSPLIT model’s outputs and moisture convergence/divergence zones include: Persian Gulf, Oman Sea, Indian Ocean, and Red Sea. The heaviest rainfall is occurred when the dynamical condition of atmosphere is somehow to provide the required moistures from all the resources mentioned above, which these conditions were available for the first pattern, but with regard to the situation of the high ridge in the second pattern, the most moisture fed by Persian Gulf and Red Sea respectively, while the role of Mediterranean Sea cannot be ignored, and Black and Caspian Seas have no influence on the extreme precipitation events in the central regions of Iran. In general, the HYSPLIT trajectories model’s outputs confirmed the observed synoptic features in particular for the systems’ moisture feeding discussed earlier.
Acknowledgements
The daily meteorological data were provided by I. R. of Iran Meteorological Organization (IRIMO). NCEP/ NCAR data was provided by the NOAA-CIRES Climate Diagnostics Center, Boulder, Colorado, USA. As well as ECMWF data was provided by the European Centre for Medium-Range Weather Forecasts. The authors also gratefully acknowledge the NOAA Air Resources Laboratory (ARL) for the provision of the HYSPLIT trajectory model used in this publication.
Cite this paper
Iman Rousta,Mohsen Soltani,Wen Zhou,Hoffman H. N. Cheung, (2016) Analysis of Extreme Precipitation Events over Central Plateau of Iran. American Journal of Climate Change,05,297-313. doi: 10.4236/ajcc.2016.53024
References
- 1. Mofidi, A. and Zarrin, A. (2005) Investigation of Sudanic Low Systems Impacts on the Occurrence of Torrential Precipitation Events in Iran. Journal of Geographic Researches, 77, 113-136.
- 2. Folland, C.K., Karl, T., Christy, J.R., Clarke, R.A., Gruza, G.V., Jouzel, J., Mann, M.E., Oerlemans, J., Salinger, M.J. and Wang, S.-W. (2001) Observed Climate Variability and Change, Climate Change 2001.The Scientific Basis. Contribution of Working Group I to the Third Assessment Report of the Intergovernmental Panel on Climate Change. Cambridge University Press, 944.
- 3. Frich, P., Alexander, L.V., Della-Marta, P., Gleason, B., Haylock, M., Tank, A.M.G.K. and Peterson, T. (2002) Observed Coherent Changes in Climatic Extremes during the Second Half of the Twentieth Century. Climate Research, 19, 193-212.
http://www.int-res.com/abstracts/cr/v19/n3/p193-212/
http://dx.doi.org/10.3354/cr019193 - 4. Alexander, L.V., Zhang, X., Peterson, T.C., Caesar, J., Gleason, B., Tank, A.M.G.K., Haylock, M., Collins, D., Trewin, B., Rahimzadeh, F., Tagipour, A., Kumar, K.R., Revadekar, J., Griffiths, G., Vincent, L., Stephenson, D.B., Burn, J., Aguilar, E., Brunet, M., Taylor, M., New, M., Zhai, P., Rusticucci, M. and Vazquez-Aguirre, J.L. (2006) Global Observed Changes in Daily Climate Extremes of Temperature and Precipitation. Journal of Geophysical Research: Atmospheres, 111.
http://onlinelibrary.wiley.com/doi/10.1029/2005JD006290/full
http://dx.doi.org/10.1029/2005JD006290 - 5. Brown, P.J., Bradley, R.S. and Keimig, F.T. (2010) Changes in Extreme Climate Indices for the Northeastern United States, 1870-2005. Journal of Climate, 23, 6555-6657.
http://journals.ametsoc.org/doi/full/10.1175/2010JCLI3363.1
http://dx.doi.org/10.1175/2010JCLI3363.1 - 6. Choi, G., Collins, D., Ren, G.Y., Trewin, B., Baldi, M., Fukuda, Y., Afzaal, M., Pianmana, T., Gomboluudev, P., Huong, P.T.T., Lias, N., Kwon, W.T., Boo, K.O., Cha, Y.M. and Zhou, Y.Q. (2009) Changes in Means and Extreme Events of Temperature and Precipitation in the Asia-Pacific Network Region, 1955-2007. International Journal of Climatology, 29, 1906-1925.
http://onlinelibrary.wiley.com/doi/10.1002/joc.1979/epdf
http://dx.doi.org/10.1002/joc.1979 - 7. Haylock, M.R. and Goodess, C.M. (2004) Inter-Annual Variability of European Extreme Winter Rainfall and Links with Mean Large-Scale Circulation. International Journal of Climatology, 24, 759-776.
http://onlinelibrary.wiley.com/doi/10.1002/joc.1033/pdf
http://dx.doi.org/10.1002/joc.1033 - 8. Hundecha, Y. and Bardossy, A. (2005) Trends in Daily Precipitation and Temperature Extremes across Western Germany in the Second Half of the 20th Century. International Journal of Climatology, 25, 1189-1202.
http://onlinelibrary.wiley.com/doi/10.1002/joc.1182/pdf - 9. Moberg, A. and Jones, P.D. (2005) Trends in Indices for Extremes in Daily Temperature and Precipitation in Central and Western Europe, 1901-99. International Journal of Climatology, 25, 1149-1171.
http://onlinelibrary.wiley.com/doi/10.1002/joc.1163/pdf
http://dx.doi.org/10.1002/joc.1163 - 10. New, M., Hewitson, B., Stephenson, D.B., Tsiga, A., Kruger, A., Manhique, A., Gomez, B., Coelho, C.A.S., Masisi, D.N., Kululanga, E., Mbambalala, E., Adesina, F., Saleh, H., Kanyanga, J., Adosi, J., Bulane, L., Fortunata, L., Mdoka, M.L. and Lajoie, R. (2006) Evidence of Trends in Daily Climate Extremes over Southern and West Africa. Journal of Geophysical Research: Atmospheres, 111.
http://onlinelibrary.wiley.com/doi/10.1029/2005JD006289/full
http://dx.doi.org/10.1029/2005JD006289 - 11. Osborn, T.J., Hulme, M., Jones, P.D. and Basnett, T.A. (2000) Observed Trends in the Daily Intensity of United Kingdom Precipitation. International Journal of Climatology, 20, 347-364.
http://onlinelibrary.wiley.com/doi/10.1002/(SICI)1097-0088(20000330)20:4%3C347::AID-JOC475%3E3.0.CO;2-C/epdf
http://dx.doi.org/10.1002/(SICI)1097-0088(20000330)20:4<347::AID-JOC475>3.0.CO;2-C - 12. Pal, I. and Al-Tabbaa, A. (2009) Trends in Seasonal Precipitation Extremes—An Indicator of “Climate Change” in Kerala, India. Journal of Hydrology, 367, 62-69.
http://www.sciencedirect.com/science/article/pii/S0022169409000067
http://dx.doi.org/10.1016/j.jhydrol.2008.12.025 - 13. Tank, A.M.G.K. and Konnen, G.P. (2003) Trends in Indices of Daily Temperature and Precipitation Extremes in Europe, 1946-99. Journal of Climate, 16, 3665-3680.
http://journals.ametsoc.org/doi/full/10.1175/1520-0442%282003%29016%3C3665%3ATIIODT%3E2.0.CO%3B2
http://dx.doi.org/10.1175/1520-0442(2003)016<3665:TIIODT>2.0.CO;2 - 14. Khalili, A. (1989) Three-Dimensional Analysis of a Range of Heating and Cooling Degree Days. Geographical Research Quarterly, 55. (In Persian)
- 15. Rahimzadeh, F., Asgari, A. and Fattahi, E. (2008) Variability of Extreme Temperature and Precipitation in Iran during Recent Decades. International Journal of Climatology, 29.
http://onlinelibrary.wiley.com/doi/10.1002/joc.1739/pdf - 16. Mohammadi, B. and Masoudian, A. (2010) Synoptic Analysis of Iran’s Extreme Precipitation Events, Case Study. Journal of Geography and Development, No. 19, 70-47. (In Persian)
- 17. Mohammadi, H., Fattahi, E., Shamsipour, A.A. and Akbari, M. (2012) Dynamical Analysis of Sudanic Low Systems in Relationships with Occurrence of Extreme Precipitation Events over Southwest Iran. Journal of Applied Researches in Geographic Sciences, No. 24, 7-24. (In Persian)
- 18. Jones, C. (2000) Occurrence of Extreme Precipitation Events in California and Relationships with the Madden-Julian Oscillation. Journal of Climate, 13, 3576-3587.
http://journals.ametsoc.org/doi/full/10.1175/1520-0442%282000%29013%3C3576%3AOOEPEI%3E2.0.CO%3B2
http://dx.doi.org/10.1175/1520-0442(2000)013<3576:OOEPEI>2.0.CO;2 - 19. Zhang, X., Hoff, W.D. and Mekis, E. (2001) Spatial and Temporal Characteristics of Heavy Precipitation Events over Canada. Journal of Climate, 14, 1923-1936.
http://journals.ametsoc.org/doi/full/10.1175/1520-0442%282001%29014%3C1923%3ASATCOH%3E2.0.CO%3B2
http://dx.doi.org/10.1175/1520-0442(2001)014<1923:SATCOH>2.0.CO;2 - 20. Dulière, V., Zhang, Y. and Salathé, E. (2010) Changes in 20th Century Extreme Temperature and Precipitation over the Western United States from Regional Climate Model Simulations and Observations. Climatic Change, 79, 224-232.
https://www.google.com/url?sa=t&rct=j&q=&esrc=s&source=web&cd=2&cad=rja&uact=8&ved=0ahUKEwjDob6xvoMA-hXE0xQKHQmmDPgQFggmMAE&url=http%3A%2F%2Fwww.atmos.washington.edu%2F~salathe%2Fpapers%2FDuliere_2013.pdf&usg=AFQjCNEE3KIdObWh8qb4FNUMgBYkUGLkhg&sig2=JNEfFR8VW3niNl1wtQNJEA - 21. Omidvar, K., Safarpour, F., Mahmoudabadi, M. and Olfati, S. (2010) Synoptic Analysis of the Effects of Cut-Off Low on the Occurrence of Extreme Precipitation Events over the Central and Southwest of Iran. Teacher of Human Sciences—Planning and Space Management Magazine, No. 4, 161-189. (In Persian)
- 22. Rahimi, D., Khoshhal, J. and Alizadeh, T. (2010) Synoptic-Statistical Analysis of Extreme Precipitation Events over Arid Regions of Iran (Case Study: Kerman Province). Journal of Geography and Regional Development, No. 14, 51-69. (In Persian)
- 23. Parandeh Khozani, A. and Lashkari, H. (2010) Synoptic Analysis of Extreme Precipitation Events over South Iran (Case Study: Rainfall Event during December 31, through January 4, 1985 in Dalki’s River Basin). Journal of Geography and Environmental Planning, No. 41, 123-136. (In Persian)
- 24. Azizi, G.H., Nayeri, M. and Samadi, Z. (2009) Synoptic Analysis of Heavy Precipitations in West Iran (Case Study: Rainfall Event during March 14-17, 2005). Quarterly Journal of Physical Geography, No. 4, 1-13. (In Persian)
- 25. Hamidianpour, M., Alijani, B. and Sadeghi, A. (2010) Identification of Synoptic Patterns for Extreme Rainfall Events over Northeast Iran. Journal of Geographic Studies for Arid Regions, No. 1, 1-16. (In Persian)
- 26. Kunkle, K.E., Easterling, D.R., Redmond, K. and Hubbard, K. (2003) Temporal Variations in Extreme Precipitation Events in the United States: 1895-2000. Geophysical Research Letters, 30, 1900.
http://onlinelibrary.wiley.com/doi/10.1029/2003GL018052/pdf
http://dx.doi.org/10.1029/2003gl018052 - 27. Kunkle, K.E. (2003) North American Trends in Extreme Precipitation. Natural Hazards, 29, 291-305.
http://link.springer.com/article/10.1023%2FA%3A1023694115864
http://dx.doi.org/10.1023/A:1023694115864 - 28. Madsen, T. and Figdor, E. (2007) Heavy Precipitation Processes in a Warmer Climate. Geophysical Research Letters, 25, 1431-1434.
http://onlinelibrary.wiley.com/doi/10.1029/98GL51099/epdf - 29. Hernandez, A.R., Balling, R.C. and Barbara-Martinez, L.R. (2009) Comparative Analysis of Indices of Extreme Rainfall Events: Variations and Trend from Southern Mexico. Atmósfera, 22, 219-228.
http://www.scielo.org.mx/scielo.php?script=sci_arttext&pid=S0187-62362009000200006 - 30. Rodrigo, F.S. and Trigo, R.M. (2007) Trends in Daily Rainfall in the Iberian Peninsula from 1951 to 2002. International Journal of Climatology, 27, 513-529.
http://onlinelibrary.wiley.com/doi/10.1002/joc.1409/epdf
http://dx.doi.org/10.1002/joc.1409 - 31. Costa, A.C. and Soares, A. (2008) Trends in Extreme Precipitation Indices Derived from a Daily Rainfall Database for the South of Portugal. International Journal of Climatology, 29, 1956-1975.
http://onlinelibrary.wiley.com/doi/10.1002/joc.1834/epdf - 32. Alizadeh, A. (2005) Principle of Applied Hydrology. Ferdowsi University of Mashhad Press, Mashhad, 815. (In Persian)
- 33. Kalnay, E., Kanamitsu, M., Kistler, R., Collins, W., Deaven, D., Gandin, L., Iredell, M., Saha, S., White, G., Woollen, J., Zhu, Y., Chelliah, M., Ebisuzaki, W., Higgins, W., Janowiak, J., Mo, K.C., Ropelewski, C., Wang, J., Leetmaa, A., Reynolds, R., Jenne, R. and Joseph, D. (1996) The NCEP/NCAR 40-Year Reanalysis Project. Bulletin of the American Meteorological Society, 77, 437-447.
http://journals.ametsoc.org/doi/pdf/10.1175/1520-0477%281996%29077%3C0437%3ATNYRP%3E2.0.CO%3B2
http://dx.doi.org/10.1175/1520-0477(1996)077<0437:TNYRP>2.0.CO;2 - 34. Dotty, B. (1996) The Grid Analysis and Display System (Grads). V1.5.1.12, 145 p.
ftp://www.funceme.br/modelagem/echam46/mar2013-2/GrADS_doc_1_5_1.pdf
NOTES

*Corresponding author.