American Journal of Climate Change
Vol.2 No.4(2013), Article ID:40447,6 pages DOI:10.4236/ajcc.2013.24022
Modelling Weather and Climate Related Fire Risk in Africa
1Departamento de Engenharia Agrícola, Universidade Federal de Viçosa, Viçosa, Brazil
2Department of Geosciences, University of Oslo, Oslo, Norway
3Department of Earth and Planetary Sciences, Johns Hopkins University, Baltimore, USA
4The Adbus Salam International Centre for Theoretical Physics, Trieste, Italy
5National Institute of Space Research, S. J. Campos, Brazil
Email: fjustino@ufv.br
Copyright © 2013 Flávio Justino et al. This is an open access article distributed under the Creative Commons Attribution License, which permits unrestricted use, distribution, and reproduction in any medium, provided the original work is properly cited.
Received July 3, 2013; revised August 6, 2013; accepted September 3, 2013
Keywords: Climate Changes; Soybeans; Maize; Amazon
ABSTRACT
Based on regional climate model simulations conducted with RegCM3 and NCEP Reanalyses, the impact of anomalous climate forcing on environmental vulnerability to wildfire occurrence in Africa is analyzed by applying the Potential Fire Index (PFI). Three different model-based vegetation distributions were analyzed for a present day simulation (1980-2000) and for the end of the twenty-first century (2080-2100). It was demonstrated that under current climate and vegetation conditions the PFI is able to reproduce the principal fire risk areas which are concentrated in the Sahelian region from December to March, and in subtropical Africa from July to October. Predicted future changes in vegetation lead to substantial modifications in magnitude of the PFI, particularly for the southern and subtropical region of Africa. The impact of climate changes other than through vegetation, was found to induce more moderate changes in the fire risk, and increase the area vulnerable to fire occurrence in particular in sub-Saharan. The PFI reproduces areas with high fire activity, indicating that this index is a useful tool for forecasting fire occurrence worldwide, because it is based on regionally dependent vegetation and climate factors.
1. Introduction
Vegetation fires are extensive in Africa, and any changes in the risk of fires in a changing climate will have important impacts on societies in several African countries. Burning of biomass plays an important role in global emissions of carbon and other trace gases [1,2]. Vegetation fires on a global scale are the second largest anthropogenic source of greenhouse gas emissions [3]. Reference [4] reported that the amount of carbon dioxide release from Indonesian fires in 1997 and 1998, which was equivalent to 25% of total CO2 emissions resultant from combustion of fossil fuels worldwide.
As discussed by [5], Africa is a continent highly prone to lightning storms and fire distribution is associated with both dry and wet periods. In the past two million years, lightning was the primary ignition source of fires in the Africa savannas, however, at present humans are playing a more important role in starting fires [6]. In this sense, in the year 2000 the most extensively burned areas were located in sub-Saharan Africa with the total area burned estimated at 959,480 km2 [7].
Based on satellite data [8] demonstrated that in northern hemisphere Africa between 2001 and 2004, over 106 km2 burned. It should be noted that the total burned area during this period in the Northern and Southern Hemisphere Africa represents 70% of the total area burned globally. Nevertheless, due to the coarse resolution of satellite detected-fire and scarcity of spatial distribution, a systematic evaluation of long term interannual variability of fire and burned area remain a matter of discussion. However, based on modeling results [9] claim that, by the year 2060 Africa may experience a strong decrease of burned area of ca. 20% - 25%. This is attributed to be linked to changes in social conditions and land use. There is a lively debate on the importance of anthropogenic and climate factors contributing to the ignition of vegetation fires [e.g. 10]. Under current condition, [11,12] found the best agreement between simulation and observations for the fire by explicitly considering human caused ignition and fire suppression as a function of population density [12], however, based on temperature, precipitation, relative humidity, lightning activity, land cover and population density datasets, argued that future climate conditions will play the major role in driving global fire trends, overcoming the human effect on fire ignition. It has also been demonstrated that increased surface soil moisture conditions limit the extent of burned area [9,13].
Fire occurrence is determined by factors which start the combustion reaction and that allows its continuation depending on the potential energy stored in the combustible material [e.g. 14-17]. It has also been demonstrated that changes induced in biome distribution may also alter atmospheric/landscape susceptibility to fire occurrence [18,19]. Reference [20] argued that the clearing of tropical savannas increases temperatures and wind speeds while reducing precipitation and relative humidity. This is a situation which may occur in a climate influenced by anthropogenic factors and may substantially increase fire frequency.
Despite the relevance of vegetation fires in determining global vegetation patterns and the atmospheric concentration of greenhouse gases [4,15,21], there is a lack of systematic investigations focusing on future fire risk in Africa based on models which include interaction between climatic variables and vegetation patterns. Africa is subject to a majority of number of fires detected globally (50% of all detected) mainly occurring in savanna regions [9,22].
Distinct changes in vegetation patterns associated to future climate changes have been found to increase potential free activity [2,23,24]. Using the Potential Fire Index (PFI), [18] found that under greenhouse warming conditions the PFI indicates an increase in the fire risk area, particularly for the Amazon region. Model-based investigations have also been conducted to understand the interaction between fire, the CO2 fertilization effect and Earth’s ecosystems and dominant plant communities [e.g. 2,15,25].
It should be noted that these more advanced methods based on process-based fire regime models coupled with ecosystem dynamics models [e.g. 15,26] have been successfully used to investigate the spatial and temporal evolution of fires, and their interaction with vegetation dynamics. Several parameters are used for simulating fire processes involving soil characteristics, carbon allocation, fuel loads and the moisture content of litter. One limitation of using these complex models is the need for several parameters that must be included to simulate the link between fire and ecosystem dynamics [15]. Reference [27] argued that these models may also include a considerable level of uncertainties due to difficulties in properly simulating the fuel biomass and plant competition.
This study aims to investigate how changes in climate and vegetation impact the risk of fire in Africa (vulnerability of a region to fire initiation). The method proposed here to investigate climate and vegetation factors which may induce wildfire, is built on the Potential Fire Index (PFI), in a simpler approach than estimating fires in e.g. by using dynamic global vegetation models (DGVMs) [e.g. 15,28]. This is carried out through climate simulations using the RegCM3 climate model associated with three vegetation biome distributions derived from the present day (1980-2000) and global warming induced climate (2080-2100). Moreover, the PFI methodology provides the possibility of calculation of fire risk as a result of computation of equations which are function of four parameters only, allowing for calculation of fire risk on regional and local basis. It must be noted that the ignition of fires is not taken into account, so that the risk is only potential in this respect.
2. Data and Methodology
2.1. Climate Data
The African climate is affected by regional and global climate processes [e.g. 29-31] which involves the interaction between sea surface temperatures [32,33], vegetation/land cover and soil moisture [34].
To evaluate the fire risk in Africa climate data provided by ENSEMBLES Regional climate models and future projections were utilized [35]. We have used results from an experiment with the RegCM3 which was integrated in a continuous transient scenario simulation for a 120-year period from 1980-2100 [35]. RegCM3 is a 3-dimensional, sigma-coordinate, primitive equation regional climate model. Initial and 6-hourly lateral boundary conditions and SSTs necessary to run the model were obtained from a corresponding simulation with the ECHAM5 AOGCM (European Centre Hamburg Model— Atmosphere Ocean Global Climate Model) [36]. The experiment was based on the SRESAIB scenario (Special Report on Emission Scenario A1B) [37].
As demonstrated by [35,38], analysis of the present day period (PD, 1980-2000) shows that the regional model is able to capture the basic climate characteristics of the African continent. For instance, the main African circulation such as tropical jet streams, monsoon flows and the mid-tropospheric African easterly jet (AEJ) stream are well reproduced, although the model has a tendency to produce a weaker AEJ. The position and strength of the core of the AEJ and monsoon flow are located correctly as well as the strength of the tropical easterly jet stream core and the height of the AEJ.
The December-January-February (DJF) maximum temperature bias is low and confined between ± 2 degrees except over the Sahara desert were the negative bias is slightly larger. Positive biases are mainly located over the tropical forest regions of the Congo Basin, in the southwestern coasts of the continent. JJA temperature biases are similar in magnitude to that of the DJF. Generally the cold bias is found in the central Sahara and a strong positive bias over the Southern Saudi Arabian peninsula. Over the rest of the continent the RegCM3 presents a more mixed distribution of positive (e.g. over the Congo Basin) and negative (e.g. over the Ethiopian Plateau) biases. The precipitation bias in DJF shows an area of negative bias extending in a southwestward direction from the Congo Basin to the southwestern African coast. A positive bias is found over eastern equatorial Africa and the southeastern African coast and a dry bias over the African monsoon region. An overestimation of precipitation is evident over the Ethiopian highlands. These biases do not exceed 2 mm/day during the rainy season.
We also use climate data from the RegCM3 for a future climate to access changes in fire risk. In this case, data for the period 2080-2100 have utilized in the A1B experiment described above. We denote this a Greenhouse Warming (GW) simulation.
2.2. Formulation of the Potential Fire Index (PFI)
The PFI is formulated on the principle that the vegetation fire risk increases with the increasing duration of dry periods. Type and natural cycle of vegetation phenology, maximum temperature and relative humidity of the air are also required to compute the PFI. The reference of the calculations is the Number of Dry Days or Days of Drought (DD), which is the number of days without precipitation during the proceeding 120 days [18].
For the PFI calculation, a set of parameterization equations applied for Brazil are utilized for Africa. It is briefly described below, and is presented in details by [18]. A set of modification are conducted, however, to compute the basic risk (BR) for the African vegetation types considered:
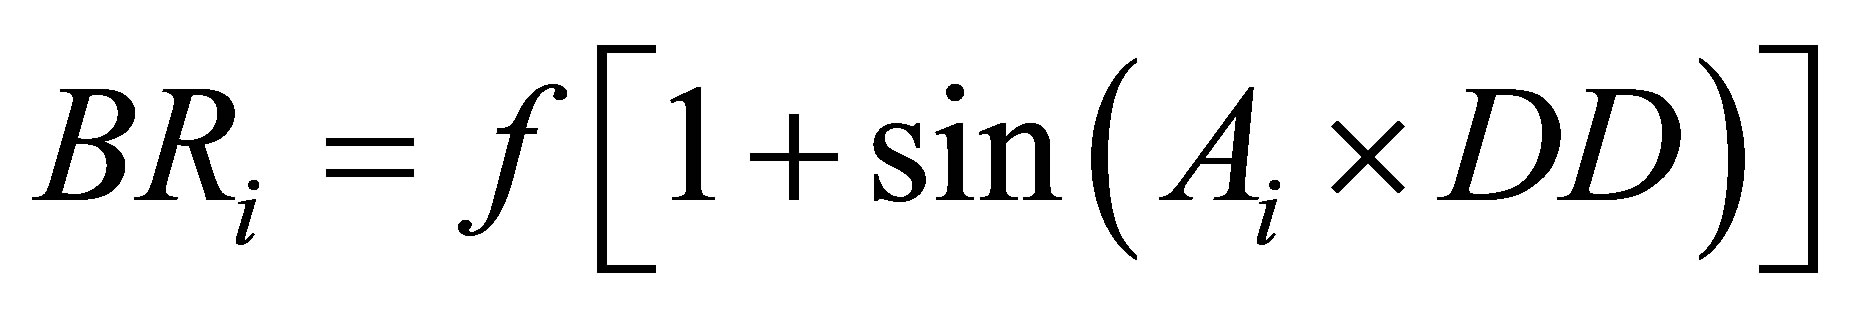 (1)
(1)
i = 1, 7, DD must be in radians. The 7 values of “A” vary as a function of vegetation flammability, and f = 0.45 and are given in Table 1. The resulting 7 values for BR are showing in Figure 1.
The A and f values are fitted based on 30 years of fire observation in Brazil from satellite. Specifically, the presence of fire has been taken in association with the amount of precipitation occurrence in the last 120 days in 11 discreet periods. Afterwards, empirical equations have been set to correlate the fire, the amount of precipitation (precipitation factor) and the vegetation type. The Basic
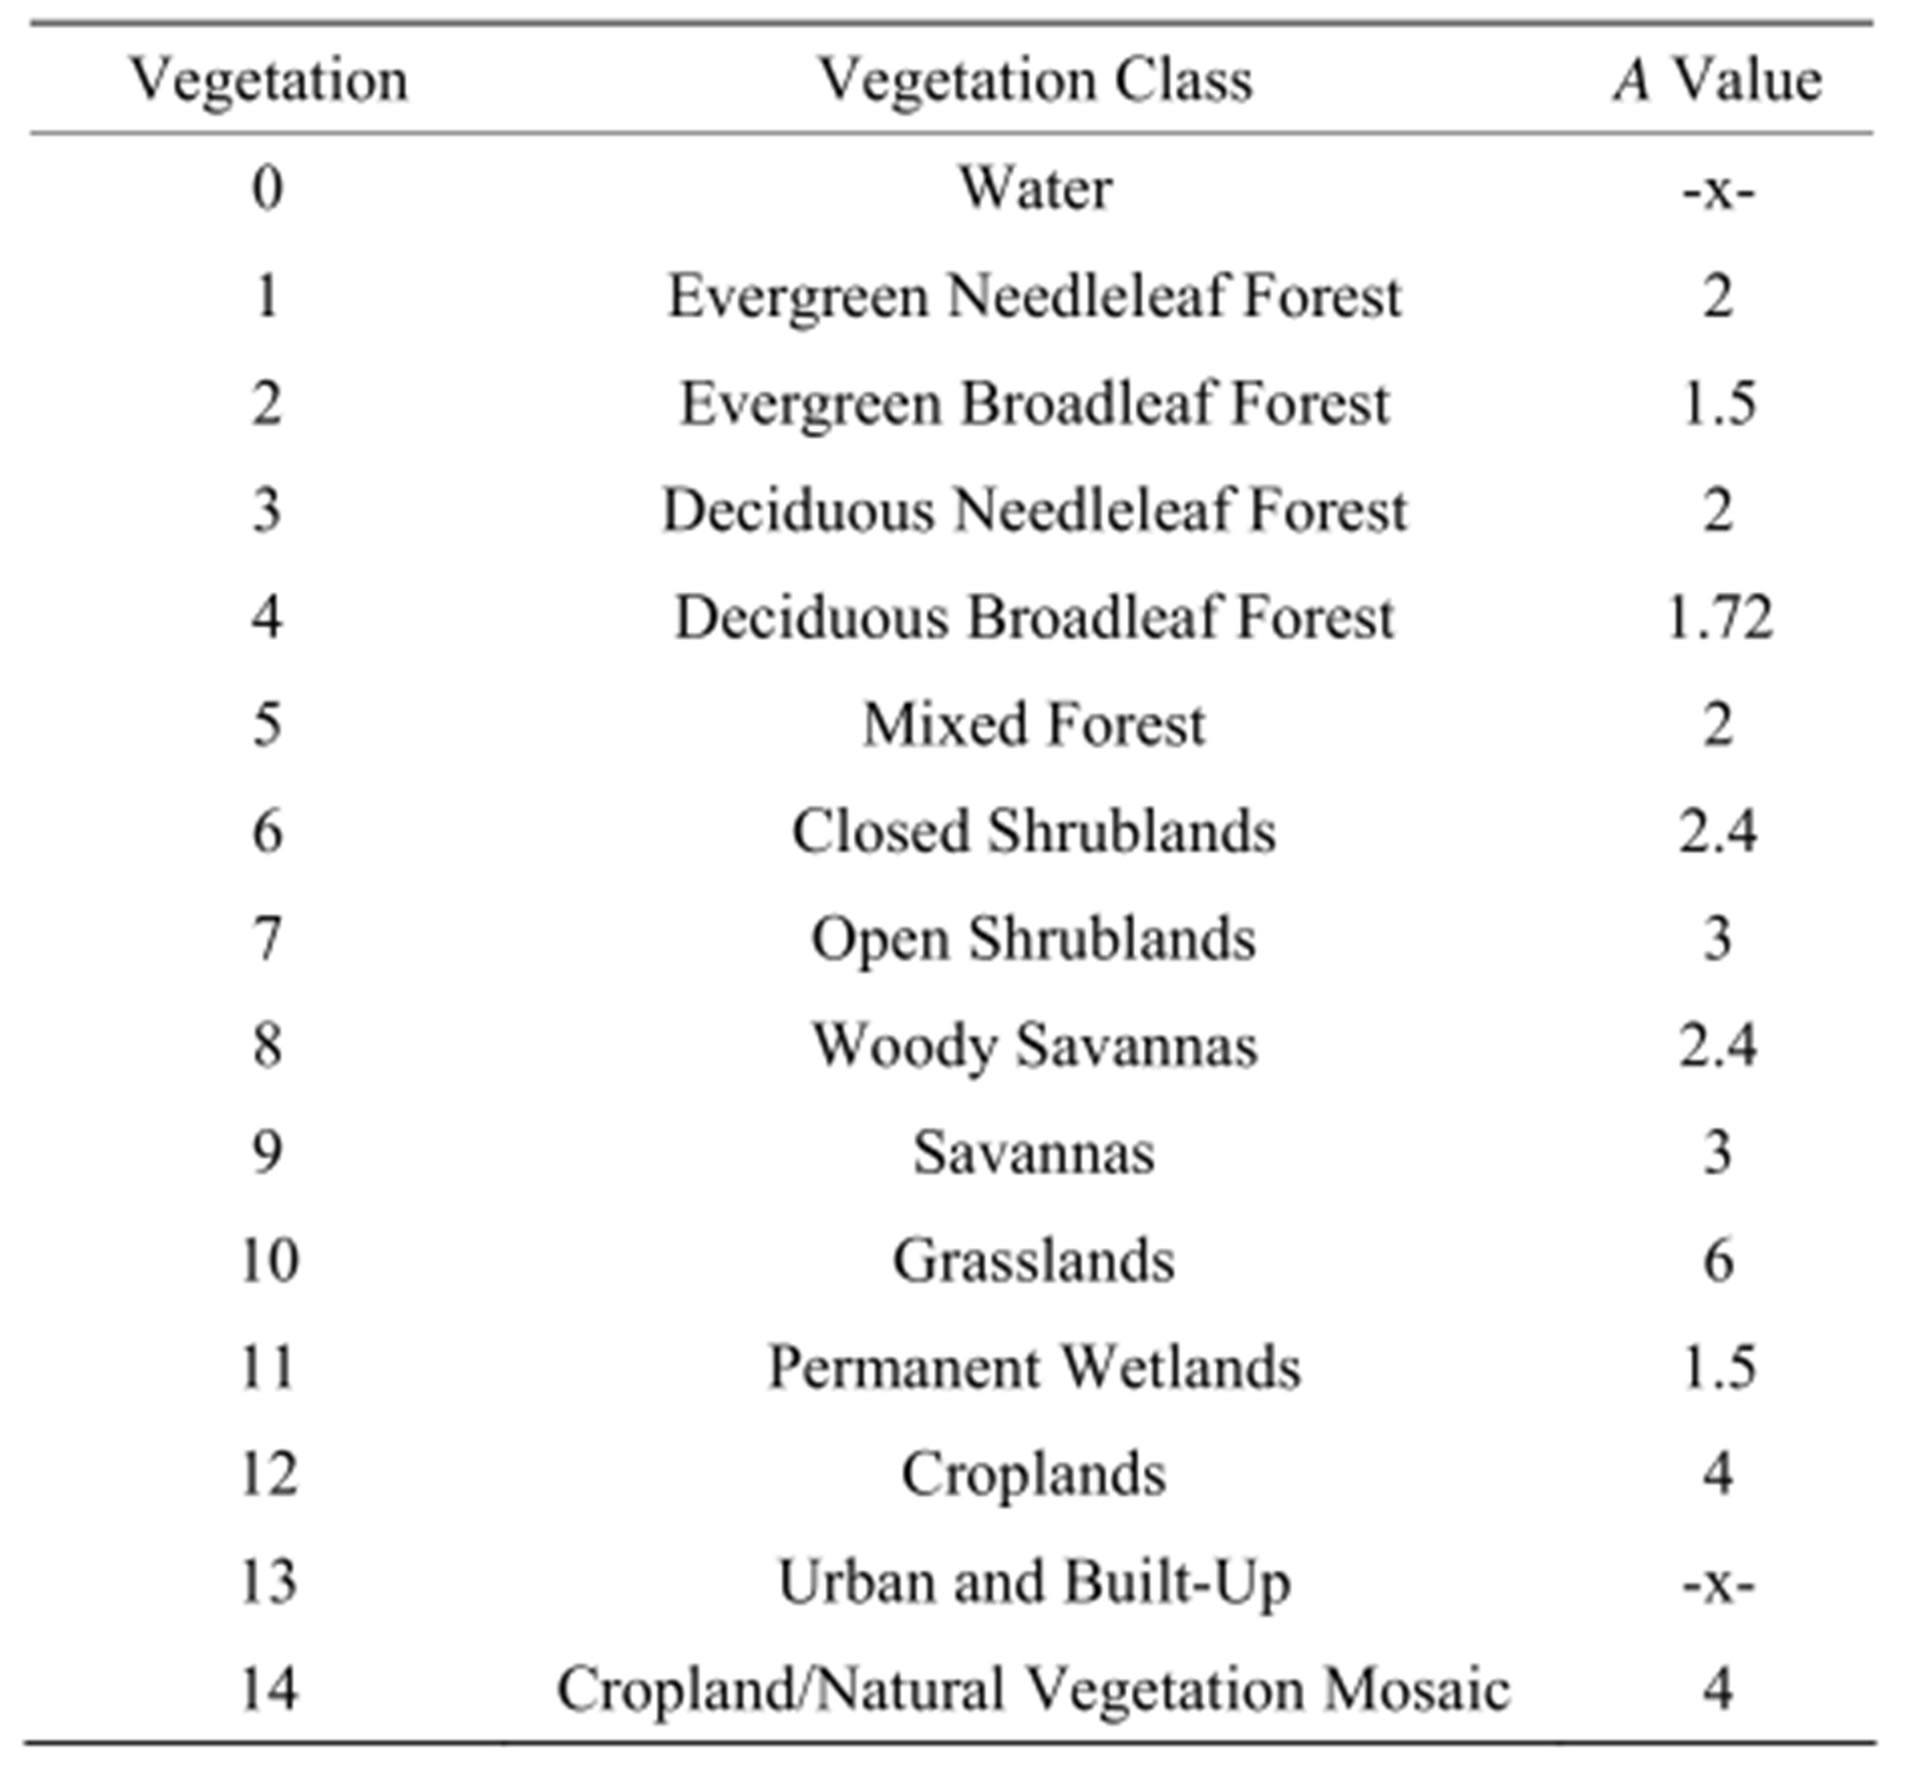
Table 1. Vegetation types and respectives A values used to define the basic risk (BR). African vegetation is in italic.
Risk (BR) increases as a sine curve over time. This pattern has been chosen because the variation of intensity and duration of sunlight along the year is also sinusoidal and phenology of vegetation naturally follows the same pace.
The “A” values may represent the amount of the combustible material during periods without precipitation or drought. In this sense the dense evergreen broadleaf forests attain “A” value of 15, savannas of 3 and cropland and grassland (4 and 6) which are more susceptible to fire. Figure 1(f) shows that 30 consecutive days without precipitation results in a BR maximum (0.9) assuming grassland. It important to note that soil moisture, which is tightly linked to the precipitation amount, and will increase leaf litter is not explicitly included in the parameterization.
Two other factors are considered for calculation of the potential fire risk (PFI): the minimum relative humidity and the maximum temperature of the air:
 (2)
(2)
where the values a = −0.006, b = 1.3, c = 0.02 and d = 0.4 are taken from [18]. RHmin is the minimum daily relative humidity and Tmax is the maximum daily temperature. It should be noted that the PFI is computed on daily basis but results presented here are shown based on the monthly average.
The PFI has been extensively used in South America and Cuba to evaluate the atmospheric susceptibility to fire development [39,40]. It has been demonstrated that among 290 thousand fires in the continent in 2003, 94% occurred in areas of high and critical risk (PFI) in the fire season.

Figure 1. Vegetation distribution simulated by CLM-DGVM driven by climate forcing from CCSM (left), HadCM3 (middle) and ECHAM (right) for pre-industrial conditions (a)-(c) and for greenhouse warming conditions (d)-(f) (Alo and Wang, 2008). See Table 1 for the biomes denomination, (g) Time evolution of the basic risk as a function of the days of drought.
It has been considered to derive new parameters for Africa but the ones derived for Brazil are shown to work well in Africa, which is reasonable as they are fitted in the tropics and subtropics. In fact, the main point here is that changes in vegetation types play a major role. It should be noted that the PFI parameterization as proposed here does not work properly for extra-tropical climates with different precipitation regimes and lower temperatures.
2.3. Vegetation Data
We base our vegetation data on the results from the study of [19] which used CLM-DGVM to derive vegetation distributions in equilibrium with climates of several global climate models. In this paper we use the results based on the CCSM, HadCM and ECHAM models. The CLMDGVM is composed of a land surface scheme CLM3.0, a phenology module, and biogeochemistry and vegetation dynamic modules based on CLM-DGVM [41]. Biogeophysical and biogeochemical processes are simulated with a 20-min time step while plant phenology is evaluated daily. Vegetation structure and distribution are updated yearly based on knowledge of the integrated processes for shorter time steps.
CLM-DGVM models 10 plant functional types (PFTs), namely, needleleaf evergreen temperate trees, needleleaf evergreen boreal trees, broadleaf evergreen tropical trees, broadleaf evergreen temperate trees, broadleaf deciduous tropical trees, broadleaf deciduous temperate trees, broadleaf deciduous boreal trees, C3 artic grasses, C3 nonartic grasses and C4 grasses. Up to 10 PFTs may coexist in each grid cell. The fractional coverage of the PFTs was used to assign the grid cells to the biome-type vegetation classes in Table 1 (following the biome types and associated PFTs) [42].
Pertaining to each of the three GCMs employed (i.e., CCSM, HadCM and ECHAM), control vegetation was simulated with CLM-DGVM driven by the present day mean climate (derived based on a 30-year period of model integration from the present day (PD) control GCM (CO2 concentration held at 275 ppm experiment), and simulated future vegetation with the vegetation model based on the 2100 mean climate data derived for the period 2071-2100 from the GCMs SRESA1B stabilization denoted as the global warming (GW) case. In this case CO2 concentration stabilizes at 720 ppm beyond 2100. In all the vegetation simulations, the CLM-DGVM was initiated considering bare ground and run for 200 years in order to attain vegetative equilibrium with the specified climate forcing (i.e., with respect to leaf area index (LAI) and vegetation coverage). A detailed description of the CLM-DGVM and vegetation simulations is given in [19].
3. Results and Discussion
3.1. Present Day Analysis
In order to investigate the impact of climate and vegetation changes on fire susceptibility in Africa, three evaluations were performed: the first is based on the present day (PD) climate (1980-2000) as predicted by the RegCM3 and simulated pre-industrial vegetation from [19] (Figures 1(a)-(c)). The second calculation uses results of the RegCM3 greenhouse warming simulation (GW simulation) and the greenhouse vegetation distribution (GW, Figures 1(d)-(f)). One should note that we have used equilibrium vegetation for both epochs. The third analysis was performed for future climate conditions (2080 to 2100) and disregarded changes in vegetation, using the current biome distribution.
In what follows the monthly evolution of the PFI as well as some related parameters are shown in Figure 2. It should be noted that the largest number of vegetation fires in Africa occurs between December and February (DJF) in the equatorial/Sahelian region (10˚N - 20˚N) and between August and October (ASO) in the subtropical region of the Southern Hemisphere [43,44]. Therefore, the analyses conducted herein are restricted to these months. Figure 3(a) shows the averaged daily maximum air temperature at 2 m averaged from December to February for the PD simulation (1980-2000). There are evidently higher temperatures along the equatorial belt and in subtropical Africa with values as high as 37˚C. Lower values are predominant in Northern Africa.
As expected, analyzes for relative humidity demonstrated that areas with high temperatures are also dominated by low relative humidity (Figure 3(b)). These conditions intuitively may favor intensified fire occurrence. However, climate conditions in accordance with the days of drought (DD) shed some light on the role of precipitation. For instance, the equatorial region (5˚N - 15˚N) exhibits larger DD values or long periods without rain (up to 1), whereas the sub-tropical region is dominated by small DD values which indicates frequent precipitation (Figure 3(c)).
The combination of these three factors (maximum temperature, relative humidity and days of drought) associated with the vegetation pattern allows for simulation of the potential fire risk (PFI). As shown in Figures 3(d)-(f), the atmospheric susceptibility to fire or higher PFI is located between 10˚N and 20˚N (Western Africa) in the area covered by non-forest, with high temperature and low relative humidity. Impact of the DD on the PFI is highlighted by the decreasing fire risk between 0 - 20˚S latitude. Despite high temperatures and moderate relative
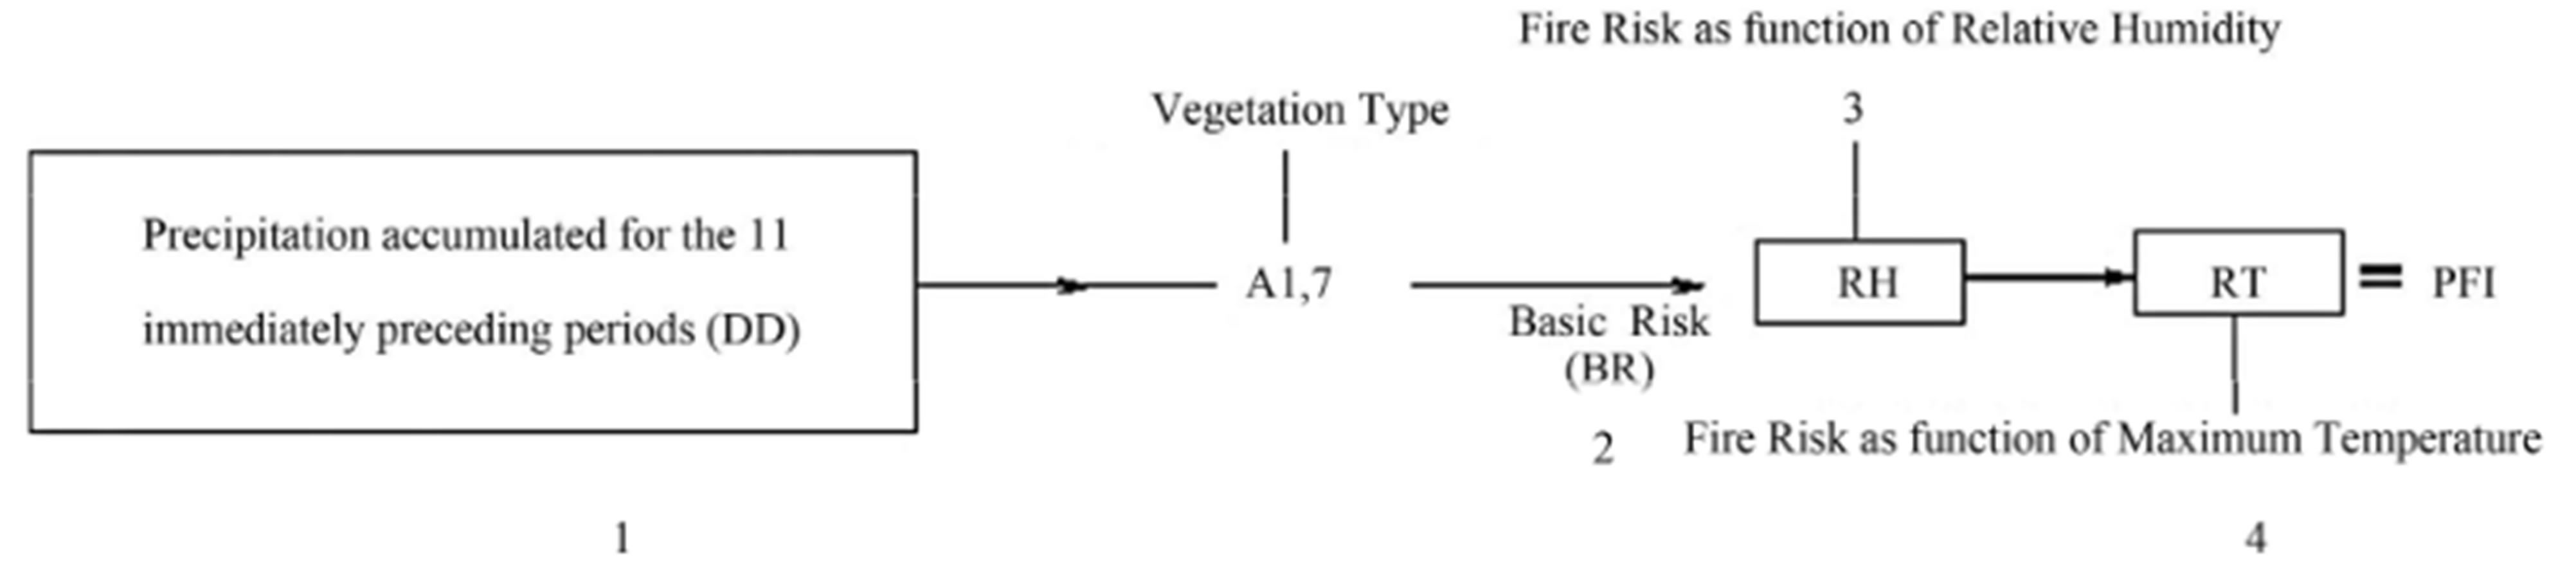
Figure 2. Flowchart presenting the sequence (as represented by numbers) of calculation for the PFI.

Figure 3. Present day maximum temperature ((a), ˚C), relative humidity ((b), %) and number of days of drought (c) averaged for December-January-February (DJF). (d), (c) and (f) is the potential fire index (PFI) based on CCSM, HadCM3 and ECHAM forced-vegetation. Figures from (g) to (m) are the same for NNR2.
humidity this region does not show high PFI due to the small DD which indicates frequent precipitation associated with the ITCZ. Furthermore, the dominant vegetation pattern in this region is evergreen or semi-evergreen forests, where the fuel consists of densely packed litter layers. It is interesting to note that the vegetation pattern based on by the CCSM, HadCM3 and ECHAM disagree on the Saharan desert extension but they do show similar biomes in central Africa. The CLM-DGVM forced by the CCSM and ECHAM simulates the African tropical forests more confined as compared to the simulation with the HadCM3 forcing (Figures 1(a)-(c)).
Because the PFI is based on RegCM3 model data, it is important to identify possible model biases in the predicted present-day maximum temperature, relative humidity and days of drought, and consequently in the PFI as represented by RegCM3. This is done by comparing the modeled data and the daily NCEP Reanalyses 2 (NNR2) for the period of 1980-2000 [45]. Figures 3(a)- (I) demonstrated that the two datasets, the RegCM3 and NNR2 yield many similarities, particularly in the Sahelian region and southern Africa (10˚N and 10˚S, Figures 1(a)-(c) and (g)-(i)).
Regarding to evaluation of the PFI, it may be noted that the NNR2 exhibits higher PFI as compared to the modeled output, over the Sahelian region due to lower DD values and higher (lower) air temperature (relative humidity). Differences between the two datasets are also identified in the southern part of Africa where the NNR2 shows higher PFI is linked to the DD values or long periods without precipitations. In general, the PFI shows many similarities in both datasets.
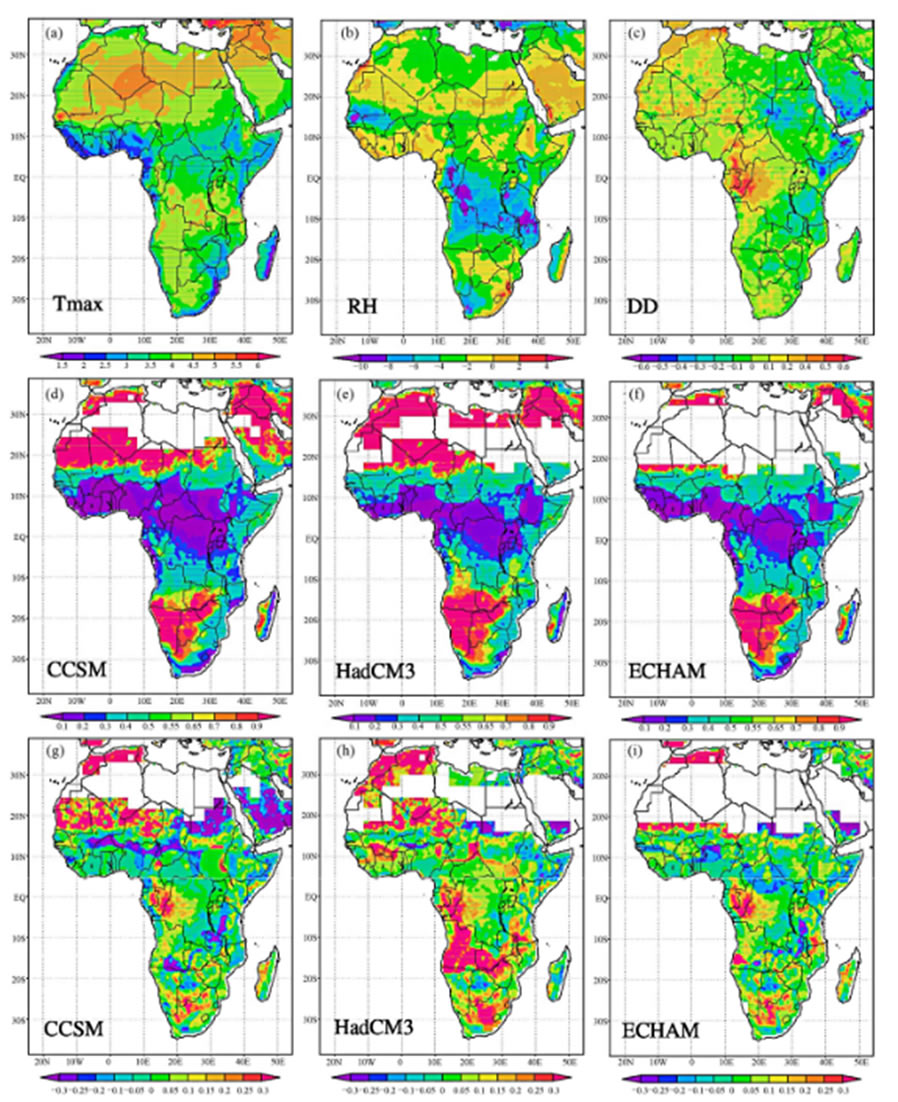
Vegetation fires primarily follow seasonal climate shifts [e.g. 10,46,47]. During ASO (August-September-October) maximum temperature values are observed in the Saharan region accompanied by lower relative humidity. Contrary to DJF climate features, ASO exhibits moderate temperatures and higher relative humidity along the equatorial belt (Figures 4(a)-(c)). Influence of the ITCZ is noted by the extremely low value of DD which extends from 10˚N to 5˚S.
A second interval with substantial fire activity in Africa is in agreement with the onset of the dry season due to the northward displacement of the ITCZ, which is located in the Northern Hemisphere. During ASO, the highest PFI occurs in Central and Southern Africa, which include Angola, Zambia, Zimbawe, Namibia and Botswana, due to high Tmax, low RH and critical DD (Figure 4), whereas Malawi and central Africa, for instance, have relatively low PFI magnitudes. Higher PFI in parts of the African continent is associated with the dominance of deciduous forest-woodland savanna and brush-grass savanna. According to the formulation of the PFI these biomes are associated with increased susceptibility to fire activity due to the vulnerability of drought-induced fuel properties. Comparison with the climate variables and PFI provided by the NNR2 (Figures 4(g)-(i)), shows a reasonable agreement for maximum temperature, relative humidity and days of drought over the vast majority of Africa. Some discrepancies may be found in southern Africa. In this region the PFI attains critical values in the NNR2 model that extends for a larger area, whereas in the RegCM3 the critical PFI is confined in particular to the western part (Figures 4(c), (d) and (j)-(m)).
Comparison with previous results based on models with higher complexity [e.g. 11,15], reveals that the PFI is able to reproduce areas dominated by frequent fire activity (see Figure 1 in [15]). According to [15], moderate fire activity is shown in central Africa, whereas the highest fire incidence is located in the Sahel and southern Africa, similar to the results proposed in the present study. It should be noted that [11] shows present time averaged data.
In order to further validate the PFI, Figure 5 shows the satellite based hot spots/fires from the World Fire Atlas. This data forms a unique long time series of global fire location and timing (http://dup.esrin.esa.int/ionia/wfa/index.asp), and may be compared with satellite data obtained from MODIS [43, 44], http://rapidfire.sci.gsfc.nasa.gov/firen. This may be used to represent fire activity during DJF and ASO because fire is detected with brightness temperature higher than 308 K. Figure 5 includes all fire activity during DJF and ASO detected in 2004 and 2008. The year 2004 was characterized by a weak El Niño and 2008 experienced a recovery from La Niña conditions which may provide a range of climate-induced vegetation fires. It should be noted that the spatial resolution of the RegCM3 model (40 km) makes it difficult to compare the PFI with small scale observed hot spots. By showing hot spots it is only intended to give the preferential location of fire occurrence in Africa, to provide inferences about the validity of the presented PFI.
One may argue that there is no substantial inter-annual modification in the climate-driven preferable area of fire incidence, since distribution of savannas, shrubland and grasslands must be sufficiently dry to ignite (Figure 5). Since this study aims to identify areas with fire risk the comparison of the PFI with hot spots is a reasonable assumption. The close correspondence between higher PFI (0.7 - 0.9) and the detected fires is remarkable. One should keep in mind, however, that the presented PFI is smoothened by utilizing the seasonal average contrary to what is shown for fires which accumulates on a daily basis.
The satellite-based wildfires reveal the high number of fires in the Sahelian region which are more recurrent in DJF, and in the subtropical region of Africa which mostly
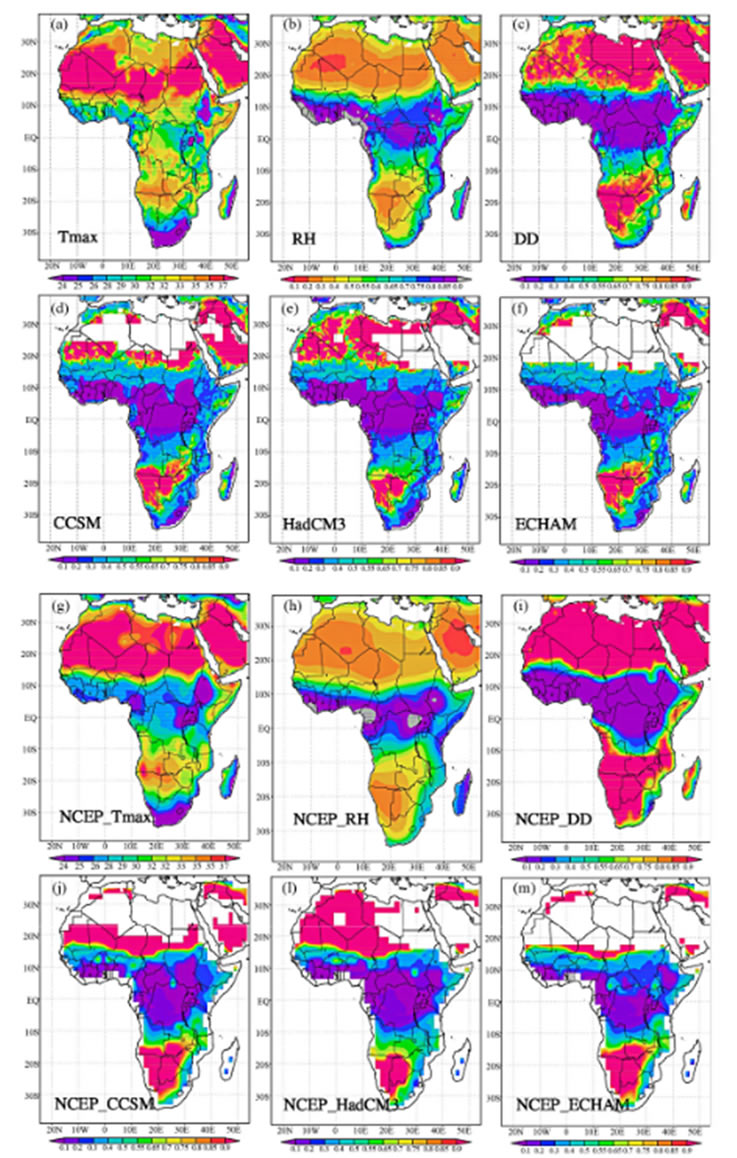
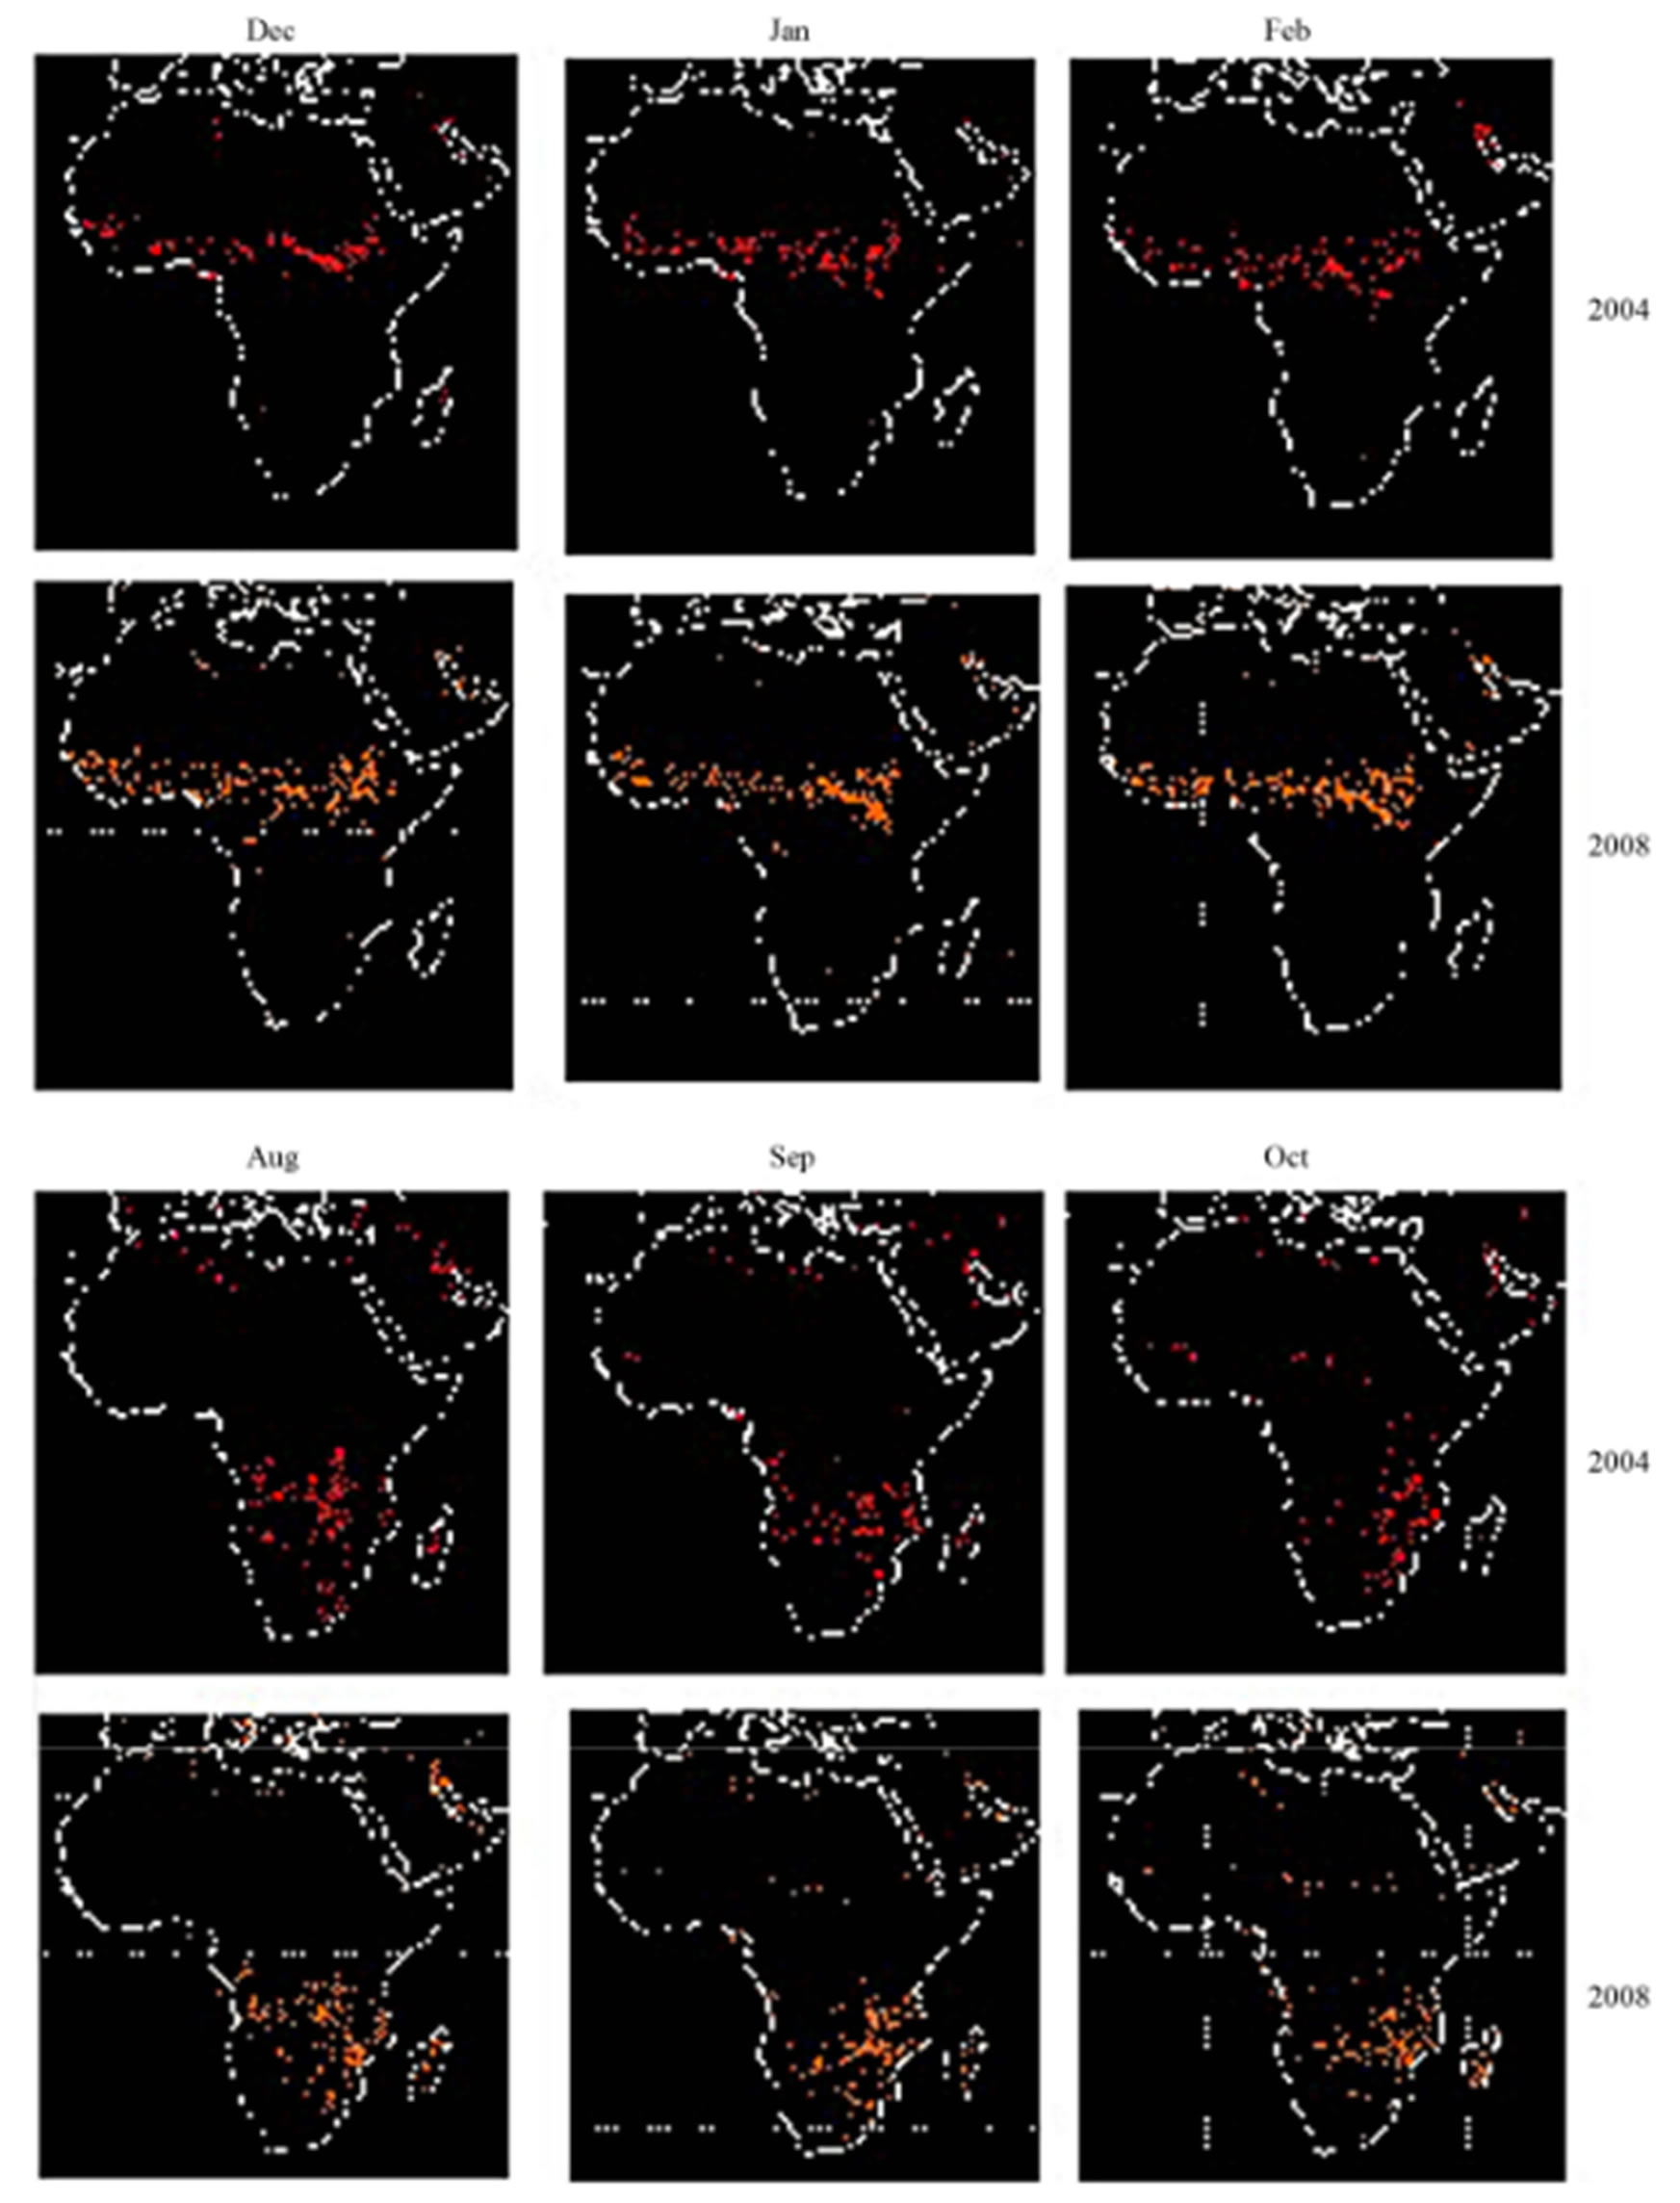
Figure 5. Satellite-detected hot spots with brightness temperature higher than 308 K in the years 2004 and 2008 during December-January-February and August-September-October. Source: http://dup.esrin.esa.int/ionia/sfa/index.asp.
occur during ASO on the west and east coasts. Fires occuring on the east coast are not entirely supported by the PFI since these countries show low PFI, except in Madagascar where the PFI is reasonable. Similarly, fires identified in South Africa are in areas dominated by high PFI in particular based on the NNR2 results. The high agreement between the fire index and the satellite-based fires in Angola, Zambia, Zimbabwe and Namibia may be stressed.
It should be emphasized that anthropogenic factors contribute to the discrepancy between the PFI and active fire observations. For example, in Namibia the climatic conditions (and PFI) appear conducive to biomass burning. However, the active fire observations are quite sparse which may be due to low fuel loads (i.e. that is unable to sustain a fire under real conditions). Secondly, this area is sparsely populated and may be affected with less anthropogenic burning. Reference [48] found relationships between precipitation (drought extent) to be weakly correlated with active fire observations over parts of Africa, suggesting that other factors (such as land management and precipitation quantity in the proceeding wet season) may play an important role. It should be noted that despite these drawbacks, the PFI is able to reproduce the most susceptible area for vegetation fire development in response to climate (Figures 4(d)-(g)). Results presented here are very similar in terms of area with high PFI with those discussed in [9,12]. It should be noted however that [9] focused on fraction of area burned.
In relation to natural and anthropogenic fire occurrence based on climatic factors, the PFI indicates risk and vulnerability to erratic fire. It is crucial to assess the potential for fire development in order to avoid the occurrence of erratic wildfires which may cause substantial changes to the plant community, animal habitats and human health. The PFI methodology has been successfully applied in Brazil by political and economic decision markers in order to reduce hazards.
3.2. Greenhouse Warming Analyzes
In the following section the PFI response to climate and vegetation changes is evaluated. As previously discussed, forcing the vegetation model with outputs based on ECHAM, HadCM3 and CCSM model leads to a reduction in the evergreen forest and enlargement of savannas by the end of the 21st Century. The most pronounced changes occur when the vegetation model is forced with HadCM3 input data (Figure 1(e)).
These modifications play an important role in defining the fire risk level by increasing the basic potential risk (BR, Equation (1)). Figures 6(a)-(c) show the climate anomalies between the GW and PD experiments for averaged maximum temperature, relative humidity and days of drought for DJF. Positive Tmax anomalies of 5˚ Celsius (C)
are evident in southern Africa and along 10˚N. This region also exhibits lower relative humidity by up to 10%.
It is interesting to observe that no remarkable changes are predicted to occur in terms of the periods of dry days. Comparison between the current and simulated number of drought days (DD) in the GW simulation in general shows values ± 0.1. This demonstrates that in the RegCM3 the daily frequency of precipitation is not as distinct as could be expected between the two climate regimes. These results agree with previous investigations for the southern Africa continent [49-51]. It might be noted, however, that parts of equatorial Africa in the GW simulation experiences lower DD as compared to the PD simulation. In this region the number of dry days was already quite low in the PD. It should be stressed that close to the south coast of Mozambique there is presently a low number of dry days, but this is predicted to increase substantially in future scenarios (Figure 6(c)).
Figures 6(d)-(f) illustrate the fire risk (PFI) in response to future climate changes. Throughout the African continent the PFI increases as a result of simulated warmer climate expected for the end of the 21st Century. During DJF the dominant area of high susceptibility to wild-fire activity is the Sahelian region, which corroborates with present day analyzes (Figures 6(d)-(f)). Small changes are predicted to occur in the central part of Africa despite a shrinkage in the area covered by evergreen forests (Figures 1(d)-(f)). This feature is reasonable since the DD plays a leading role in defining the fire risk, as expressed by Equation (1) (Figure 6(c)). As previously shown DD does not experiences large changes between the two epochs. The PFI in DJF shows an additional region with high vulnerability to wildfire located between 10 - 30˚S (Figures 6(d)-(f)). This has not been identified under current conditions (PD simulation). This feature is closely linked to positive (negative) air temperature (relative humidity) anomalies (Figures 6(a) and (b)).
However, the role of vegetation clearly stands out when comparing the PFI anomalies between PD and GW simulation (Figures 6(g)-(i)). Since the HadCM3 forcing leads to the most severe changes in vegetation (Figure 1(b)), the corresponding PFI configuration is also associated with larger values as compared to anomalies resulting from the ECHAM and CCSM. The effect of climate change, however, reduces the fire risk in areas which experience increasingly more frequent precipitation such as the majority of equatorial Africa (0 - 10˚S). For instance, Sudan which exhibits substantial number of fires under PD conditions is expected to show a decrease in the future.
Regarding evaluation of the PFI in ASO (August-September-October) (Figure 7), more favorable climate conditions for vegetation fire occurrence can be observed. Under PD conditions the most susceptible region for fire
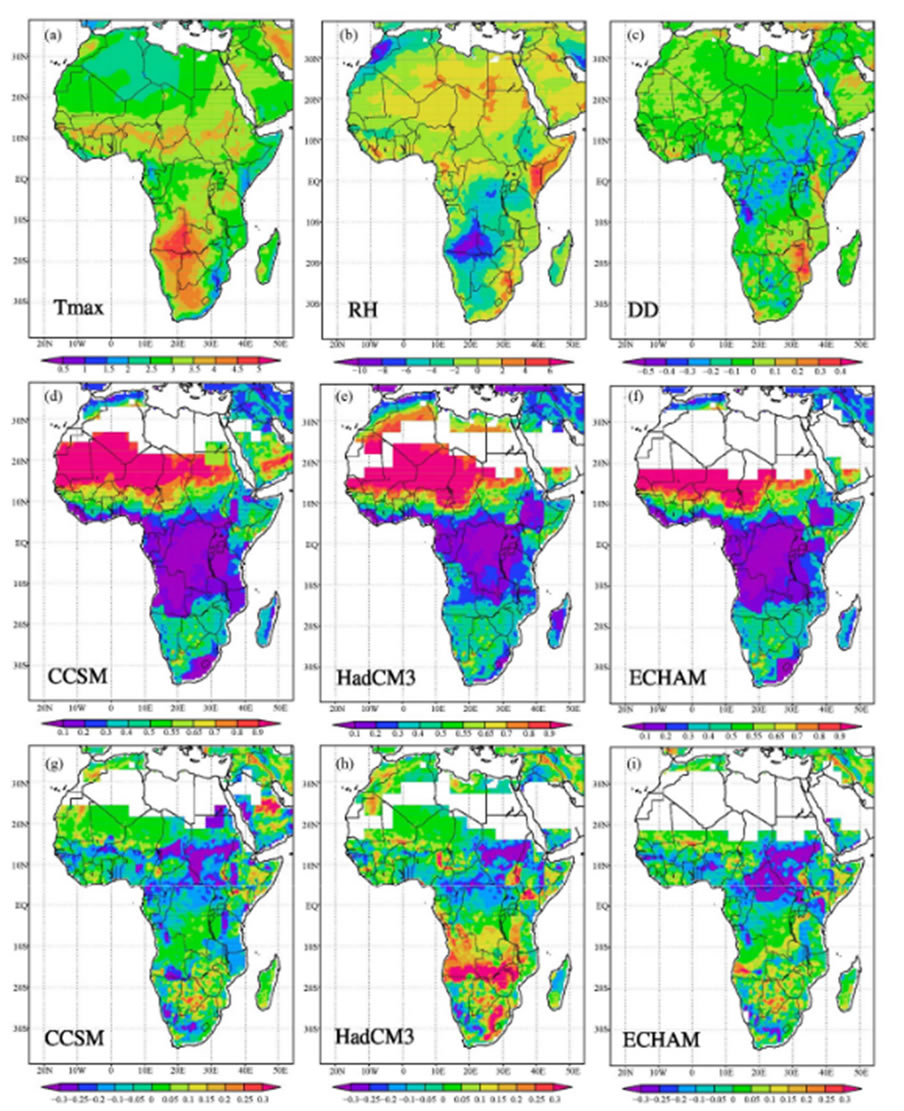
Figure 6. Greenhouse warming anomalies as compared to present Day in DJF. Maximum temperature ((a), ˚C), relative humidity ((b), %) and days of drought (c). (d)-(f) show the PFI estimated from the greenhouse warming simulation based on CCSM, HadCM3 and ECHAM forced-vegetation. (g)-(i) show the PFI anomalies between greenhouse warming and present day simulation.
development is found in southern Africa (Figures 4(d)- (f)). In the GW simulation there exists an enlargement of this region as well as high fire risk between 10 - 20˚N and on the Island of Madagascar (Figures 6(g)-(i)). These results are similar to those found by [12] (their Figure 3) who found increased (reduced) projected fire activities in Sahel, East Africa and South Africa (Central Africa). Fire risk is expected to increase also on the west coast from the equator to 20˚S. This is more evident in the HadCM3 case (Figure 6(h)).
To further evaluate the fire risk in Africa, Figure 8 shows the zonally averaged PFI computed at latitude belts between 5˚N - 20˚N, 10˚S - 5˚N, 25˚S - 10˚S and 40˚S - 25˚S throughout the year. This aids in identifying changes in the amplitude of the seasonal cycle under both climate regimes and in determining the individual month with the highest fire risk. According to the figure, the region confined between 10˚S - 20˚N shows higher PFI in March and gradually attains its minimum fire risk in November (Figures 8(a) and (b)). This is closely linked with the meridional migration of the ITCZ and its associated precipitation over the region. In this region there is an increase in the fire risk in 10 out of 12 months when future climate and vegetation conditions are applied. Vegetation distribution as predicted based on HadCM3 leads to the highest values of the PFI. It should be noted, however, that under current conditions the PFI associated with the HadCM3 model attains the smallest value.
A similar evaluation for the region between 40˚S - 10˚S shows that, in comparison to current conditions, the fire risk in the future increases substantially and it is high from July to October, especially between 25˚S - 10˚S (Figure 8(c)). Under PD conditions this is critical in September only. This suggests that an increase in the length of the fire season in sub-Saharan Africa is likely in the future. The same is also predicted in the Amazon region [18,52]. Moreover, in subtropical Africa (Figure 8(d)), the PFI increases from low in the PD simulation to moderate in the GW simulation.
The interannual variability of the PFI as represented by the standard deviation (STD, not shown), for present day and greenhouse warming show that higher values of the STD are located in Sahel and in the southern part of Africa. Lower values of the STD are, however, found in the equatorial belt where the Congo forest has a moderate vulnerability to fire occurrence. These findings are common features in CCSM, HadCM3 and ECHAM based estimates.

Figure 8. Monthly zonally averaged current and future PFI for (a) 5˚N - 20˚N; (b) 10˚S - 5˚N; (c) 25˚S - 10˚S and (d) 40˚S - 25˚S.
It should be mentioned that the regions experiencing higher standard deviation are larger than those with maximum or critical PFI (Figures 6 and 7), which demonstrates the north-south shift of the PFI throughout the year. An interesting picture emerges by comparing present day and greenhouse warming simulations. For instance, the interannual variability is partially reduced in the Northern Hemisphere tropical region but increases in the Southern Hemisphere counterpart.
Therefore, one may argue that climate changes increase the area vulnerable to fire occurrence in particular in sub-Sahara. Previous studies have shown that substantial changes are predicted to occur in precipitation extremes [e.g. 53], in particular an increase in consecutive dry days.
The investigation of fire risk under GW climate conditions but with PD vegetation (figure not shown) yields PFI similar to those under present day conditions (Figures 3(c), (d), (f) and 4(c), (d), (f)). In this sense, taking into account a warmer and drier climate, as predicted to occur in the future, does not substantially change the fire risk. This reveals the dominant role of vegetation changes in determining environmental susceptibility to fire occurence.
4. Concluding Remarks
Despite advances in the understanding of climate and its link with fire activities, studies evaluating the association of climate variables with fire occurrence are still scarce, particularly for future climate scenarios. Based on the Potential Fire Index (PFI) computed from regional climate simulations performed by the RegCM3, this study evaluated the impacts of climate changes on vegetation and vegetation-fire risk in Africa under current and future global warming conditions. Changes in vegetation due to climate changes have been taken from the calculations by [19], who used a dynamic vegetation model (CLM-DVGM) to estimate vegetation distributions in the current and future climate.
It was herein demonstrated that the PFI was able to identify the principal fire risk areas which are concentrated in the Sahelian region from December to March, and in subtropical Africa from July to October. By applying three different vegetation distributions for current conditions and those proposed for a global warming scenario, it was found that the future PFI is extremely sensitive to the conditions imposed by the vegetation. For instance, when forest was substituted for savannas a greater fire risk was projected. Calculations of the PFI indicate that with the predicted future vegetation distribution, Africa will be more exposed to large scale vegetation fires. We showed that the impacts on PFI from climate change itself, in terms of temperature, humidity and precipitation were less pronounced.
Limitation of our modeling approach may be noted since the PFI depends strongly on the number of dry days and thus on precipitation. Precipitation is a very uncertain parameter in future and present day climate predictions and significantly differs even in sign between different climate models. It is not unlikely that using a different global climate model as boundary condition will lead to a different change in fire risk over Africa. Taking into account the full range of future climate predictions is beyond the scope of this study. A final remark is that our PFI concept does not take ignition of fire into account.
5. Acknowledgements
This work has been supported by the SoCoCA project funded by the Research Council of Norway (contract 190159).
REFERENCES
- D. M. J. S. Bowman, et al., “Fire in the Earth System,” Science, Vol. 324, No. 5926, 2009, pp. 481-484. http://dx.doi.org/10.1126/science.1163886
- K. Thonicke, I. C. Prentice and C. Hewitt, “Modelling Glacial-Interglacial Changes in Global Fire Regimes and Trace Gas Emissions,” Global Biogeochemical Cycles, Vol. 19, No. 3, 2005.
- B. Langmann, B. Duncan, C. Textor, J. Trentmann and G. R. van der Werf, “Vegetation Fire Emissions and Their Impact on Air Pollution and Climate,” Atmospheric Environment, Vol. 43, No. 1, 2009, pp. 107-116.
- S. E. Page, F. Siegert, J. O. Rieley, H. D. V. Boehm, A. Jaya and S. Limin, “The Amount of Carbon Released from Peat and Forest Fires in Indonesia during 1997,” Nature, Vol. 420, 2002, pp. 61-65. http://dx.doi.org/10.1038/nature01131
- J. G. Goldammer, “Fire in the Environment: The Ecological, Atmospheric and Climatic Importance of Vegetation Fires,” 13th Edition, John Wiley & Sons, Chichester, 1993.
- A. Aubréville, “Ancienneté la Destruction de la Couverture Forestiére Primitive de L’afrique Tropicale,” Bulletin Agricole de Congo Belge, Vol. 40, No. 2, 1949, pp. 1347-1352.
- J. M. N. Silva, J. M. C. Pereira, A. I. Cabral, M. J. P. Vasconcelos, B. Mota and J. M. Gregoire, “An Estimate of the Area Burned in Southern Africa during the 2000 Dry Season Using SPOT-VEGETATION Satellite Data,” Journal of Geophysical Research, Vol. 108, No. D13, 2003. http://dx.doi.org/10.1029/2002JD002320
- L. Giglio, G. R. van der Werf, J. T. Randerson, G. J. Collatz and P. Kasibhatla, “Global Estimation of Burned Arca Using MODIS Active Fire Observations,” Atmospheric Chemistry & Physics Discussions, Vol. 5, No. 6, 2005, pp. 11091-11141. http://dx.doi.org/10.5194/acpd-5-11091-2005
- V. Lehsten, P. Harmand, I. Palumbo and A. Arneth, “Modelling Burned Area in Africa,” Biogeosciences, Vol. 7, 2010, pp. 3199-3214. http://dx.doi.org/10.5194/bg-7-3199-2010
- J. R. Marlon, et al., “Climate and Human Influences on Global Biomass Burning over the Past Two Millennia,” Nature Geoscience, Vol. 1, No. 10, 2008, pp. 697-702. http://dx.doi.org/10.1038/ngeo313
- S. Kloster, et al., “Fire Dyamics During the 20th Century Simulated by the Community Land Model,” Biodigeosciences, Vol. 7, No. 6, 2010, pp. 1877-1902. http://dx.doi.org/10.5194/bg-7-1877-2010
- O. Pechony and D. T. Shindell, “Driving Forces of Global Wildfires over the Past Millennium and the Forthcoming Century,” PNAS, 2010.
- A. Bartsch, H. Balzter and C. George, “The Influence of Regional Surface Soil Moisture Anomalies on Forest Fires in Siberia Observed from Satellites,” Environmental Research Letters, Vol. 4, No. 4, 2009, Article ID: 045021. http://dx.doi.org/10.1088/1748-9326/4/4/045021
- S. J. Goetz, M. C. Mack, K. R. Gurney, J. T. Randerson and R. A. Houghton, “Ecosystem Responses to Recent Climate Change and Fire Disturbance at Northern High Latitudes: Observations and Model Results Contrasting Northern Eurasia and North America,” Environmental Research Letters, Vol. 2, No. 4, 2007, Article ID: 045031. http://dx.doi.org/10.1088/1748-9326/2/4/045031
- S. Scheiter and S. I. Higgins, “Impacts of Climate Change on the Vegetation of Africa: An Adaptive Dynamic Vegetation Modelling Approach,” Global Change Biology, Vol. 15, No. 9, 2009, pp. 2224-2246. http://dx.doi.org/10.1111/j.1365-2486.2008.01838.x
- C. Gouveia, C. C. DaCamara and R. M. Trigo, “Post Fire Vegetation Recovery in Portugal Based on Spot-Vegetation Data,” Natural Hazards and Earth System Sciences, Vol. 10, No. 4, 2010, pp. 673-684. http://dx.doi.org/10.5194/nhess-10-673-2010
- A. H. Lynch, et al., “Using the Paleorecord to Evaluate Climate and Fire Interactions in Australia,” Annual Review of Earth and Planetary Sciences, Vol. 35, 2007, pp. 215-239. http://dx.doi.org/10.1146/annurev.earth.35.092006.145055
- F. Justino, A. S. de Melo, A. Setzer, R. Sismanoglu, G. C. Sediyama, G. A. Ribeiro, J. P. Machado and A. Sterl, “Greenhouse Gas Induced Changes in the Fire Risk in Brazil in ECHAM5/MPI-OM Coupled Climate Model,” Climatic Changes, Vol. 106, No. 2, 2010, pp. 285-302.
- C. A. Alo and G. Wang, “Potential Future Changes of the Terrestrial Ecosystem Based on Climate Projections by Eight General Circulation Models,” Journal of Geophysical Research, Vol. 113, No. G1, 2008. http://dx.doi.org/10.1029/2007JG000528
- W. A. Hoffmann, W. Schoeder and R. Jackson, “Positive Feedbacks of Fire, Climate and Vegetation and the Conversion of Tropical Savanna,” Geophysical Research Letters, Vol. 29, No. 22, 2002, pp. 9-1-9-4. http://dx.doi.org/10.1029/2002GL015424
- W. J. Bond, F. I. Woodward and G. F. Midgley, “The Global Distribution of Ecosystems in a World without Fire,” New Phytologist, Vol. 165, No. 2, 2005, pp. 525- 537. http://dx.doi.org/10.1111/j.1469-8137.2004.01252.x
- E. Dwyer, S. Pinnock, J. M. Gregoire and J. Pereira, “Global Spatial and Temporal Distribution of Vegetation Fire as Determined from Satellite Observations,” International Journal of Remote Sensing, Vol. 21, 2000, pp. 1289-1302. http://dx.doi.org/10.1080/014311600210182
- A. Kilpeläinen, S. Kellomäki, H. Strandman and A. Venäläinen, “Climate Change Impacts on Forest Fire Potential in Boreal Conditions in Finland,” Climatic Change, Vol. 103, No. 3-4, 2010, pp. 383-398. http://dx.doi.org/10.1007/s10584-009-9788-7
- M. Flannigan, B. Amiro, K. Logan, B. Stocks and B. Wotton, “Forest Fires and Climate Change in the 21st Century,” Mitigation and Adaptation Strategies for Global Change, Vol. 11, No. 4, 2006, pp. 847-859. http://dx.doi.org/10.1007/s11027-005-9020-7
- S. J. Pyne, P. L. Andrews and R. D. Laven, “Introduction to Wildland Fire,” Wiley & Sons, New York, 1996.
- K. Thonicke, A. Spessa, I. C. Prentice, S. P. Harrison, L. Dong and C. Carmona-Moreno, “The Influence of Vegetation, Fire Spread and Fire Behaviour on Biomass Burning and Trace Gas Emissions: Results from a PrtoceeBased Model,” Biogeosciences Discussions, Vol. 7, No. 1, 2010, pp. 697-743. http://dx.doi.org/10.5194/bgd-7-697-2010
- T. Hickler, et al., “Implementing Plant Hydraulic Architecture within the LPJ Dynamic Global Vegetation Model,” Global Ecology and Biogeography, Vol. 15, No. 6, 2006, pp. 567-577. http://dx.doi.org/10.1111/j.1466-8238.2006.00254.x
- H. Sato, et al., “SEIB-DGVM: A New Dynamic Global Vegetation Model Using a Spatially Explicit IndividualBased Approach,” Ecological Modelling, Vol. 200, No. 3, 2007, pp. 279-307. http://dx.doi.org/10.1016/j.ecolmodel.2006.09.006
- A. Giannini, M. Biasutti and M. M. Verstraete, “A Climate Model-Based Review of Drought in the Sahel: Desertification, the Re-Greening and Climate Change,” Global and Planetary Change, Vol. 64, No. 3-4, 2008, pp. 119-128. http://dx.doi.org/10.1016/j.gloplacha.2008.05.004
- S. Nicholson and J. C. Selato, “The Influence of La Nina Events on African Rainfall,” International Journal of Climatology, Vol. 20, No. 14, 2000, pp. 1761-1777. http://dx.doi.org/10.1002/1097-0088(20001130)20:14<1761::AID-JOC580>3.0.CO;2-W
- K. H. Cook, “Large-Scale Atmospheric Dynamics and Sahelian Precipitation,” Journal of Climate, Vol. 10, No. 6, 1997, pp. 1137-1152. http://dx.doi.org/10.1175/1520-0442(1997)010<1137:LSADAS>2.0.CO;2
- C. J. C. Reason and M. Rouault, “Links between the Antarctic Oscillation and Winter Rainfall over Western South Africa,” Geophysical Research Letters, Vol. 32, No. 7, 2005, Article ID: L07705. http://dx.doi.org/10.1029/2005GL022419
- K. H. Cook, “A Southern Hemisphere Wave Response to ENSO with Implications for Southern Africa Precipitation,” Journal of Climate, Vol. 58, No. 15, 2001, pp. 2146- 2162.
- I. Held, T. L. Delworth, J. Lu, K. L. Findell and T. R. Knutson, “Simulation and Sahel Drought in the 20th and 21st Centuries,” PNAS, Vol. 102, No. 50, 2005, pp. 17891- 17896. http://dx.doi.org/10.1073/pnas.0509057102
- L. Mariotti, E. Coppola, M. Sylla, F. Giorgi and C. Piani, “Regional Climate Model Simulation of Projected 21st Century Climate Change over an All-Africa Domain: Comparison Analysis on Nested and Driving Model Results,” Journal of Geophysical Research, Vol. 116, No. D15, 2011. http://dx.doi.org/10.1029/2010JD015068
- E. Roeckner, et al., “The Atmospheric General Circulation Model ECHAM5. Part I: Model Description,” Max Planck Institute for Meteorology, 2003.
- N. Nakicenovic and R. Swart, “Special Report on Emissions Scenarios,” Cambridge University Press, Cambridge, 2000.
- M. B. Sylla, E. Coppola, L. Mariotti, F. Giorgi, P. M. Ruti, A. Dell’Aquila and X. Bi, “Multiyear Simulation of the African Climate Using a Regional Climate Model (RegCM3) with the High Resolution ERA—Interim Reanalysis,” Climate Dynamics, Vol. 35, No. 1, 2010, pp. 231- 247. http://dx.doi.org/10.1007/s00382-009-0613-9
- R. Sismanoglu, A. Setzer, A. L. Lopes and E. M. Sedeno, “Risco de Fogo Para a Vegetação de Cuba: Comparação Entre Duas Versões Para 2010 Utilizando Dados do Satélite TRMM e SYNOP,” Proceedings of 15th Simpósio Brasileiro de Sensoriamento Remoto, 2011.
- R. Sismanoglu and A. Setzer, “Risco de Fogo da Vegetação na América do Sul: Comparação de Três Versões na Estiagem de 2004,” Proceedings of 12th Simpósio Brasileiro de Sensoriamento Remoto, 2005.
- S. Sitch, et al., “Evaluation of Ecosystem Dynamics, Plant Geography and Terrestrial Carbon Cyclin in the LPJ Dynamic Global Vegetation Model,” Global Change Biology, Vol. 9, No. 2, 2003, pp. 161-185. http://dx.doi.org/10.1046/j.1365-2486.2003.00569.x
- G. Bonan, S. Levis, L. Kergoat and K. Oleson, “Landscapes as Patches of Plant Functional Types: An Integrating Concept for Climate and Ecosystem Models,” Global Biogeochemical Cycles, Vol. 16, 2002, pp. 5.1-5.23.
- D. Davies, S. Kumar and J. Descloitres, “Global Fire Monitoring Using MODIS Near-Real-Time Satellite Data,” GIM International, Vol. 18, No. 4, 2004, pp. 41-43.
- L. Giglio, J. Descloitres, C. O. Justice and Y. J. Kaufman, “An Enhanced Contextual Fire Detection Algorithm for MODIS,” Remote Sensing of Environment, Vol. 87, No. 2-3, 2003, pp. 273-282.
- E. Kalnay, et al., “The NCEP-NCAR 40 Year Reanalysis Project,” Bulletin of the American Meteorological Society, Vol. 77, No. 3, 1996, pp. 437-471. http://dx.doi.org/10.1175/1520-0477(1996)077<0437:TNYRP>2.0.CO;2
- V. Markgraf, C. Whitlock and S. Haberle, “Vegetation and Fire History during the Last 18,000 cal yr B.P. in Southern Patagonia: Mallin Pollux, Coyhaique, Province Aisen (45˚41'30"S, 71˚50'30"W, 640 m Elevation),” Palaeogeography, Palaeoclimatology, Palaeoecology, 2007.
- C. Whitlock, M. M. Bianchi, P. J. Bartlein, V. Markgraf, J. Marlon, M. Walsh and N. McCoy, “Postglacial Vegetation, Climate, and Fire History along the East Side of the Andes (lat 41-42.5S), Argentina,” Quaternaly Research, Vol. 66, No. 2, 2006, pp. 187-201.
- G. R. van der Werf, J. T. Randerson, L. Giglio, N. Gobron and A. J. Dolman, “Climate Controls on the Variability of Fires in the Tropics and Subtropics,” Global Biogeochemical Cycles, Vol. 22, No. 3, 2008.
- B. Lyon, “Southern Africa Summer Drought and Heat Waves: Observations and Coupled Model Behavior,” Journal of Climate, Vol. 22, No. 22, 2009, pp. 6033- 6046.
- P. Rocha, A. Melo-Gonçalves, C. Martques, J. Ferreira and J. M. Castanheira, “High-Frequency Precipitation Changes in Southeastern Africa Due to Anthropogenic Forcing,” International Journal of Climatology, Vol. 28, No. 9, 2008. http://dx.doi.org/10.1002/joc.1596
- M. Tadross, C. Jack and B. Hewitson, “On RCM-Based Projections of Change in Southern African Summer Climate,” Geophysical Research Letters, Vol. 32, No. 23, 2005. http://dx.doi.org/10.1029/2005GL024460
- M. Hirota, C. Nobre, M. D. Oyama and M. M. Bustamante, “The Climatic Sensitivity of the Florest, Savanna and Forest-Savanna Transition in Tropical South America,” New Phytologist, Vol. 187, No. 3, 2010, pp. 707-719. http://dx.doi.org/10.1111/j.1469-8137.2010.03352.x
- M. E. Shongwe, G. J. van Oldenborgh, B. J. J. M. van den Hurk, B. de Boer, C. A. S. Coelho and M. K. van Aalst, “Projected Changes in Mean and Extreme Precipitation in Africa Under Global Warming. Part I: Southern Africa,” Journal of Climate, Vol. 22, No. 13, 2009, pp. 3819- 3837.