American Journal of Climate Change
Vol. 2 No. 3A (2013) , Article ID: 37299 , 11 pages DOI:10.4236/ajcc.2013.23A001
Spatially Explicit Modeling of Long-Term Drought Impacts on Crop Production in Austria
1Central Institute for Meteorology and Geodynamics, Vienna, Austria
2Institute for Sustainable Economic Development, University of Natural Resources and Life Sciences, Vienna, Austria
3Department of Mathematics and Statistics, University of Canterbury, Christchurch, New Zealand
Email: franziska.strauss@zamg.ac.at
Copyright © 2013 Franziska Strauss et al. This is an open access article distributed under the Creative Commons Attribution License, which permits unrestricted use, distribution, and reproduction in any medium, provided the original work is properly cited.
Received June 20, 2013; revised July 23, 2013; accepted August 29, 2013
Keywords: Long-Term Drought Modeling; Dry Day Index; Biophysical Impacts; Spatial Variability; EPIC; Austria
ABSTRACT
Droughts have serious and widespread impacts on crop production with substantial economic losses. The frequency and severity of drought events may increase in the future due to climate change. We have developed three meteorological drought scenarios for Austria in the period 2008-2040. The scenarios are defined based on a dry day index which is combined with bootstrapping from an observed daily weather dataset of the period 1975-2007. The severity of long-term drought scenarios is characterized by lower annual and seasonal precipitation amounts as well as more significant temperature increases compared to the observations. The long-term impacts of the drought scenarios on Austrian crop production have been analyzed with the biophysical process model EPIC (Environmental Policy Integrated Climate). Our simulation outputs show that—for areas with historical mean annual precipitation sums below 850 mm— already slight increases in dryness result in significantly lower crop yields i.e. depending on the drought severity, between 0.6% and 0.9% decreases in mean annual dry matter crop yields per 1.0% decrease in mean annual precipitation sums. The EPIC results of more severe droughts show that spring and summer precipitation may become a limiting factor in crop production even in regions with historical abundant precipitation.
1. Introduction
Drought is a natural phenomenon and can be defined as sustained and extensive occurrence of below average water availability [1]. A drought can be defined in several ways depending on the disciplinary perspective (e.g. soil moisture drought, hydrological drought). The most commonly used definition is the meteorological drought. It constitutes a deficit of precipitation (in comparison to climatological average values) in a given region and over a defined time span. In contrast, an agricultural drought results from lacking water supply for agricultural crops, leading to a reduction of crop yields in the affected region. The crop yields can be further affected by temperature increases, wind speed and humidity, which may lead to higher potential evapotranspiration rates and thus cause soil moisture deficits [e.g. 2]. An agricultural drought has been differently defined by several authors e.g. definition based on daily rainfall and crop water consumption [3], on the deficiency or absence of precipitation during the growing season or by long dry spells [4], on the number of consecutive days on which the actual evapotranspiration to potential evapotranspiration ratio remains below a certain threshold value [5].
Droughts might manifest themselves either as short but extreme single season drought (such as the extremely hot summer in Europe in 2003) or as a longer-term, multiseason drought, and they might be local or widespread in nature [6]. In Europe, the mean annual economic loss due to droughts amounts to EUR 5.3 billion, with a peak of EUR 8.7 billion in 2003 [1].
Precipitation deficits in many European regions have already become more severe [7]. On the European scale, some areas may be affected by a general increase in the number of drought occurrences and also by more extreme drought events with uncertain severity and spatial distribution [2,8]. For central and southern Europe, it has been projected that the total proportion of areas under water stress may increase from 19% in 2007 to 35% in 2070 [8]. The net global trend may result in an increase in the area of extreme drought from 1% to 30% by the end of this century [9]. An analysis of droughts in the Czech Republic in the period 1881-2006 confirms a statistically significant tendency to prolonged and more intensive dry episodes in terms of increased temperatures and decreased precipitation sums [2].
According to theories of physical geography and empirical field investigations, impacts of droughts on different landforms, soil types, and crop management systems may vary significantly. The soil types more often susceptible to droughts are mountain burozem, plain burozem, chestnut soil, chernozem, grassmarshland chernozem, and grassmarsh soil [4,10]. In the Czech Republic, persistently lower crop yields for spring barley, winter wheat, and forage crops were documented in years with drought episodes, in comparison to years without droughts [2]. The degree of damage to maize production has recently increased with global warming, and spatial distributions of crop yield losses caused by drought events are closely connected with the rainfall during growing season of the crop as well as the aridity index [10]. Furthermore, the degree of damage from droughts depends on frequency, duration, intensity, spatial extent (i.e. the area affected by drought), regional production level of the specific crop, and the timing of the drought related to crop phenology [11].
In summary, many studies have already assessed impacts of drought events on agricultural production [1,3-5, 11-14], but only few have investigated the impacts of increased frequency of extreme events on crop production [e.g. 15,16]. Consequently, it is important to quantitatively assess the impacts of increased drought occurrences on crop yields in geo-spatial contexts to account for the natural heterogeneity (with respect to temporal and spatial variations) in crop production. Such an analysis may provide a basis for the assessment of the potential damage by long-term droughts as well as of measures to mitigate the adverse impacts of drought risks (e.g. planning and management of water resources for irrigation to reduce the vulnerability in crop production).
A recent review presents common methodologies for future drought modeling [17], e.g. time series analysis, probability based modeling, spatio-temporal analysis, and the use of climate change scenarios of GCMs. However, the following weaknesses were identified: 1) the assumption of linearity between predictor and predictand in a regression model, 2) the modeling of drought events with ARIMA for up to two months in advance but no longer, 3) the application of Markov chains in probability models (firstly used by [18] having the property that the value of the next state depends only on the current state and not on the entire past), and 4) the development of future drought events based on precipitation anomalies derived from GCMs. Based on such GCM outputs, an increase in the frequency of long-duration droughts was found for catchment areas in southern Europe and less frequent droughts for a catchment in northern England, but the model used in the analysis is plagued by problems of correctly reproducing mean monthly precipitation sums [19]. The usefulness of GCMs to perform a proper analysis of dry spells is therefore limited because of the arbitrariness in the generation of day-to-day precipitation data as well as the spatio-temporal and physical inconsistency between other weather parameters [17].
In the present study, we analyze both the meteorological and agricultural droughts. We use an alternative statistical approach to develop meteorological drought scenarios for Austria. Our approach is based on a climatological study for Austria, which provides daily weather data for the period 1975-2007 on a 1 km grid resolution [20]. We have divided the original datasets into blocks of seven and eight days (the blocks were not allowed to span more than one month) and calculated the dry day index which is the proportion of total area dry during those days. We have then applied a block bootstrap method [21] to generate hypothetical more extreme meteorological drought scenarios for the future. We have entered our developed drought scenarios as well as data on soil, topography and crop management into the biophysical process model EPIC—Environmental Policy Integrated Climate [22-23], which is applied on Austrian cropland area at 1 km grid resolution. EPIC provides outputs inter alia on dry matter crop yields, soil moisture, evapotranspiration, and stress factors of crop growth. Hence, the impacts of increased meteorological drought occurrences on crop production can be demonstrated in a spatially explicit and consistent manner. Furthermore, regions can be identified which are most prone to drought risk. A 31 years period is investigated allowing for the analysis of both long-term drought impacts and interannual variability in agricultural crop production.
This article is organized as follows. Section 2 presents the data and the methodology for the development of drought scenarios in Austria. In Section 3, we show the consequences and impacts of increased long-term drought occurrence on both simulated crop yields and evapotranspiration followed by discussion and conclusion in Section 4.
2. Data, Methods and Impact Modeling
2.1. Dry Day Index
We have used the climate dataset for Austria [20], which includes daily time series of solar radiation, maximum and minimum temperatures, precipitation, relative humidity and wind speed for the period 1975-2007. This dataset is based on both spatially interpolated climatologies of mean annual precipitation sums and mean annual temperatures on a 1 km grid [24] including high-quality homogenized daily time series [25]. The spatially interpolated climatologies have been combined into clusters with homogenous climate characteristics (i.e. climate clusters), and for each climate cluster the daily time series represent the long-term (inter-annual) and short-term (daily) variabilities. In total, 60 climate clusters have been derived which represent the small-scale climate patterns in Austria [cp. 20]. They are named with numbers including the climatological characteristics: e.g., climate cluster 0509 represents regions with mean annual precipitation sums smaller than or equal to 500 mm and mean annual temperatures ranging between 8.6˚C and 9.5˚C; climate cluster 0901 represents regions with mean annual precipitation sums ranging between 801 mm and 900 mm and mean annual temperatures between 0.1˚C and 2.5˚C; and climate cluster 2006 represents regions with mean annual precipitation sums greater than 1500 mm and mean annual temperatures ranging between 5.6˚C and 6.5˚C.
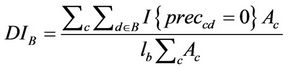
The highest annual precipitation sums are in the mountainous regions of the west and the south as well as in the northern foothills of the Austrian Alps. The lowest annual precipitation sums are in the flat areas of the east, the north-east and the south-east of Austria. We are particularly interested in these regions considering the long-term impacts and the inter-annual variability of increased meteorological drought occurrences on crop production. For this purpose, we model meteorological drought scenarios based on the following dry day index DIB:
 (1)
(1)
where 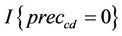 equals to 1 if there was no precipitation recorded for the cluster c on day d and equals to 0 otherwise, lb is the block length (seven or eight days) and Ac is the area of the respective climate cluster c. Note that
  is the total area of Austria. The block bootstrap was used rather than the simple (one-day-at-a-time) bootstrap in order to account for temporal autocorrelation. Each month was thus divided into four blocks. The first three blocks were of eight days each and the last block was always incomplete (for example, for a month of 30 days, the last block is of length 30 − 8 × 3 = 6 days). However, for convenience, we refer to an “eight-day block” in this text. Thus, the dry day index DIB reflects the average proportion of the total territory which is dry on any random day. Note, that DIB = 1 for absolutely dry and DIB = 0 for daily rainfall in the entire country (Figure 1).
In order to take into account seasonal variation in other weather parameters, our block bootstrap set-up was also month specific. Thus, for example, blocks for June 2040 were sampled from the set of blocks from any past June.
We have chosen to analyze the impacts of three hypothetical meteorological drought scenarios for Austria. The first drought scenario reflects a baseline scenario (S0), i.e. the distribution of the dry day index remains nearly the
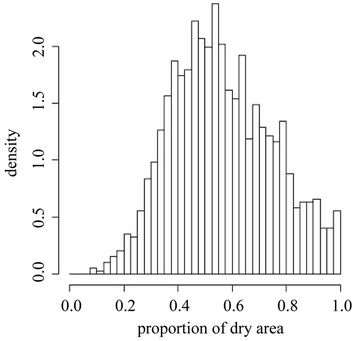
Figure 1. The empirical distribution of the dry day index DIB in the period 1975-2007.
same as for the past period 1975-2007. The other two drought scenarios (S1 and S2) project higher proportion of dry days, and are modeled by sampling more frequently from the drier eight-day blocks. We use a weighted resampling scheme where the probability PB of sampling block B is evaluated by:
 (2)
(2)
where a is the resampling weight. Note that if a = 0, we get S0 so that each block has an equal probability of being resampled, and if a = 1 (respectively 2) we obtain S1 (respectively S2). In S1, the situation where almost the entire country is wet in an eight-day block occurs less often than in S0, reflecting an increase in drought events. S2 describes an even more extreme increase in the frequency of drought events as the fraction of days within an eight-day block—during which many parts of the country are wet—decreases even more (Table 1). Most pronounced decreases in precipitation sums with S2 are in the range of 40% and occur in autumn and winter. By comparison, the climate projections with the Climate Local Model (CLM) and the A1B emissions scenario (out of the Special Report on Emissions Scenarios—SRES—by IPCC) show highest precipitation decreases of 41% in the south-western Alps followed by 25% in the north-eastern Alps in summer; however, these projections until the end of the 21st century depend on the GCMs and regions selected. On average, precipitation decreases between 1% and 11% are simulated for the Alpine region [26].
The procedure for obtaining time series of the set of meteorological parameters is described in the following: 1) We have calculated DIB (Equation (1)) for each eight-day block from the period 1975-2007. 2) The blocks have then been bootstrapped based on DIB from the past and on month-specific blocks with the probability evaluated in Equation (2). The spatial autocorrelation is taken into
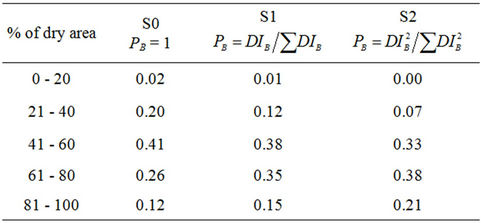
Table 1. Probabilities of a given percentage of dry areas in Austria for S0, S1 and S2 based on one of the 30 re-allocations for each of the drought scenarios.
account as well since we sample the weather parameters (precipitation, maximum and minimum temperatures, solar radiation, relative humidity and wind speed) for the entire country at a time. 3) 30 bootstrapped samples have been produced for each drought scenario in order to assess the uncertainty of our estimates.
Other statistical approaches (e.g. LARS WG) exist as well see [27-29] which are capable of generating localscale and daily climate scenarios based on the output from GCMs. The motivation of our statistical approach can be summarized by the weaknesses of GCMs and Regional Climate Models (RCMs) to consistently project near climate futures (defined as the upcoming 30 years period) such as: 1) uncertainties in initialization and parameterization; 2) coarse resolution of GCMs (and often also RCMs) in representing the complex terrain in Austria; 3) climate change signals arising from greenhouse forcing, which is still small for the upcoming 30 years period compared to the model differences and model internal long-term variability; and 4) the spatio-temporal and physical inconsistency of multiple weather parameters. Furthermore, the scenario members generated by GCMs (RCMs) might not be independent from each other. However, the main limitation of our approach comes from the assumptions made in generating the climate scenarios without taking into account any possible other developments (i.e. economy, population, technology) as described in SRES. But such developments may gain in importance and show significant impacts in the second half of the 21st century.
2.2. Biophysical Impact Modeling with EPIC
The impact assessment of increased drought occurrences on crop production has been performed by analyzing annual simulation outputs of the biophysical process model EPIC, which has been already validated for some Austrian regions [e.g. 30-33]. In previous studies, EPIC crop yields were found to be more sensitive to temperature changes compared to precipitation changes [32]; however, in the present analysis, precipitation is expected to change by more units than temperature, and thus resulting in higher sensitivities of crop yields to precipitation.
Biophysical processes simulated with EPIC include among others crop growth, nutrient leaching, nitrification, mineralization, wind and water erosion, and soil carbon respiration [22,23]. These processes are simulated at daily time steps or smaller. EPIC contains algorithms that allow for a complete description of the hydrological balance at field to small watershed scale (up to 100 ha) including snowmelt, surface runoff, infiltration, soil water content, percolation, lateral flow, water table dynamics, and evapotranspiration. EPIC offers five equations to compute potential evapotranspiration (PET) including PenmanMonteith [34]—which has been used in the present analysis, and [35-38].
EPIC uses the concept of radiation-use efficiency by which a fraction of daily photosynthetically active radiation is intercepted by the plant canopy and converted into plant biomass. The leaf area index is simulated as a function of heat units, crop stresses and development stages. Daily accumulation of plant biomass is affected by vapor pressure deficits and atmospheric CO2 concentration [39]. Crop yield is a function of the harvest index and aboveground biomass. Stress indices for water, temperature, nitrogen, phosphorus, aluminum toxicity and aeration are calculated daily using the most limiting value to reduce actual plant growth and crop yield. Similarly, stress factors such as soil bulk density, temperature, and aluminum toxicity are used to adjust potential root growth [40].
The soil water balance depending on the potential water use, the root zone depth, and the water use distribution parameter is applied in a water use function in which any water deficit can be overcome if a soil layer that is encountered has adequate water storage. The potential water use is reduced when the soil water storage is less than 25% of plant-available soil water by using dependencies on the soil water contents at field capacity and wilting point.
The site conditions in Austria comprise topographical (slope and elevation) and soil data which are classified into Homogenous Response Units (HRUs) cp. [33]. A total of 443 HRUs has been delineated for Austria and comprises six elevation classes (from sea level to above 2100 m), seven slope classes (from smaller 5% to above 100%), and 15 soil types which are merged with data from 60 climate clusters (cp. Section 2.1). Soil data are extracted from [41] and contain soil layer specific contents of silt, sand and clay, humus, pH, calcium carbonate, and coarse fragments. Up to 25 crop rotation systems per municipality have been derived with the CropRota model [42] using historical land use data of 22 crops [32]. These crops, respectively crop rotations, cover about 89% of total arable land in Austria. In EPIC, annual planting and harvesting dates are automatically adjusted to account for changing seasonal growing conditions (i.e. planting and harvesting dates are triggered when certain fractions of total heat units per crop are attained by daily heat unit accumulation from planting to maturity). Fertilizer application rates (N, P, K) are computed crop and regional specific [33] and refer to the guidelines of good agricultural practices in Austria. Irrigation is omitted to isolate the drought impacts on crop production.
The biophysical impacts of drought scenarios on crop yields and evapotranspiration are simulated for the future period and presented next.
3. Results
3.1. Description of Meteorological Drought in Austria
On average, the mean annual precipitation sums in S2 from the period 2008-2040 are lower than in S0 and S1. In addition, we obtain significant temperature increases in S1 and S2, predominantly in spring, summer and autumn. Mean annual maximum temperatures are rising most in S2. In Figure 2, we show for the climate clusters 0509, 0901 and 2006 the development of monthly precipitation sums in a randomly selected year (2040) compared to the mean monthly precipitation sums of 1975-2007. These climate clusters have been chosen, because they span typical climates in Austria (lowlands and Alpine regions). Figure 2 depicts the deficiency of precipitation in several months when compared to the respective mean monthly sums of the past period. The occurrence of meteorological drought is thus obvious even if monthly precipitation

Figure 2. Monthly precipitation sums (mm) for the climate clusters 0509 (top), 0901 (middle), and 2006 (bottom) based on one bootstrapped re-allocation in 2040 for S0 (dotted), S1 (dashed), S2 (dashed-dotted) and mean monthly precipitation sums of 1975-2007 (continuous line).
might be above the mean value of 1975-2007 in certain months. In the case that the highest past precipitation sums occur in summer (autumn), we also receive the highest future precipitation sums in summer (autumn), on average. Table 2 summarizes in which season the decrease in precipitation sums is most pronounced, as it may have decisive effects on particular crops.
The largest decreases in precipitation sums occur for climate cluster 0509 with 43% in autumn (September, October, November), and for climate clusters 0901 and 2006 with 41% in winter (December, January, February). The precipitation decreases are also important in spring and summer (ranging between 20% and 34%) with S2. Even in regions with abundant precipitation (e.g. climate cluster 2006), the seasonal precipitation sums, particularly in the spring and summer seasons, can be so low that water may become a limiting factor in crop production.
Figure 3 shows the aridity index AI which is defined as the relation between annual precipitation and potential evapotranspiration [43]. Its spatial distribution is shown for S0, S1 and S2, and the number of years (in total 31 years * 30 bootstrapped re-allocations) where AI ≤ 0.5 (specifying a semi-arid climate) increases significantly in S1 and S2, predominantly in the eastern parts of Austria.
3.2. Spatial Analysis of Long-Term Drought Impacts on Crop Yields and Evapotranspiration
We have analyzed the impacts on annual crop yields for S1 or S2 and S0 (Figure 4). Therefore, we have averaged the sum of dry matter crop yields of the respective crop rotation for each 1 km grid and over the period 2010-2040 as well as the 30 bootstrapped re-allocations. S1 leads to lower dry matter crop yields of ~2 t/ha in comparison to S0 for many parts of the country, especially in the eastern lowlands. In contrast, simulated dry matter crop yields are higher by up to 2 t/ha in the foothills of the Alps and in the south-east of Austria. In these regions, enough water seems to be available for crop production and the increase in temperature leads to additional crop yields due to less temperature stress on average.
The adverse effects on crop yields are more pronounced in S2. The extent of areas where the lower precipitation becomes a limiting factor for crop production increases: Crop yields may decrease between 2 t/ha and 4 t/ha, most severely in the eastern lowlands and the northern foothills of the Alps. Furthermore, small increases in crop yields in S1 turn into crop yield losses of ~2 t/ha in S2 in many parts of the north and south-east of Austria.
In comparing the results of S1 with S0, we reveal that the highest decreases of average dry matter crop yields (about 2 t/ha) are linked with the highest decreases in evapotranspiration rates (between 60 mm and 80 mm; Figure 5) and important increases of water stress (up to
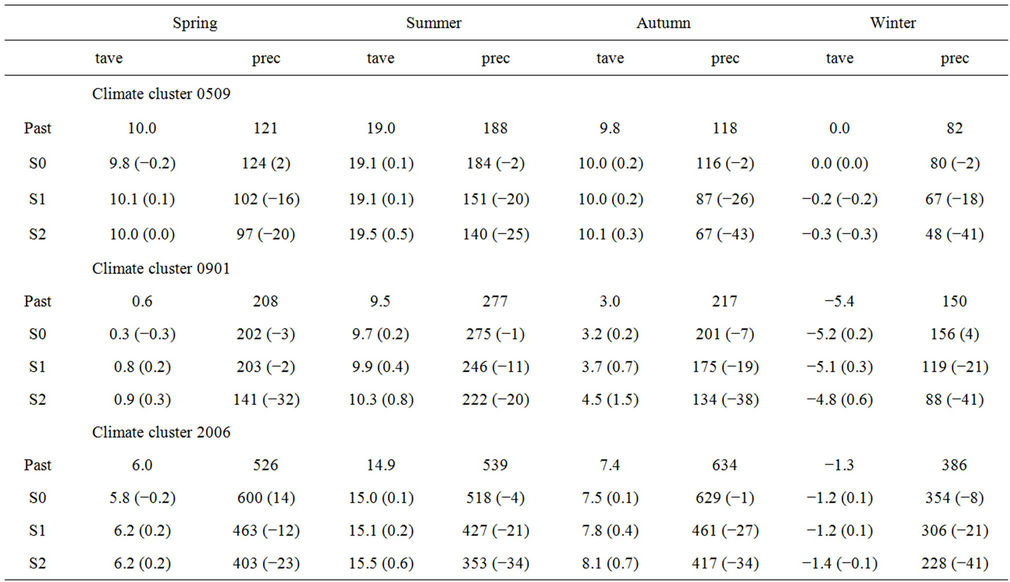
Table 2. Seasonal average temperatures (tave in ˚C) and precipitation sums (prec in mm) for the climate clusters 0509, 0901, and 2006 for the past, S0, S1, and S2. In parentheses, anomalies are presented in ˚C for tave and % for prec.
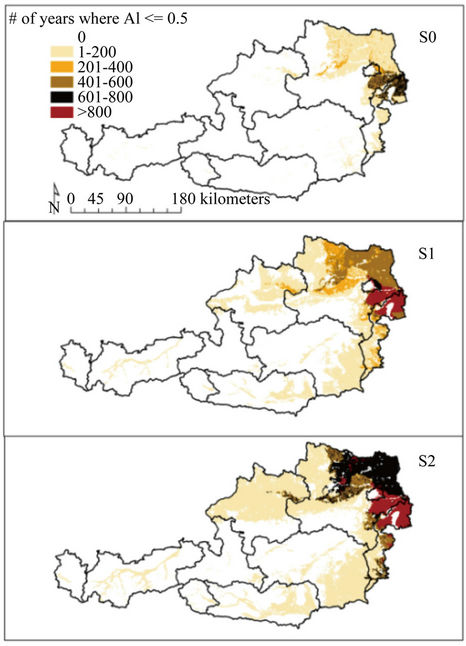
Figure 3. Occurrence of a semi-arid climate (AI ≤ 0.5) on Austrian cropland by scenarios (S0, S1, S2).
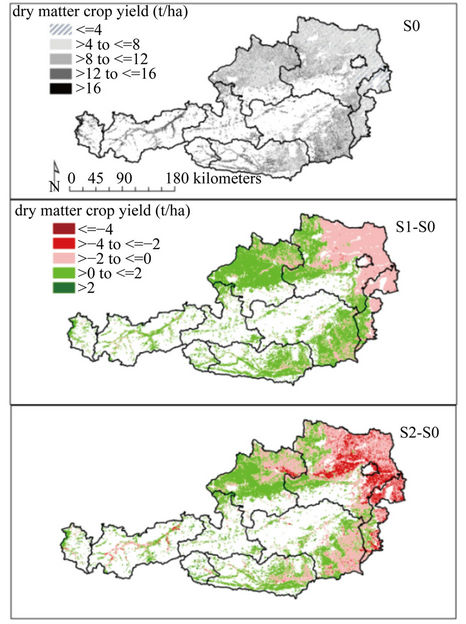
Figure 4. Simulated average annual dry matter crop yields (t/ha) on Austrian cropland for S0, and respective differences (middle: S1-S0, bottom: S2-S0).
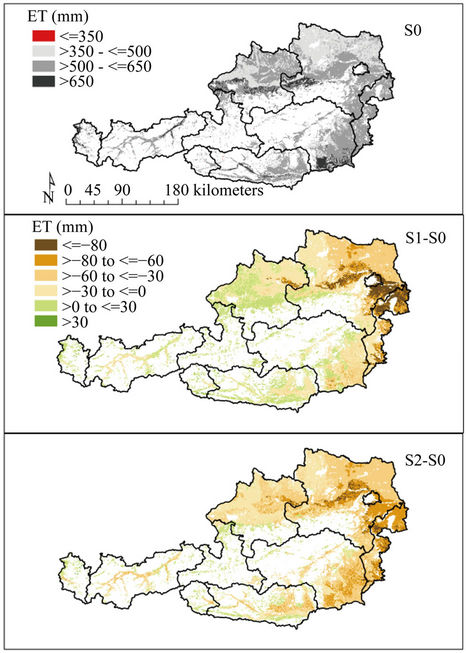
Figure 5. Simulated average annual evapotranspiration rates (mm) on Austrian cropland for S0, and respective differences (middle: S1-S0, bottom: S2-S0).
50% more days with water stress compared to S0 in the 31 year period and for the 30 bootstrapped re-allocations), predominantly in the north-eastern parts of Austria. Severely limiting precipitation and higher temperatures can lead to lower crop transpiration rates and biomass accumulation as well as soil evaporation. In contrast, it can also lead to higher evapotranspiration rates by up to 30 mm in regions, where precipitation is still sufficiently available. However, slight crop yield increases may also induce decreases of evapotranspiration rates (in the comparison with S1 in the range of 0 mm to 30 mm; in the comparison with S2 in the range of 0 mm to 80 mm). In these regions, the crop transpiration slightly increases due to higher temperatures, but soil evaporation decreases due to deficient precipitation amounts. The highest absolute dry matter crop yield losses simulated with S2 range between 2 t/ha and 4 t/ha, which are associated with decreases of annual evapotranspiration rates between 60 mm and 80 mm and an increase of water stress days by 75%.
To account for long-term drought impacts of different soil types, elevation and slope classes on dry matter crop yields, we have averaged the EPIC outputs over the respective area (out of the total cropland area of about 1.3 million ha). Most pronounced dry matter crop yield differences between S1 and S0 occur on chernozems (−1 t/ha) and alluvial soils (−0.2 t/ha). The comparison between S2 and S0 leads to substantial decreases in dry matter crop yields of about 2 t/ha on chernozems, 0.8 t/ha on alluvial soils, 0.4 t/ha on gley and pseudogley, and 0.2 t/ha on brown earth. Brown earth, chernozems and pseudogley cover about 40%, 25% and 9% of total cropland in Austria, respectively.
The comparison of simulated average crop yields between elevation classes shows that average crop yield declines are most significant at low elevations. The dry matter crop yield reductions are 0.8 t/ha in S1 and 1.6 t/ha in S2 for elevations below 300 m. For elevations above 2100 m, there is a crop yield increase of 0.9 t/ha in S1 and of 1.6 t/ha in S2. Mainly forage crops are grown at this elevation.
Similarly, average dry matter crop yield decreases are higher on flatter slopes (respective decreases of 0.3 t/ha and 0.8 t/ha in S1 and S2 for slopes <5%), and turning into increases at steeper slopes i.e. 0.4 t/ha in S1 and S2 for slopes >100% due to less erosion.
The average decreases in evapotranspiration rates of S1 (S2) with respect to S0 are about 70 mm (130 mm) on chernozems, followed by 30 mm (70 mm) on alluvial soils and 20 mm (60 mm) on pseudogley. For different elevation classes, the respective decreases in evapotranspiration rates of S1 and S2 are 60 mm and 120 mm at elevations <300 m, and turning into increases of 25 mm and 40 mm at elevations >2100 m, respectively. For different slope classes, decreases in evapotranspiration rates of S1 (S2) are 30 mm (70 mm) at slopes <5% and again turning into increases of ~10 mm for both S1 and S2 at slopes >100%.
3.3. Inter-Annual Variability
The inter-annual variability is described by the spread consisting of 2790 simulated crop yield values for each 1 km grid point, which result from 31 years of simulations (2010-2040), three drought scenarios (S0, S1 and S2), and 30 bootstrapped re-allocations per drought scenario. As standard measure, we have investigated the standard deviations. The development of simulated crop yields under drier conditions is more “certain” in the eastern and northeastern parts of the country. Standard deviations range between ±1 t/ha and ±3 t/ha in the east and north-east of Austria and between ±5 t/ha and ±7 t/ha in other parts of Austria.
The smaller inter-annual variability of the simulated crop yields in the eastern and north-eastern parts of Austria can be explained by the rather persistent small precipitation amounts observed in the past period 1975-2007, which become even smaller in our drought scenarios. In the other parts of Austria, our drought scenarios may lead to very dry conditions in particular years, however, years with “usual” precipitation sums (similar to the past observations) may also occur and therefore lead to minor or no crop yield impacts (predominantly in the southern and western parts of Austria as well as for some parts in the foothills of the Alps).
3.4. Elasticities
Figure 6 shows the percent changes in mean annual dry matter crop yields and mean annual precipitation sums of S1 on the top (S2 on the bottom) compared to S0 of one bootstrapped re-allocation out of the 30 re-allocations. The correlation plots for other bootstrapped re-allocations look similar and are therefore not presented. The comparison with S1 shows that even small increases in dryness will result in significantly lower dry matter crop yields, particularly in areas with annual precipitation sums below 850 mm in S0: Simulated dry matter crop yields decrease by 0.6% per 1.0% decrease in annual precipitation sums.
In areas with annual precipitation sums above 850 mm in S0, simulated dry matter crop yields decrease by 0.4% per 1.0% decrease in annual precipitation sums. The comparison with S2 shows an even more pronounced sensi-

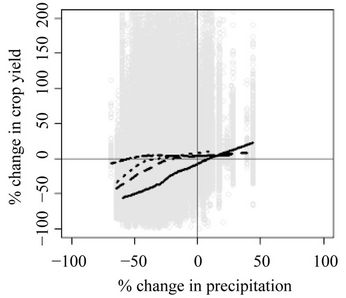
Figure 6. Elasticities between percent changes in simulated dry matter crop yields and annual precipitation sums (P): 400 mm < P < 670 mm (continuous line); 671 mm < P < 850 mm (dashed); 851 mm < P < 1050 mm (dotted); P > 1051 mm (dashed-dotted).
tivity: With up to 50% less precipitation, dry matter crop yields still only slightly change in regions with mean annual precipitation sums above 1050 mm in S0, but the crop yields become more sensitive to decreases in annual precipitation sums smaller than 1050 mm. Dry matter crop yields may decrease by about 20% with up to 50% less precipitation in regions with mean annual precipitation sums between 851 mm and 1050 mm in S0 (elasticity of +0.6), followed by decreases of about 35% in regions with mean annual precipitation sums between 671 mm and 850 mm (elasticity of +0.8) and decreases of about 55% in regions with mean annual precipitation sums between 400 mm and 670 mm (elasticity of nearly +1.0).
4. Discussion and Conclusions
The block bootstrap, which has been applied in the present analysis for generating drought scenarios, is a straightforward method of re-sampling time series while relating to the inherent autocorrelation. It does not require explicit modeling of the autocorrelation structure which in our case would be further compounded by the spatial autocorrelation. The choice of block length naturally plays a role. If the blocks are too short, the autocorrelation is weak; if they are too long, they become unmanageable and permit very little variation. We have chosen the block of eight days because it is convenient for building up the length of a month, and because preliminary simulations showed that the autocorrelation structure for the weather parameters was retained to the sufficient lag.
The analysis shows the usefulness of our developed dry day index to analyze in a spatial consistent way the longterm impacts of increased drought occurrences on crop production. Thus, we have identified the regions in Austria that would be more at risk when the meteorological drought occurrences increase. These regions are predominantly located in the eastern and north-eastern parts of the country, as expected, due to their already lower annual precipitation sums compared to other regions in Austria. Therefore, future research should assess the agricultural adaptation potential—especially in regions with lower annual precipitation sums—e.g. switching to more drought tolerant cultivars with slow leaf dehydration rates. The development of such cultivars (e.g. plant breeding of genotypes which are less sensitive to drought stress by a better developed root system) may come to the fore to avoid overexploitation of ground water resources. In addition, investments in irrigation systems, accompanied by well-defined diversification in crops and crop management practices will gain in importance to mitigate drought risk [31,44].
Austrian regions with historically abundant precipitation amounts (e.g. in the southern and western parts of the country) may also suffer from significant crop yield losses in particular years when confronted with extreme drought events. However, years with precipitation sums similar to the past observations may also occur and therefore may lead to minor crop yield impacts, although temperature is increasing and leading to higher evapotranspiration rates. Moreover, the simulated crop yields and evapotranspiration rates tend to increase along the elevation slope gradients due to higher precipitation amounts in mountainous terrains which, thus, tend to be less vulnerable to droughts. However, only a small fraction of cropland is located in such terrain.
Finally, it will be also interesting to investigate the impacts of significantly higher precipitation amounts on crop production and environment (e.g. flooding, soil water erosion). In any case, our approach can also be used to generate increased occurrences of heavy rainfall and flood events—which may also occur in a warmer climate—by mirroring the dry day index distribution.
5. Acknowledgements
This study has been supported by the ACRP projects CAFEE (grant number B068725)—Climate change in agriculture and forestry: an integrated assessment of mitigation and adaptation measures in Austria, and CC2BBE (grant number B286285)—Vulnerability of a bio-based economy to global climate change impacts as well as by the project MACSUR (grant number 100875)—Modeling European Agriculture with Climate Change for Food Security, a FACCE JPI knowledge hub supported by the Federal Ministry of Agriculture, Forestry, Environment and Water Management of Austria.
REFERENCES
- Commission of the European Communities, “Addressing the Challenge of Water Scarcity and Droughts in the European Union,” Communication from the Commission to the European Parliament and the Council, 414 Final, Brussels, 2007.
- R. Brázdil, M. Trnka, P. Dobrovolný, K. Chromá, P. Hlavinka and Z. Žalud, “Variability of Droughts in the Czech Republic, 1881-2006,” Theoretical and Applied Climatology, Vol. 97, No. 3-4, 2009, pp. 297-315. doi:10.1007/s00704-008-0065-x
- K. Yurekli and A. Kurunc, “Simulating Agricultural Drought Periods Based on Daily Rainfall and Crop Water Consumption,” Journal of Arid Environments, Vol. 67, No. 4, 2006, pp. 629-640. doi:10.1016/j.jaridenv.2006.03.026
- J. Q. Zhang, “Risk Assessment of Drought Disaster in the Maize-Growing Region of Songliao Plain, China,” Agriculture, Ecosystems and Environment, Vol. 102, No. 2, 2004, pp. 133-153. doi:10.1016/j.agee.2003.08.003
- G. M. Richter and M. A. Semenov, “Modelling Impacts of Climate Change on Wheat Yields in England and Wales: Assessing Drought Risks,” Agricultural Systems, Vol. 84, No. 1, 2005, pp. 77-97. doi:10.1016/j.agsy.2004.06.011
- S. J. Eisenreich, “Climate Change and European Droughts,” In: Climate Change and the European Water Dimension, European Commission, Luxemburg, 2005, pp. 121-135.
- A. K. Mishra and V. P. Singh, “A Review of Drought Concepts,” Journal of Hydrology, Vol. 391, No. 1-2, 2010, pp. 202-216. doi:10.1016/j.jhydrol.2010.07.012
- Intergovernmental Panel on Climate Change IPCC, Synthesis Report. Contribution of Working Groups I, II and III to the 4th Assessment Report of the Intergovernmental Panel on Climate Change, 2007.
- E. J. Burke, S. J. Brown and N. Christidis, “Modeling the Recent Evolution of Global Drought and Projections for the Twenty-First Century with the Hadley Centre Climate Model,” Journal of Hydrometeorology, Vol. 7, No. 5, 2006, pp. 1113-1125. doi:10.1175/JHM544.1
- J. Q. Zhang, “A Study on Damage Degree and Risk Assessment and Regional Classification of Meteorological Disasters: Case Studies of Yamaguchi Prefecture in Japan and Songliao Plain in China,” Ph.D. Thesis, Tottori University, Tottori, 2000.
- M. H. Yang and J. Q. Zhang, “Assessment and Regionalization of Meteorological Disaster to Maize in Jilin Province, China,” In: E. P. Wan and X. R. Xu, Eds., Prediction and Monitoring of Maize Yield by Remote Sensing in China, Chinese Science and Technology Press, Beijing, 1996, pp. 196-218.
- V. Kumar and U. Panu, “Predictive Assessment of Severity of Agricultural Droughts Based on Agro-Climatic Factors,” Journal of the American Water Resources Association, Vol. 33, No. 6, 1997, pp. 1255-1264. doi:10.1111/j.1752-1688.1997.tb03550.x
- J. E. Olesen and M. Bindi, “Consequences of Climate Change for European Agricultural Productivity, Land Use and Policy,” European Journal of Agronomy, Vol. 16, No. 4, 2002, pp. 239-262. doi:10.1016/S1161-0301(02)00004-7
- J. Eitzinger, C. Kersebaum and H. Formayer, “Landwirtschaft im Klimawandel—Auswirkungen und Anpassungsstrategien für die Land-und Forstwirtschaft in Mitteleuropa,” AgriMedia, Clenze, 2009.
- F. Ewert, D. Rodriguez, P. Jamieson, M. A. Semenov, R. A. C Mitchell, J. Goudriaan, J. R. Porter, B. A. Kimball, P. J. Pinter Jr., R. Manderscheid, H. J. Weigel, A. Fangmeier, E. Fereres and F. Villalobos, “Effects of Elevated CO2 and Drought on Wheat: Testing Crop Simulation Models for Different Experimental and Climatic Conditions,” Agriculture, Ecosystems and Environment, Vol. 93, No. 1-3, 2002, pp. 249-266. doi:10.1016/S0167-8809(01)00352-8
- Q. Zhang, P. Sun, V. P. Singh and X. Chen, “SpatialTemporal Precipitation Changes (1956-2000) and Their Implications for Agriculture in China,” Global and Planetary Change, Vol. 82-83, 2012, pp. 86-95. doi:10.1016/j.gloplacha.2011.12.001
- A. K. Mishra and V. P. Singh, “Drought Modeling—A Review,” Journal of Hydrology, Vol. 403, No. 1-2, 2011, pp. 157-175. doi:10.1016/j.jhydrol.2011.03.049
- K. R. Gabriel and J. Neumann, “A Markov Chain Model for Daily Rainfall Occurrences at Tel Aviv,” Quarterly Journal of the Royal Meteorological Society, Vol. 88, No. 375, 1962, pp. 90-95. doi:10.1002/qj.49708837511
- S. Blenkinsop and H. J. Fowler, “Changes in Drought Characteristics for Europe Projected by the PRUDENCE Regional Climate Models,” International Journal of Climatology, Vol. 27, No. 12, 2007, pp. 1595-1610. doi:10.1002/joc.1538
- F. Strauss, H. Formayer and E. Schmid, “High Resolution Climate Data for Austria in the Period from 2008 to 2040 from a Statistical Climate Change Model,” International Journal of Climatology, Vol. 33, No. 2, 2013, pp. 430- 443. doi:10.1002/joc.3434
- M. Mudelsee, “Climate Time Series Analysis,” Springer, Dordrecht, 2010. doi:10.1007/978-90-481-9482-7
- J. R. Williams, “The EPIC Model,” In: V. P. Singh, Ed., Computational Models of Watershed Hydrology, Water Resources Publications, Highlands Ranch, Colorado, 1995, pp. 909-1000.
- R. C. Izaurralde, J. R. Williams, W. B. McGill, N. J. Rosenberg and M. C. Quiroga, “Simulating Soil C Dynamics with EPIC: Model Description and Testing against Long-Term Data,” Ecological Modelling, Vol. 192, No. 3-4, 2006, pp. 362-384. doi:10.1016/j.ecolmodel.2005.07.010
- I. Auer, R. Böhm, H. Mohnl, R. Potzmann and W. Schö- ner, “ÖKLIM—A Digital Climatology of Austria 1961- 1990,” Proceedings of the 3rd European Conference on Applied Climatology, Pisa, 16-20 October 2000, CD Rom.
- W. Schöner, I. Auer, R. Böhm and S. Thaler, “Qualitätskontrolle und Statistische Eigenschaften Ausgewählter Klimaparameter auf Tageswertbasis im Hinblick auf Extremwertanalysen,” Subproject of StartClim: Erste Analysen extremer Wetterereignisse und ihrer Auswirkungen in Österreich, Vienna, 2003. http://www.austroclim.at/index.php?id=startclim2003
- European Environment Agency EEA, “Regional Climate Change and Adaptation—The Alps Facing the Challenge of Changing Water Resources,” EEA Report No. 8/2009, ISSN 1725-9177, Copenhagen, 2009.
- P. Racsko, L. Szeidl and M. Semenov, “A Serial Approach to Local Stochastic Weather Models,” Ecological Modelling, Vol. 57, No. 1-2, 1991, pp. 27-41. doi:10.1016/0304-3800(91)90053-4
- M. A. Semenov and E. M. Barrow, “Use of a Stochastic Weather Generator in the Development of Climate Change Scenarios,” Climatic Change, Vol. 35, No. 4, 1997, pp. 397-414. doi:10.1023/A:1005342632279
- M. A. Semenov and P. Stratonovitch, “The Use of MultiModel Ensembles from Global Climate Models for Impact Assessments of Climate Change,” Climate Research, Vol. 41, No. 1, 2010, pp. 1-14. doi:10.3354/cr00836
- E. Schmid, F. Sinabell and P. Liebhard, “Effects of Reduced Tillage Systems and Cover Crops on Sugar Beet Yield and Quality, Ground Water Recharge and Nitrogen Leaching in the Pannonic Region Marchfeld, Austria,” Pflanzenbauwissenschaften, Vol. 8, No. 1, 2004, pp. 1-9.
- C. Heumesser, S. Fuss, J. Szolgayová, F. Strauss and E. Schmid, “Investment in Irrigation Systems under Precipitation Uncertainty,” Water Resources Management, Vol. 26, No. 11, 2012, pp. 3113-3137. doi:10.1007/s11269-012-0053-x
- F. Strauss, E. Schmid, E. Moltchanova, H. Formayer and X. Wang, “Modeling Climate Change and Biophysical Impacts of Crop Production in the Austrian Marchfeld Region,” Climatic Change, Vol. 111, No. 3, 2012, pp. 641- 664. doi:10.1007/s10584-011-0171-0
- B. Stürmer, J. Schmidt, E. Schmid and F. Sinabell, “Implications of Agricultural Bioenergy Crop Production in a Land Constrained Economy—The Example of Austria,” Land Use Policy, Vol. 30, No. 1, 2013, pp. 570-581. doi:10.1016/j.landusepol.2012.04.020
- J. L. Monteith, “Evaporation and Environment,” Symposia of the Society for Experimental Biology, Vol. 19, 1965, pp. 205-234.
- H. L. Penman, “Natural Evaporation from Open, Bare Soil and Grass,” Proceedings of the Royal Society of London, Series A, Vol. 193, No. 1032, 1948, pp. 120-145. doi:10.1098/rspa.1948.0037
- C. H. B. Priestly and R. J. Taylor, “On the Assessment of Surface Heat Flux and Evaporation Using Large Scale Parameters,” Monthly Weather Review, Vol. 100, No. 2, 1972, pp. 81-92. doi:10.1175/1520-0493(1972)100<0081:OTAOSH>2.3.CO;2
- G. H. Hargreaves and Z. A. Samani, “Reference Crop Evapotranspiration from Temperature,” Applied Engineering in Agriculture, Vol. 1, No. 2, 1985, pp. 96-99.
- W. Bair and G. W. Robertson, “Estimation of Latent Evaporation from Simple Weather Observations,” Canadian Journal of Plant Science, Vol. 45, No. 3, 1965, pp. 276- 284. doi:10.4141/cjps65-051
- C. O. Stockle, J. R. Williams, N. J. Rosenberg and C. A. Jones, “A Method for Estimating the Direct and Climatic Effects of Rising Atmospheric Carbon Dioxide on Growth and Yield of Crops: Part I-Modification of the EPIC Model for Climate Change Analysis,” Agricultural Systems, Vol. 38, No. 3, 1992, pp. 225-238. doi:10.1016/0308-521X(92)90067-X
- C. A. Jones, P. T. Dyke, J. R. Williams, J. R. Kiniry, V. W. Benson and R. H. Griggs, “EPIC: An Operational Model for Evaluation of Agricultural Sustainability,” Agricultural Systems, Vol. 37, No. 4, 1991, pp. 341-350. doi:10.1016/0308-521X(91)90057-H
- Bundesforschungszentrum für Wald BFW, “Digital Soil Map for Austria,” 2009. http://gis.lebensministerium.at/eBOD
- M. Schönhart, E. Schmid and U. Schneider, “Crop Rota —A Crop Rotation Model to Support Integrated Land Use Assessments,” European Journal of Agronomy, Vol. 34, No. 4, 2011, pp. 263-277. doi:10.1016/j.eja.2011.02.004
- United Nations Environment Programme UNEP, “World Atlas of Desertification,” Second Edition, 1997.
- Organization for Economic Co-Operation and Development OECD, “Scoping Paper on Crop Insurance and Farmer Incentives to Adapt to Climate Change,” Joint Working Party on Agriculture and the Environment, 2010.