InfraMatics
Vol.2 No.1(2013), Article ID:29588,11 pages DOI:10.4236/inframatics.2013.21001
Remote Infrasound Monitoring of Mount Etna: Observed and Predicted Network Detection Capability
1CEA/DAM/DIF, Arpajon, France
2Department of Earth Science, University of Firenze, Firenze, Italy
3Centre National de la Cartographie et de la Télédétection, Tunis, Tunisie
4BGR, Hannover, Germany
Email: alexis.le-pichon@cea.fr
ABSTRACT
Volcanic eruptions are valuable calibrating sources of infrasonic waves worldwide detected by the International Monitoring System (IMS) of the Comprehensive Nuclear Test-Ban-Treaty Organization (CTBTO) and other experimental stations. In this study, we assess the detection capability of the European infrasound network to remotely detect the eruptive activity of Mount Etna. This well-instrumented volcano offers unique opportunity to validate attenuation modelsusing multi-year nearand far-field recordings. The seasonal trend in the number of detections of Etna at the IS48 IMS station (Tunisia) is correlated to fine temporal fluctuations of the stratospheric waveguide structure. This observed trend correlates well with the variation of the effective sound speed ratio which is a proxy for the combined effects of refraction due to sound speed gradients and advection due to along-path wind on infrasound propagation. Modeling results are consistent with the observed detection capability of the existing regional network. In summer, during the downwind season, a minimum detectable amplitude of ~10 Pa at a reference distance of 1 km from the source is predicted. In winter, when upwind propagation prevails, detection thresholds increase up to ~100 Pa. However, when adding four experimental arrays to the IMS network, the corresponding thresholds decrease down to ~20 Pa in winter. The simulation results provide here a realistic description of longto mid-range infrasound propagation and allow predicting fine temporal fluctuations in the European infrasound network performance with potential application for civil aviation safety.
Received December 12, 2012; revised January 25, 2013; accepted February 19, 2013
Keywords: Infrasound Monitoring; Volcanoes; Network Performance; Optimization; Simulation
1. Introduction
A large variety of natural and anthropogenic phenomena produces intense low-frequency acoustic waves below the 20 Hz human hearing threshold [1]. These signals, referred to as infrasound, can propagate over large distances through the atmosphere due to low attenuationin acoustic waveguides between the ground and troposphere, in the stratosphere and lower thermosphere [2-5]. Depending on the upper-wind structure, ducting can then be reinforced or reduced [6-9]. Interest in such propagation studies had been revived since the Comprehensive Nuclear Test-Ban-Treaty (CTBT, http://www.ctbto.org/) was adopted and opened for signature in 1996. The International Monitoring System (IMS) is designed to ensure compliance with the CTBT by detecting and locating explosions with a minimum yield of one kiloton of TNT-equivalent anywhere in the world using at least two stations [10,11]. The infrasound component of this network currently consists today of 45 certified stations out of the 60 that are planned to be constructed. Even not yet fully established, this network already allows studies on a global scale as it has demonstrated its capability to detect and locate a large number of geophysical and anthropogenic sources [12,13].
Among numerous naturally occurring geophysical phenomena generating acoustic waves, volcanic eruptions are outstanding sources of repetitive signals [14-16]. As infrasound signals are associated with the massive ejection of material and the release of conduit overpressure, they are a good indicator that an eruption has occurred [17-19]. Moreover, due to the long-range propagation of infrasound, this technique is valuable to remotely monitor volcanoes in regions where ground-based observations are sparse [20-23] and identify potential hazards for aircraft safety [24,25].
Many active volcanoes are permanently detected by the IMS infrasound network [24]. In particular, Mt. Etna in Italy (37.73˚N, 15.00˚E; 3330 m high) is in Europe the highest and most active strato-volcano. It is located on the east coast of Sicily, lying above the convergent plate margin between the African and the Eurasian plates. This volcano has experienced a variety of eruption styles. Its volcanic activity can be divided into two main types: effusive flank eruptions, mainly characterized by the opening vents or fractures to feed voluminous lava flows, and persistent explosive summit activity, including mostly violent Strombolian and phreatomagmatic explosions, lava fountaining and persistent degassing [26,27]. Its current activity is typically effusive with explosive episodes and lava fountaining, with often large ash ejection in the atmosphere affecting nearby cities and local air traffic.
As the activity of Etna is mostly effusive, sometimes accompanied by small-to-moderate explosions, it often yields to small VEI (1-2).
During 2008-2009 and early 2010, no significant explosive activity was reported. Since October 2010, more paroxysmal eruptive periods, characterized by strong Strombolian activity, lava fountaining, and often dense dark ash emissions were reported. However, such information is not as precise as continuous near-field observations. The Smithsonian database is more useful for explosive volcanoes that rarely erupt or at least not continuously, and where the amount of observations is limited.
The main objective of this study is to assess the potential of the European infrasound network to monitor Etna by analyzing nearand far-field recordings from 2008 until now. In order to calibrate the existing network and evaluate the performance of the future ARISE (Atmospheric dynamics Research Infra Structure in Europe (http://arise-project.eu/) network, frequency-dependent attenuation relations are integrated into a network performance modeling technique. We first present the infrasound network and describe array processing methods. Then, the capability of the IS48 IMS station to detect Etna is analyzed by considering a detailed description of both the background noise at the receiver and the dynamics of structure of the stratosphere. Finally, we evaluate the performance of the existing IMS network and quantify its improvement by adding experimental stations.
2. Observation Network
The IMS network is unique by its global and homogeneous coverage. Significant advances in array designs and processing methods as well as the development of highly sensitive sensors and efficient wind-noise filtering systems allow now detecting low-amplitude coherent signals from remote volcanoes with an unprecedented precision [10-29]. In particular, at a distance of about 550 km, Etna is permanently monitored by the IS48 IMS station (35.80˚N, 9.32˚E) located in Tunisia. In case of major eruption, signals can be detected by other IMS stations like IS26 in Germany and IS43 in Russia, at a distance of 1240 and 2680 km, respectively. In addition to the existing operating IMS network, we consider in this study the four experimental arrays OHP, AMT, CEA and Flers (Figure 1). Within the course of the ARISE project, other arrays, like the ones operated by the Royal Netherlands Meteorological Institute (KNMI, The Netherlands), the Federal Institute for Geosciences and Natural Resources (BGR, Germany) and the Atomic Weapons Establishment (AWE Blacknest, UK), will provide additional far-field recordings.
In the near-field, one permanent small aperture (~250 m) four-element array, ETN, operated by the University of Firenze (UNIFI), routinely records the Etna activity since 2007. Each array element is equipped with a differential pressure transducer with a sensitivity of 20 mV/Pa [30]. The wide frequency response (0.01 - 100 Hz) and the 200 Pa peak-to-peak pressure range allow a full-recovery of the signals of interest. ETN is deployed on the southern flank of Etna volcano, at an elevation of about 2000 m a.s.l. and at a distance of approximately 5 km from the summit craters. This site allows a clear azimuthal discrimination of infrasound radiated from most of the Etna summit craters, and thus represents an essential contribution to accurately monitor its degassing and volcanic activity. Data are processed in real-time using a cross-correlation based method. Since September 2007, almost 2.4 ×10⁶ detections (about one detection per minute) related to both degassing and explosive activity were measured.
IS48 well detects Etna (550 km, 65.4˚) and Stromboli (618 km, 55.9˚), the nearest active volcanoes. Itconsists of seven separate MB2000-type microbarometers connected to a central recording facility with inter-sensor-spacing
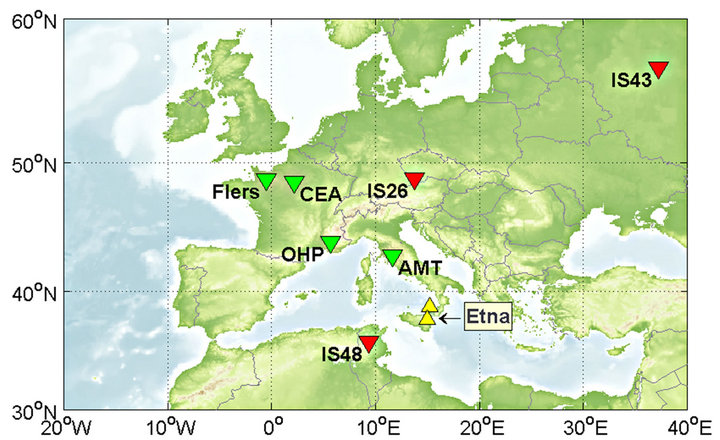
Figure 1. Location of Etna and the nearby Stromboli volcano (yellow triangles). The red and green reverse triangles represent IMS infrasound and experimental arrays, respectively (geographical coordinates of the stations are provided in Table 1).
ranging from 150 m to 1.6 km. The microbarometers operate from DC up to 27 Hz with a flat frequency response from 0.02 to 4 Hz and an electronic self-noise level of 2 mPa RMS (<18 dB below the minimum acoustic noise at 1Hz). Infrasound data are routinely processed with the Progressive Multi-Channel Correlation method (PMCC) [31]. The processing is performed consecutively using an adaptive window length and log-spaced frequency bands allowing the full frequency band of interest (0.02 - 4 Hz) to be processed in one single run [32].
Figure 2 presents the results of the PMCC automatic processing results at IS48 filtered in the 0.1 - 4 Hz band from 2006 to 2012. Several sources of infrasonic waves are identified:
§ From 0.1 to 0.3 Hz, microbaroms produced by large interacting open-ocean swell systems [33-35] nearly continuously detected in winter from North Atlantic Ocean with a back-azimuth between 310˚ and 320˚, and in summer from the Mediterranean Sea with a back-azimuth about 90˚.
§ Above 0.5 Hz, in summer, persistent detections associated with eruptions of Mt. Etna and Stromboli with back-azimuth between 50˚ and 80˚. Paroxysmal events but also small-to-moderate explosions are almost continuously recorded between May and September.
§ Above 1 Hz, detections possibly related to industrial activity (oil and gas fields, refineries in Libya and Algeria) with back-azimuth between 120˚ and 210˚.
Monitoring infrasound at IS48over several years reveals a clear seasonal transition in the bearings along with the stratospheric general circulation between summer and winter for both microbarom and volcano signals. Furthermore, these seasonal variations reverse whether sources are locate east or west of the array.This oscillation clearly captured in climatological wind models [4-36] controls to the first order the direction from where signals are expected to be detected.
Figure 3 presents one example of a major eruptive episode of Etna on April 1st, 2012 which was well detected by several stations up to station IS43 in Russia. The measured celerity (horizontal propagation range divided by travel time) near 300 m/s at all stations suggests a propagation through the stratospheric waveguide [3,4]. To locate the source, the three nearest stations (IS48, IS26 and CEA) are considered by applying a simple cross bearing method. The source is located at about 75 km to north-east of the true location (38.27˚N, 15.56˚E).
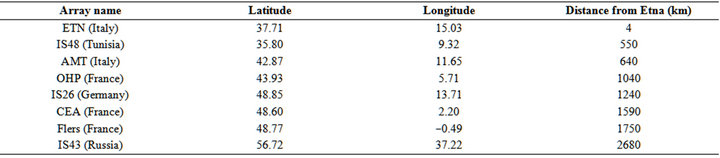
Table 1. Geographical coordinates of infrasound arrays.
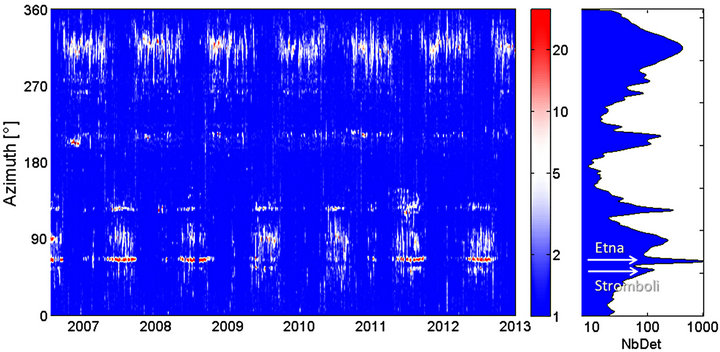
Figure 2. Continuous PMCC processing results at IS48 in the 0.1 - 4 Hz band. The color scale codes the number of detections per day (normalized log-scale). The back-azimuth distribution highlights two peaks corresponding to signals from Etna and Stromboli.
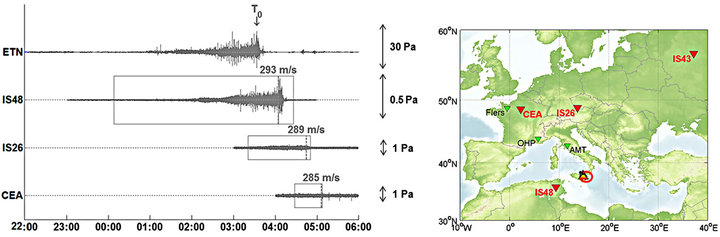
Figure 3. Infrasound signals produced by the lava fountain of Etna on April 1st, 2012 recorded by ETN (5 km from the source), IS48 (550 km), IS26 (1240 km) and CEA (1590 km). Signals are filtered in the 0.5 - 3 Hz band. Detection periods are outlined by red rectangles. The celerity of the waves at IS48, IS26 and CEA stations referring to an origin time of 03:40 GMT (green arrow at the ETN recordings) is indicated at the maximum peak amplitude observed on the filtered signals (green marks). The source location is shown by the 95% confidence yellow error ellipse (map source: Google Earth).
3. Characterization of Stratospheric Dynamic Effects
In the thermosphere, waves are strongly attenuated due to the classical and rotational absorption which increases with frequency [5]. Considering the relative high frequency content of the signals of interest (generally above 0.5 Hz), most of the acoustic energy propagates in the stratospheric waveguide. If the gradient in the temperature and along-path wind is strong enough in the stratosphere, waves refract back to the earth’s surface. In the 40 - 50 km range of altitude, infrasound propagation is thus essentially controlled by the effective sound speed ratio (Veff-ratio) which is a proxy for the combined effects of refraction due to sound speed gradients and wind advection around 50 km altitude [37-39]. This effect is clearly reflected in Figure 4 where the multi-year infrasound observations of Etna and Stromboli indicate good detection capability in summer when downwind propagation occurs (Veff-ratio > 1). However, compared to the other years, a reduced number of detections are noted in 2009 and 2010.
To further investigate the correlation between the station detection capability and the structure of the stratospheric waveguide, the seasonal variation of the number of detections is compared to Veff-ratio calculated in the direction of propagation (Figure 5). The stratospheric duct refracts acoustic energy back to the ground for Veff-ratio above one, hence decreasing the transmission loss [40]. This explains the relative high daily number of detections (~100 per day) from May to September. For Veff-ratio slightly lower than one, where ray tracing techniques fail to predict stratospheric returns, Parabolic Equation (PE) method simulations incorporating gravity waves enlarge the ensonified regions at ground level [39]. This is clearly reflected by the observations where the daily number of detections reaches ~10 for Veff-ratio ~0.95. In winter, the station detection capability can be temporarily variable following the reversals of the prevailing stratospheric winds during sudden stratospheric warming (SSW) events. These events play a dominant role in the stratospheric general circulation [41]. This analysis highlights the strong influence of the stratospheric waveguide structure which controls the capability of IS48 to monitor Etna.
To explain the variation in the number of detections from one year to another, infrasound observations at IS48 are compared to the near-field recordings at ETN. Figure 6 shows that Etna is quasi-permanently observed from May to September, and occasionally in winter during periods of days to weeks following stratospheric wind reversals when the polar vortex breaks. Favorable detection at IS48 is further enhanced when the source amplitude approaches 1. It is noteworthy that clear activity of Etna (e.g. summer 2010) can be recorded below a source amplitude of 1 Pa if Veff-ratio is around 1.1. The weak number of detections in summer 2009 and 2010 (up to ~100 times lower compared to 2011 and 2012) is explained by a near-field source amplitude which rarely exceeds 10 Pa. Under upwind scenario, this threshold increases up to ~100 Pa.
4. Simulating the Network Performance
Today, numerical modeling techniques provide a basis to better understand the role of different factors describing the source and the atmosphere that influence propagation predictions. Previous studies estimated the radiated source energy from remote observations using empirical yieldscaling relations which account for the along-path stratospheric winds [42]. In order to quantify the infrasound network detection capability in highs patio-temporal
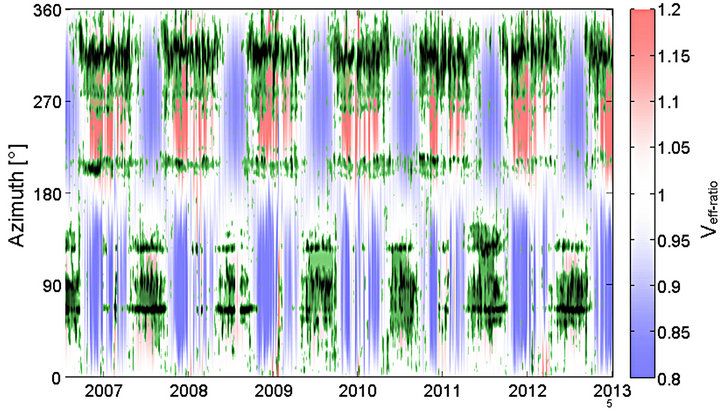
Figure 4. 2D density plot of PMCC detections at IS48 in the 0.1 - 4 Hz band (in green, normalized log-scale) superimposed to the effective sound speed ratio calculated in all directions using the European Centre for Medium range Weather Forecasting (ECMWF, http://www.ecmwf.int/). The maximum of Veff-ratio is calculated between 30 and 60 km altitude, averaged along the propagation path from Etna to IS48. Colors refer to Veff-ratio with values ranging from 0.8 to 1.2.
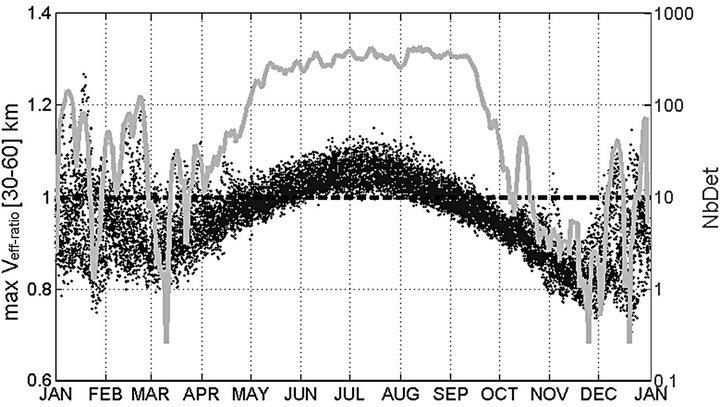
Figure 5. Correlation between the logarithm of number of detections from Etna (blue curve) and Veff-ratio (black dots). Daily observations are averaged between 2006 and 2012.
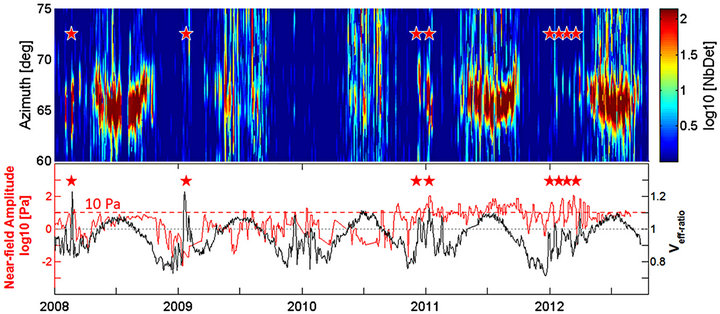
Figure 6. Comparison between the number of detections at IS48 (normalized log-scale) and the signal amplitude at ETN (95th percentile daily measurements scaled to a reference distance of 1 km from the source). Gray braces outline quasi-permanent detections in summer. Beige and red stars show examples of detection periods in winter explained by downwind conditions and/or signal amplitude at ETN significantly larger than 10 Pa.
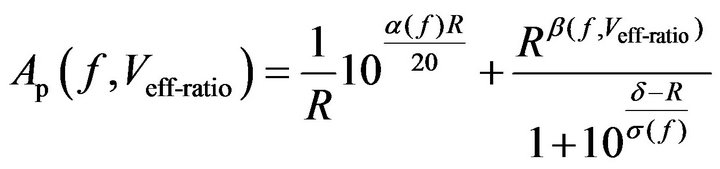
resolution, a frequency-dependent numerical modeling technique coupled with realistic station noise and atmospheric specifications is considered [40]. Model predictions have been further enhanced by the addition of perturbation terms which are excluded from the current atmospheric specifications. They provide a mechanism to describe the acoustic penetration into geometrical shadow zones. Horizontal velocity fluctuations of realistic amplitude induced by naturally-occurring gravity waves have been incorporated in the original wind models. In this study, we use the proposed semi-empirical attenuation relationship derived from massive range-independent PE simulations Equation (1):
 (1)
(1)
where Ap is the attenuation coefficient of the pressure wave at a distance R (in km) from the source. The attenuation is calculated from the source region at a reference distance of 1 km to the receiver. The first term of Equation (1) describes the pressure wave attenuation in the shadow zone where α (km−1) is the dissipation of direct waves. The second term characterizes the attenuation beyond the first shadow zone in the geometrical acoustic duct region, where β accounts for the geometrical spreading and dissipation of both stratospheric and thermospheric waves, δ (km) defines the width of the shadow zone between the source and first stratospheric bounce (set to 180 km), and σ (km) is a scaling distance controlling the strength of the attenuation in the shadow zone.
The analysis of the waveforms in the nearand farfields provides means to validate Equation (1). On April 1st, 2012, the peak-amplitudes in the 0.5 - 3 Hz band of the signals produced by the lava fountain at IS48 and ETN are 0.5 and 34 Pa, respectively (Figure 3). The attenuation scaled to a reference distance of 1 km from the source is 51 dB. Considering a dominant frequency band of the signals ranging from 0.5 to 3 Hz and Veff-ratio ~1.12 at the time of the event averaged along the path at 50 km altitude, the tabulated transmission loss β is 0.92 ± 0.05. In the far-field, at a distance of 550 km from the source, the predicted attenuation can then be calculated using the  simplified form of Equation (1), yielding a value of 54.8 ± 5.5 dB, which is consistent with the observation.
To validate the detection capability of the existing infrasound network and quantify its improvement by adding more arrays, we use Equation (1) to predict the smallest signal attenuation at any source location. Then, by combining broad frequency band information and realistic time-varying station-specific noise conditions, we further evaluate whether the signal is confidently detectable above the noise level at the receivers. Simulations are carried out in six bandwidths overlapping by one octave between 0.04 and 5.12 Hz: 0.04 to 0.16 Hz, 0.08 to 0.32 Hz, 0.16 to 0.64 Hz, 0.32 to 1.28 Hz, and 0.64 to 2.56 Hz. Results are presented at the following central frequencies: 0.1, 0.2, 0.4, 0.8, and 1.6 Hz. For one specific date, Veff-ratio is calculated using the ECMWF wind and temperature models averaged at 50 km altitude along the great circle arc between each node (i, j) of a 0.5˚ × 0.5˚ global source grid and each array (k). For each propagation path and central frequency (f), the attenuation coefficient  is calculated using Equation (1). Values of the fand Veff-ratio-dependent parameters α, β and σ are obtained following a cubic interpolation of the matrices provided in [40]. For the IMS stations, station noise models
  are based on accumulated power spectral density (PSD) statistics [43]. For the experimental arrays AMT, OHP, CEA and Flers where noise models are not available, we assume background noise conditions given by the median global IMS noise curve. Incorporating real-time ambient noise calculation at all receivers would probably improve the simulation results. Then, assuming a signal-to-noise ratio (SNR) of 1 at which a detection can be reliably made, the minimum detectable source amplitude at a frequency (f) and at point (i, j) with respect to station (k) is given by
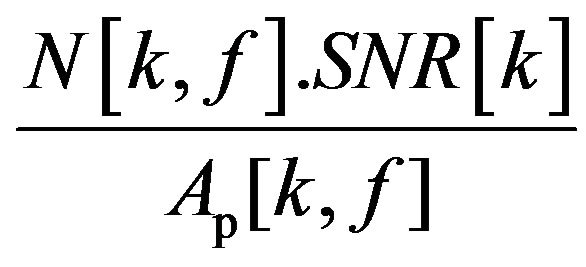 . The pressure in Pa refers to a reference distance 1 km away from the source. Finally, we investigate the effect of the number of detecting stations on the network performance with one-, twoand threestation coverage.
Figure 7 compares the European geographical coverage of the minimum detectable signal amplitude by one station, at a frequency close to the observed signals from Etna, in summer and winter, with and without adding AMT, OHP, CEA and Flers to the operating IMS network. As Equation (1) describes the pressure wave attenuation in the shadow zone, a resulting increase in the signal amplitude for sources located downwind between each station and the first stratospheric bounce is noticeable. Such effect could not be simulated by the empirical attenuation relation derived from historical recordings of atmospheric nuclear and chemical explosions [44]. The predicted network performance follows the general stratospheric wind circulation and provides here a good description of the global seasonal oscillation of the dominant zonal wind component. In January, sources generally located west of the station are detected with thresholds in the order of 10 Pa. In July, the steady westward stratospheric currents favor long-range propagation of signals from easterly directions. With the IMS network only, in summer, Etna is likely to be detected by IS48 with a ~10 Pa threshold whereas in January, the minimum detectable amplitude increases up to ~80 Pa. When incorporating the experimental arrays, detection thresholds remain unchanged in July since no station has better source coverage than IS48, while in winter, thresholds decrease down to ~20 Pa due to siting of AMT relative to Etna.
As infrasound networks are designed to detect and locate sources of interest, two-station coverage is the baseline condition to form an event. Three stations offer the advantage of reducing the false alarm rate through redundant station detections, and improving location accuracy through reduction of sites aligned with the source. Figure 8 presents the minimum detectable signal amplitude with three-station coverage with and without the experimental arrays. Compared with one-station coverage (Figure 7), a general increase in the detection thresholds is simulated. This effect is more pronounced in summer since most stations are located upwind. In January, when incorporating the experimental arrays, the detection capability of Etna decreases from ~80 to ~40 Pa, while in July, the geographical coverage of the thresholds does not noticeably change.
Figure 9 presents the yearly fluctuations of the smallest signal amplitude detectable by the IMS network only with oneand three-station coverage. Due to the decrease of the noise levels with frequency, improved detection capability is simulated at 1.6 Hz. The lowest detection thresholds are predicted between mid-May and midSeptember when the prevailing stratospheric jet currents favor westward propagation. At 1.6 Hz and considering one-station coverage, thresholds are slightly higher than 10 Pa. During that period, any changes in the wind or temperature in the stratosphere generate signals of comparable attenuation which is consistent with the stable number of detections (Figure 5). During the transition between summer and winter, zonal winds reduce and reverse, yielding an increase of the thresholds up to ~100 Pa. Furthermore, from October to April, as the result of the unstable stratospheric duct, detection thresholds are highly variable, following the daily meteorological variations in the ECMWF model. At 1.6 Hz, variations in signal amplitude may be as large as 20 dB within periods of weeks. These fluctuations are less pronounced at lower frequency due to a weaker attenuation when the acoustic energy escapes to the thermosphere in upwind conditions.
The addition of the four experimental arrays improves the network performance in winter (Figure 10). Between December and February, at 1.6 Hz, upper threshold values are almost reduced by a factor of two (from ~40 to ~20 Pa and from ~80 to ~40 Pa for oneand three-station
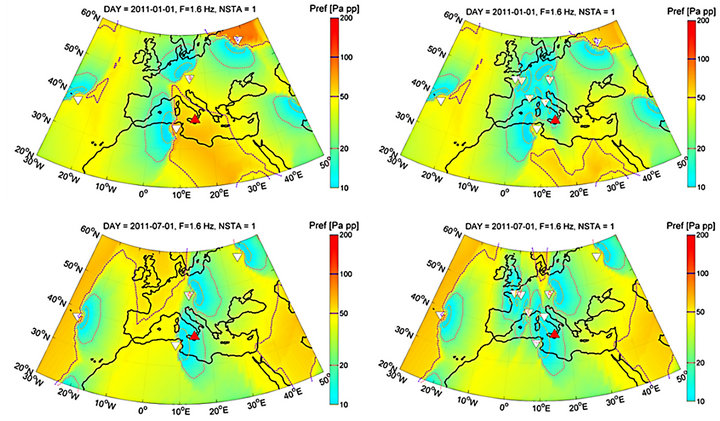
Figure 7. Comparison of the smallest detectable source amplitude in winter and summer at 1.6 Hz considering one-station coverage. Simulations are carried out with atmospheric conditions of January 1st, 2011 (top) and July 1st, 2011 (bottom) with the IMS network only (left) completed by AMT, OHP, CEA and Flers (right). Red and white triangles indicate the location of Etna and infrasound arrays, respectively. The color map codes the source amplitude at a reference distance of 1 km from the source in Pa peak-to-peak.
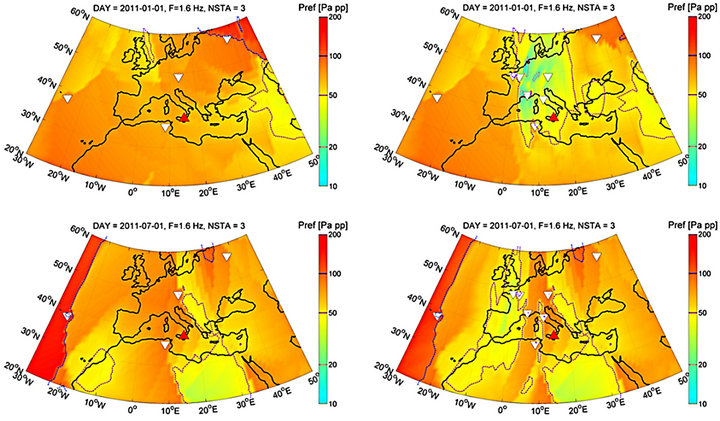
Figure 8. Comparison of the smallest detectable source amplitude in winter and summer at 1.6 Hz considering three-station coverage. Simulation conditions are those of Figure 7.
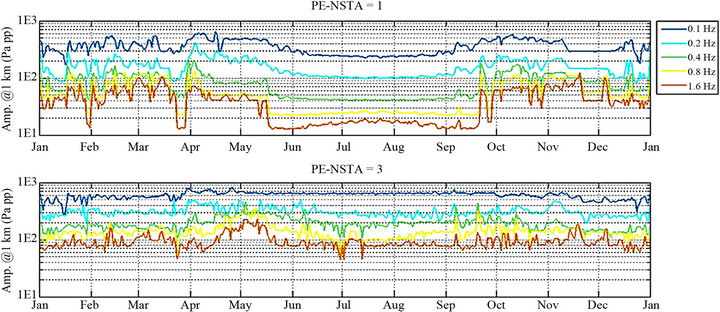
Figure 9. Yearly fluctuations of the smallest source amplitude of a source located at Etna, detectable by the IMS network with oneand three-station coverage, at frequencies of 0.1, 0.2, 0.4, 0.8, and 1.6 Hz.
coverage, respectively). As a result, for three-station coverage the detection capability is better in winter (30 - 40 Pa) than in summer (80 - 100 Pa), due to a most favorable geographical distribution of stations.
5. Summary and Conclusions
A detailed analysis of the multi-year infrasound observations at IS48 confirms that the propagation of signals from Etna is essentially controlled by fine-scale temporal variations of the stratospheric waveguide structure. The number of detections roughly follows an approximately binary variation with the effective sound speed ratio. This variation is in good agreement with recent global observations at other IMS stations indicating good detection capability as long as Veff-ratio is larger than 1. Using quasi-permanent signals from Mt. Etna, a frequency-
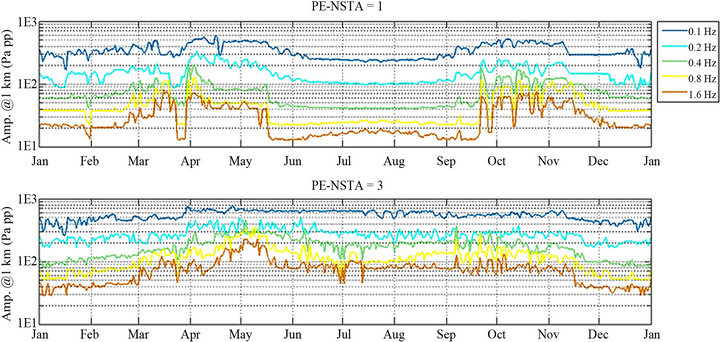
Figure 10. Yearly fluctuations of the smallest source amplitude of a source located at Etna, detectable by the IMS network completed by AMT, OHP, CEA and Flers, with oneand three-station coverage, at frequencies of 0.1, 0.2, 0.4, 0.8, and 1.6 Hz.
dependent modeling tool has been used to assess the performance of the European infrasound network to monitor its eruptive activity. In order to quantify in high resolution the spatial and temporal variability of the network performance, up-to-date station noise models and atmospheric specifications have been considered. The simulation results highlight the strong influence of the source frequency and short time scale variations of stratospheric winds on the network detection capability.
With the IMS network only, in summer, Etna is well detected by IS48 with a minimum detectable amplitude of 1 - 10 Pa, while in winter, thresholds increase up to ~100 Pa. Clear activity of Etna may also be observed below 1 Pa when strong westward stratospheric wind prevails. From October to April, as the result of the daily meteorological variations in the ECMWF model, thresholds are highly variable. These simulation results are in good agreement with the observed detection capability of IS48 considering the measured signal amplitude near Etna. The network performance is significantly improved in winter when adding the experimental arrays. Between December and February, thresholds decrease down to ~20 Pa and ~40 Pa for oneand three-station coverage, respectively. For three-station coverage, due to a most favorable geographical distribution of stations, the detection capability is better in winter (30 - 40 Pa) than in summer (80 - 100 Pa). The source coverage of the AMT station located in Italy, 640 km to the North of Etna, largely contributes to this impact.
Continuing such studies would help to enhance network performance simulations leading to substantial improvements in infrasound monitoring of remote volcanic regions. By incorporating time-varying station noise calculations, realistic atmospheric specifications and an operational monitoring of the state-of-health of the measurement system, the performance of any infrasound network could be evaluated in near real-time. Ongoing research on infrasound propagation may also lead to more realistic attenuation relations by using full-wave simulation methods and range-dependent atmospheric profiles. Additional work is thereby needed to validate simulation models using well calibrated explosion experiments as well as repeating sources. In particular, accurate comparisons between nearand far-field recordings from well-instrumented volcanoes would provide a statistical approach for testing the proposed attenuation relations. Moreover, considering specific regions of interest, the network design could be optimized by selecting a set of appropriate array locations ensuring detection with a minimum coverage of two stations throughout the year. It is expected that the proposed modeling approach would help optimizing the design of the future ARISE infrastructure coverage while considering its possible implementation into automated eruption detection systems to prevent eruption disasters and mitigate the impact of ash clouds on aviation.
6. Acknowledgements
The research leading to these results has been performed within the ARISE project (www.arise-project.eu) and received funding from the European Community’s Seventh Framework Programme (FP7/2007-2013) under grant agreement n˚ 284387.
REFERENCES
- L. G. Evers and H. W. Haak, “The Characteristics of Infrasound, Its Propagation and Some Early History,” In: A. Le Pichon, E. Blanc and A. Hauchecorne, Eds., Infrasound Monitoring for Atmospheric Studies, Springer, Berlin, 2010, pp. 3-27.
- J. B. Johnson and J. M. Lees, “Plugs and Chugs-Seismic and Acoustic Observations of Degassing Explosions at Karymsky, Russia and Sangay, Ecuador,” Journal of Volcanology and Geothermal Research, Vol. 101, No. 1, 2000, pp. 67-82. doi:10.1016/S0377-0273(00)00164-5
- D. J. Brown, C. N. Katz, R. Le Bras, M. P. Flanagan, J. Wang and A. K. Gault, “Infrasonic Signal Detection and Source Location at the Prototype Data Centre,” Pure and Applied Geophysics, Vol. 159, No. 5, 2002, pp. 1081- 1125. doi:10.1007/s00024-002-8674-2
- D. P. Drob, J. M. Picone and M. A. Garcés, “Global Morphology of Infrasound Propagation,” Journal of Geophysical Research, Vol. 108, No. D21, 2003.
- L. C. Sutherland and H. E. Bass, “Atmospheric Absorption in the Atmosphere up to 160 km,” Journal of Acoustical Society of American, Vol. 115, No. 3, 2004, pp. 1012-1032. doi:10.1121/1.1631937
- S. N. Kulichkov, K. V. Avilov, O. E. Popov, A. I. Otrezov, G. A. Bush and A. K. Baryshnikov, “Some Results of Simulation of Long-Range Infrasonic Propagation in the Atmosphere,” Journal of Izvestiya Atmospheric Oceanic Physics, Vol. 40, 2004, pp. 202-215.
- M. A. Garcés, M. Willis, C. Hetzer, A. Le Pichon and D. Drob, “On Using Ocean Swells for Continuous Infrasonic Measurement of Winds and Temperature in the Lower, Middle, and Upper Atmosphere,” Geophysical Research Letters, Vol. 31, No. 19, 2004. doi:10.1029/2004GL020696
- J. P. Mutschlener and R. W. Whitaker, “Some Atmospheric Effects on Infrasound Signal Amplitudes,” In: A. Le Pichon, E. Blanc and A. Hauchecorne, Eds., Infrasound Monitoring for Atmospheric Studies, Springer, Berlin, 2010, pp. 455-473.
- C. D. de Groot-Hedlin, M. A. H. Hedlin and D. P. Drob, “Atmospheric Variability and Infrasound Monitoring,” In: A. Le Pichon, E. Blanc and A. Hauchecorne, Eds., Infrasound Monitoring for Atmospheric Studies, Springer, Berlin, 2010, pp. 475-507.
- D. R. Christie and P. Campus, “The IMS Infrasound Network: Design and Establishment of Infrasound Stations,” In: A. Le Pichon, E. Blanc and A. Hauchecorne, Eds., Infrasound Monitoring for Atmospheric Studies, Springer, Berlin, 2010, pp. 29-75. doi:10.1007/978-1-4020-9508-5_2
- N. Brachet, D. Brown, R. Le Bras, P. Mialle and J. Coyne, “Monitoring the Earth’s Atmosphere with the Global IMS Infrasound Network,” In: A. Le Pichon, E. Blanc and A. Hauchecorne, Eds., Infrasound Monitoring for Atmospheric Studies, Springer, Berlin, 2010, pp. 77-117. doi:10.1007/978-1-4020-9508-5_3
- M. A. H. Hedlin, M. A. Garcés, H. Bass, C. Hayward, G. Herrin, J. Olson and C. Wilson, “Listening to the Secret Sounds of Earth’s Atmosphere,” Eos, Transactions American Geophysical Union, Vol. 83, No. 48, 2002, pp. 557-565. doi:10.1029/2002EO000383
- P. Campus and D. R. Christie, “Worldwide Observations of Infrasound Waves, in Infrasound Monitoring for Atmospheric Studies,” In: A. Le Pichon, E. Blanc and A. Hauchecorne, Eds., Infrasound Monitoring for Atmospheric Studies, Springer, Berlin, 2010, pp. 185-233. doi:10.1007/978-1-4020-9508-5_6
- P. P. Firstov and N. M. Kravchenko, “Estimation of the Amount of Explosive Gas Released in Volcanic Eruptions Using Air Waves,” Journal of Volcanology and Seismology, Vol. 18, No. 5, 1996, pp. 547-560.
- M. M. Morrissey and B. A. Chouet, “Burst Conditions of Explosive Volcanic Eruptions Recorded on Microbarographs,” Science, Vol. 275, No. 5304, 1997, pp. 1290- 1293. doi:10.1126/science.275.5304.1290
- L. Liszka and M. A. Garcés, “Infrasonic Observations of the Hekla Eruption of February 26, 2000,” Journal of Low Frequency Noise, Vibration, and Active Control, Vol. 21, No. 1, 2002, pp. 1-8. doi:10.1260/02630920260374934
- J. B. Johnson, “On the Relation between Infrasound, Seismicity, and Small Pyroclastic Explosions at Karymsky Volcano,” Journal of Geophysics Research, Vol. 112, No. B8, 2007. doi:10.1029/2006JB004654
- R. S. Matoza, D. Fee, M. A. Garcés, J. M. Seiner, P. A. Ramon and M. A. H. Hedlin, “Infrasonic Jet Noise from Volcanic Eruptions,” Geophysical Research Letters, Vol. 36, No. 8, 2009. doi:10.1029/2008GL036486
- M. Ripepe, S. De Angelis, G. Lacanna and B. Voight, “Observation of Infrasonic and Gravity Waves at Soufirère Hills Volcano, Montserrat,” Geophysical Research Letters, Vol. 37, No. 19, 2010. doi:10.1029/2010GL042557
- K. Kamo, K. Ishihara and M. Tahira, “Infrasonic and Seismic Detection of Explosive Eruptions at Sakurajima Volcano, Japan, and the PEGASAS-VE Early Warning System,” In: T. J. Casadevall, Ed., Volcanic Ash and Aviation Safety: Proceedings of the First International Symposium on Volcanic Ash and Aviation Safety, DIANE Publishing, Collingdale, 1994, pp. 357-365.
- M. A. Garcés, D. Fee, A. Steffke, D. McCormack, R. Servanckx, H. Bass, C. Hetzer, M.A. H. Hedlin, R. S. Matoza, H. Yepes and P. Ramon, “Capturing the Acoustic Fingerprint of Stratospheric Ash Injection,” EOS, Transactions American Geophysical Union, Vol. 89, No. 40, 2008, pp. 377-378. doi:10.1029/2008EO400001
- D. Fee, M. A. Garces and A. Steffke, “Infrasound from Tungurahua Volcano 2006-2008: Strombolian to Plianian eruptive Activity,” Journal of Volcanology and Geothermal Research, Vol. 193, 2010, pp. 67-81. doi:10.1016/j.jvolgeores.2010.03.006
- R. S. Matoza, A. Le Pichon, J. Vergoz, P. Herry, J. M. Lalande, H. Lee, I. Y. Che and A. Rybin, “Infrasonic Observations of the June 2009 Sarychev Peak Euption, Kuril Islands: Implications for Infrasonic Monitoring of Remote Explosive Volcanism,” Journal of Volcanology Geothermal Research, Vol. 200, No. 1-2, 2011, pp. 35-48. doi:10.1016/j.jvolgeores.2010.11.022
- A. L. Dabrowa, D. N. Green, A. C. Rust and J. C. Phillips, “A Global Study of Volcanic Infrasound Characteristics and the Potential for Long-Range Monitoring,” Earth and Planetary Science Letters, Vol. 310, No. 3, 2011, pp. 369-379. doi:10.1016/j.epsl.2011.08.027
- D. Fee and R. S. Matoza, “An Overview of Volcano Infrasound: From Hawaiian to Plinian, Local to Global,” Journal of Volcanology Geothermal Research, Vol. 249, 2012, pp. 123-139. doi:10.1016/j.jvolgeores.2012.09.002
- R. Cristofolini, S. Gresta, S. Imposa and G. Patanè, “Feeding Mechanism of Eruptive Activity at Mt. Etna Based on Seismological and Petrological Data,” In: C. Y. King and R. Scarpa, Eds., Modeling of Volcanic Processes, Springer, Berlin, 1988, pp. 73-93. doi:10.1007/978-3-322-89414-4_3
- A. J. L. Harris, J. B. Murray, S. E. Aries, M. A. Davies, L. P. Flynn, M. J. Wooster, R. Wright and D. A. Rothery, “Effusion Rate Trends at Etna and Krafla and Their Implications for Eruptive Mechanisms,” Journal of Volcanology Geothermal Research, Vol. 102, No. 3-4, 2000, pp. 237-269. doi:10.1016/S0377-0273(00)00190-6
- C. G. Newhall and S. Self, “The Volcanic Explosivity Index (VEI)—An Estimate of Explosive Magnitude for Historical Volcanism,” Journal of Geophysical Research, Vol. 87, No. C2, 1982, pp. 1231-1238. doi:10.1029/JC087iC02p01231
- D. Ponceau and L. Bosca, “Low-Noise Broadband Microbarometers,” In: A. Le Pichon, E. Blanc and A. Hauchecorne, Eds., Infrasound Monitoring for Atmospheric Studies, Springer, Berlin, 2010, pp. 119-139. doi:10.1007/978-1-4020-9508-5_4
- E. Marchetti, M. Ripepe and P. Poggi, “Low Cost Differential Pressure Transducer Used to Investigate Low Frequency Volcano Infrasound,” Infrasound Technology Workshop, Brasilia, 2009.
- Y. Cansi, “An Automated Seismic Event Processing for Detection and Location: The PMCC Method,” Geophysical Research Letters, Vol. 22, No. 9, 1995, pp. 1021-1024. doi:10.1029/95GL00468
- A. Le Pichon, R. S. Matoza, N. Brachet and Y. Cansi, “Recent Enhancements of the PMCC Infrasound Signal Detector,” Inframatics Newsletter, 2010. http://www.inframatics.org/
- R. Waxler and K. Gilbert, “The Radiation of Atmospheric Microbaroms by Ocean Waves,” Journal of Acoustical Society of American, Vol. 119, No. 5, 2006, pp. 2651-2664. doi:10.1121/1.2191607
- M. A. Garcés, M. Willis and A. Le Pichon, “Infrasonic Observations of Open Ocean Swells in the Pacific: Deciphering the Song of the Sea,” In: A. Le Pichon, E. Blanc and A. Hauchecorne, Eds., Infrasound Monitoring for Atmospheric Studies, Springer, Berlin, 2010, pp. 235-247. doi:10.1007/978-1-4020-9508-5_7
- M. Landès, L. Ceranna, A. Le Pichon and R. S. Matoza, “Localization of Microbarom Sources Using the IMS Infrasound Network,” Journal of Geophysical Research, Vol. 117, No. D6, 2012. doi:10.1029/2011JD016684
- A. E. Hedin, E. L. Fleming, A. H. Manson, F. J. Schmidlin, S. K. Avery, R. R. Clark, S. J. Franke, G. J. Fraser, T. Tsuda, F. Vial and R. A. Vincent, “Empirical Wind Model for the Upper, Middle and Lower Atmosphere,” Journal of Atmospheric and Solar-Terrestrial Physics, Vol. 58, No. 13, 1996, pp. 1421-1447. doi:10.1016/0021-9169(95)00122-0
- D. Norris, R. Gibson and K. Bongiovanni, “Numerical Methods to Model Infrasonic Propagation through Realistic Specifications of the Atmosphere,” In: A. Le Pichon, E. Blanc and A. Hauchecorne, Eds., Infrasound Monitoring for Atmospheric Studies, Springer, Berlin, 2010, pp. 541- 573. doi:10.1007/978-1-4020-9508-5_17
- S. Kulichkov, “On the Prospects for Acoustic Sounding of the Fine Structure of the Middle Atmosphere,” In: A. Le Pichon, E. Blanc and A. Hauchecorne, Eds., Infrasound Monitoring for Atmospheric Studies, Springer, Berlin, 2010, pp. 511-538.
- D. N. Green, J. Vergoz, R. Gibson, A. Le Pichon and L. Ceranna, “Infrasound Radiated by the Gerdec and Chelopechene Explosions: Propagation along Unexpected Paths,” Geophysical Journal International, Vol. 185, No. 2, 2011, pp. 890-910. doi:10.1111/j.1365-246X.2011.04975.x
- A. Le Pichon, L. Ceranna and J. Vergoz, “Incorporating Numerical Modeling into Estimates of the Detection Capability of the IMS Infrasound Network,” Journal of Geophysical Research, Vol. 117, 2012.
- L. G. Evers and P. Siegmund, “The Infrasonic Signature of the 2009 Major Sudden Stratospheric Warming,” Geophysical Research Letters, Vol. 36, No. 23, 2009. doi:10.1029/2009GL041323
- D. N. Green and D. Bowers, “Estimating the Detection Capability of the International Monitoring System Infrasound Network,” Journal of Geophysical Research, Vol. 115, No. D18, 2010. doi:10.1029/2010JD014017
- D. J. Brown, L. Ceranna, M. Prior, P. Mialle and R. Bras, “The IDC Seismic, Hydroacoustic and Infrasound Global Low and High Noise Models,” Pure and Applied Geophysics, 2012. doi:10.1007/s00024-012-0573-6
- R. W. Whitaker, T. D. Sandoval and J. P. Mutschlecner, “Recent Infrasound Analysis, Paper Presented at 25th Annual Seismic Research Symposium,” LANL, Tucson, 2003.