Open Journal of Fluid Dynamics
Vol.06 No.03(2016), Article ID:70389,11 pages
10.4236/ojfd.2016.63012
Study on a Comprehensive Energy-Saving Sail by CFD Method
Yanna Zheng1,2*, Dexing Liu3, Hongwei An2, Wenjia Sun1, Tiaojian Xu4
1School of Ocean and Civil Engineering, Dalian Ocean University, Dalian, China
2School of Civil, Environmental and Mining Engineering, University of Western Australia, Perth, Australia
3Zhejiang Windy Company Limited, Hangzhou, China
4State Key Laboratory of Coastal and Offshore Engineering, Dalian University of Technology, Dalian, China

Copyright © 2016 by authors and Scientific Research Publishing Inc.
This work is licensed under the Creative Commons Attribution International License (CC BY 4.0).
http://creativecommons.org/licenses/by/4.0/


Received: June 22, 2016; Accepted: August 29, 2016; Published: September 6, 2016
ABSTRACT
A comprehensive energy-saving sail (CES) has been proposed in order to promote energy saving and emission reduction from shipping. Wind energy is harvested for propulsion and electrical generator at the same time by a unique structure of CES. A CFD (Computational Fluid Dynamics) code is verified by a case of arc wind sail, and it is used to simulate the pressure and velocity around the CES. The results show that the outlet velocity of air tunnel Vo and wind velocity Vi serve as an equation Vo ≈ 1.31Vi, which means the CES can effectively improve the conversion efficiency. In addition, it is found that Vo increases with the tunnel diameter to some extend over which it will keep almost constant.
Keywords:
Energy-Saving Sail, Wind Power Generation, Wind-Assisted Propulsion

1. Introduction
Nowadays more than 90% main propulsion plants in modern ships are diesel engines and the fuel consumption produces a large amount of greenhouse gas and some other toxic gas which cannot be ignored anymore due to its strong environmental impact [1] . The IMO Marine Environment Protection Committee 65th session pushed forward with energy-efficiency implementation in May 2013 over again [2] . Hence, it is imperative to develop new devices to utilize renewable energy including wind energy which has great potential in development and application.
Abundant wind energy especially on the sea becomes an ideal energy resource as it
has lots of merits and great potential [3] . It would be great significance if wind energy can be harvested for shipboard electrical requirement. Energy saving effect by using renewable energy has been demonstrated by many experts and researchers. Shukla and Ghosh [4] showed that a certain sail-assisted ship can save 8.3% of its total energy consumption. Ren [5] [6] found out that sail-assisted ship can save fuel consumption and reduce exhaust gas emission by different approaches. Meanwhile, wind power generated on ships has also been proved to play a very efficient role in energy conservation. Sumi Kazuyoshi and Hikima Toshio [7] studied a coal cargo ship installed with wind energy conversion system and the result showed wind power generation can operate effectively and reduce greenhouse gas emission. Eirik and Sverre’s study proved a certain tanker with Vestas V39/600 wind turbine can saving 24.4% of its total oil consumption [8] . Since the traditional wind turbine used on land can generate power on board, the large facility occupied much more space which affects the stabilization of the vessel especially on extreme weather conditions. Therefore the shape of the generator on ship needs more improvement.
Even though the assisted sail and wind energy conversion are eco-friendly and can effectively utilize wind energy, the related researches and application are very limited due to the high costs of installation and maintenance as well as the stabilization of oil price. If economic benefit can be further increased by some innovation, it would be greatly helpful to popularize the wind-assisted sail and realize energy conservation and emission reduction in shipping.
Computational Fluid Dynamic (CFD), a kind of numerical methods, is widely used in the design process of sail due to its advantages and the improvement of computational capacity of computers. Viola [9] and Richard [10] analyze the hydrodynamic performance of two America’s Cup design candidates, and the verification and validation show that CFD is accurate and scientific; likewise, Jon and Herve, [11] Y. Tahara and Y. Masuyama [12] prove the reliability and many advantages of Reynolds-Averaged Navier-Stokes (RANS)-based CFD methods.
A comprehensive CES design has been proposed in order to promote shipping energy saving and emission reduction. The CES can utilize wind for propulsion and power generation at the same time by capturing wind energy with its unique designed structure. A CFD code has been verified by a case on arc wind sail, then the CES aerodynamic and the velocity relationship between input and output will be found out. The results show the CES can effectively improve the conversion efficiency.
2. The Comprehensive Energy-Saving Sail (CES)
According to aerodynamic principles, only a small part of energy is utilized for driving when wind blow over a sail, while most wind will flow around the sail with strong energy. With the unique structure of the CES, some of the collected air flow across sail internal and drive the turbine to generate electricity so as to utilize the wind in a comprehensive way. The structure of the CES is shown in Figure 1. The plane labelled as pmnq is the windward side of sail, and D, W and H represent the depth, the width and
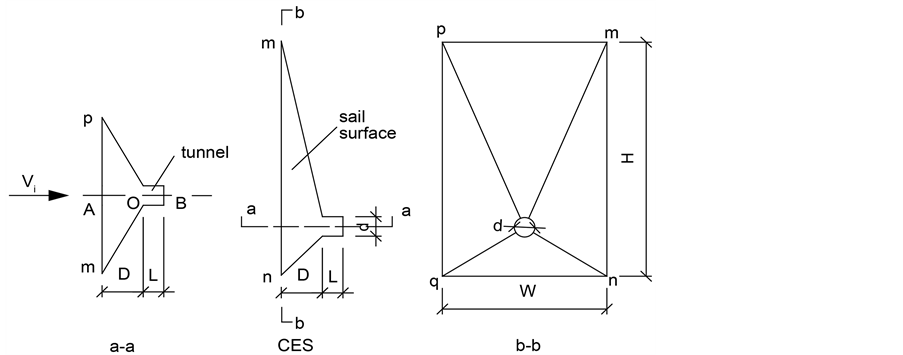
Figure 1. The diagram of the energy-saving sail.
the height of the sail, respectively. L and d are the length and the diameter of the tunnel, and Vi is the inlet velocity. A drilled hole connected with a tunnel is designed to guide the air into turbine for electrical generation.
It is well known that the efficiency of sail-assisted drive force and wind power generation depends on many affects, such as the velocity of the wind and the ship, the generator efficiency, angles between the sail and the direction of wind and ship, and so on. In this paper, character of the new structure―CES is the key point of the research, so it will be focused on the sail pressure and the outlet velocity of the tunnel under an ideal condition(the wind direction is same with the ship, and the angle of the sail is 90˚).
3. Numeral Model
3.1. Governing Equations
The regular wind velocity in the shipping line is less than 15 m/s for ocean-going ships. A sail-assisted ship must close its sail for safety when the wind velocity beyond the regular velocity. Hence, the Mach number when wind velocity Vo is 15 m/s is as follow:
 (1)
(1)
where U is speed of sound, which approximates 340 m/s at temperature of 15˚C. Therefore the Reynolds Averaged Navier-Stockes (RANS) were solved with the k-ε model. Sail aerodynamics can be considered as a relatively high Reynolds number and a low Mach number flow, and hence Navier-Stockes equations can be presented as follows:
 (2)
(2)
where Ui and Uj are, respectively, instantaneous velocities, ρ is the density of flow, p is the pressure, υ is coefficient of kinetic viscosity. Reynolds stress tensor  is the mean of
  .
.
The continuity Equation defined as follows:
 (3)
(3)
Boussines q Assumption is used for calculation of viscosity model that turbulent stress and the viscous shearing stress share a similar effect, hence turbulent stress which in direct proportion to mean velocity gradient can defined as follows:
 (4)
(4)
where ∂ij is Kronecher delta (when i = j, ∂ij = 1 ; when i ≠ j, ∂ij = 0), k is turbulent energy, νt is the coefficient of kinetic viscosity defined as follows:
 (5)
(5)
where Cμ is an empirical constant and k and turbulent dissipation ε respectively defined as follows:
 (6)
(6)
 (7)
(7)
The Traffic Flow (TF) equation of k and ε can be presented as follows:
 (8)
(8)
where, ∂k, σz, cz1, cz2 are invariable and can be obtained from comparison between experiment and calculation, and the production term of turbulent kinetic pk can be defined as follows:
 (9)
(9)
Equations (2)-(9) are the components of the governing equation of viscous flow.
3.2. Domain and Boundary Conditions
The diagram of the CES is shown in Figure 2(b). The computational domain is defined as 132 by 104 meters region GIJK as shown in Figure 2(a) to obtain a fully developed flow. The detail size of the sail can be found in Table 1.
In Figure 2, GK is the inlet boundary and the velocity can be defined as:
 (10)
(10)
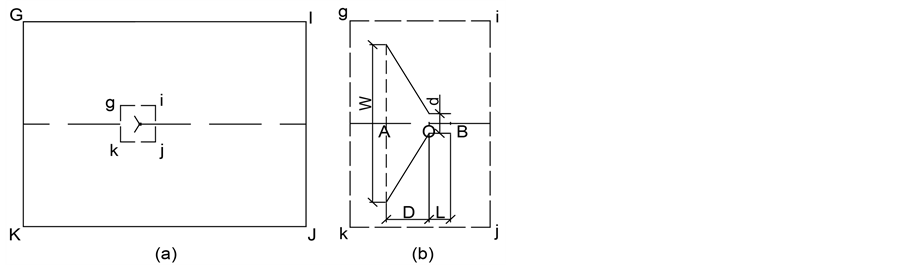
Figure 2. Computational domain of energy-saving sail.

Table 1. Calculate parameters.
where u is the lateral component of inlet velocity, and v is the longitudinal component of inlet velocity; u0 is the initial velocity.
GI, IJ, JK are all pressure outlet boundaries, and pressure change can be defined as:
 (11)
(11)
The sail and tunnel are regarded as walls, on which no energy and matter exchange happens. The velocities and temperature can be defined as follows:
 (12)
(12)
4. Numerical Simulation Verification
An arc wind sail is simulated firstly to verify the accuracy of numerical model. The diagram of the sail is shown in Figure 3. Computed pressures were compared with the reference data [13] which turned out to be good agreements.
Here are the specific parameters of the typical case: C = 1.0 m, V∞ = 1.0 m/s, slack ra-
tio ε = 0.0154 (  ), the wind attack angle α is −4˚, pressure coefficient Cp is the
ratio between sail surface pressure and atmosphere pressure.
Figure 4 shows the relationship of the coefficient Cp both on leeward and windward of the sail with the positon on sail. It can be seen that the comparison between the calculated output and the reference value satisfied on most of the sail section which means that it is feasible to use this CFD model for wind sail simulation.
5. Results and Discussion
According to the structure and function of the CES, it can be known that the efficiency of wind turbine is significantly influenced by outlet velocity of the tunnel and the drive force of sail is largely depended on wind pressure on the sail. Hence, both the pressure and velocity in the flow field around the CES will be mainly simulated. Since the CES is
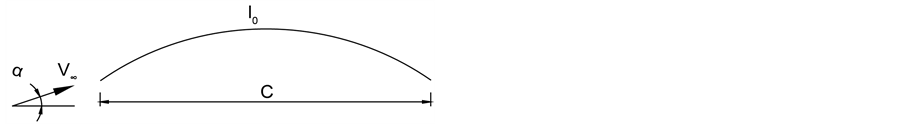
Figure 3. Diagram of arc wind sail.
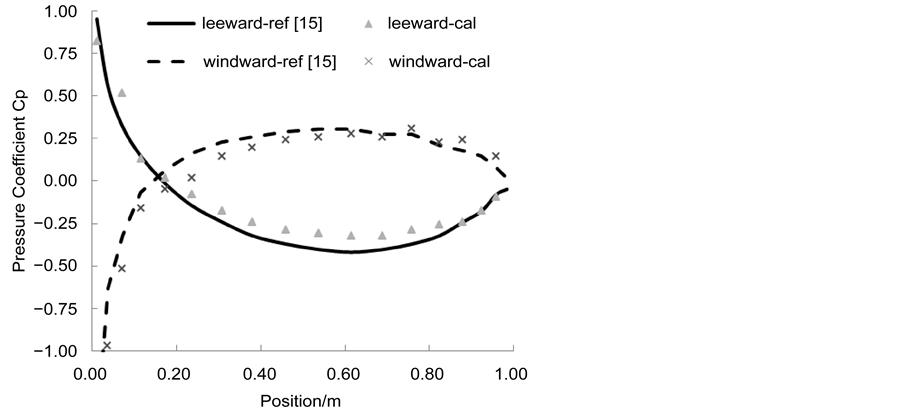
Figure 4. Comparison of pressure coefficient on arc wind sail.
fixed on the dock and the calculation domain as well, the input wind velocity is corresponding to the relative velocity between the wind and the sail. And in order to simplify the numerical condition, the wind attack angle is supposed to be 0 degree, which means the wind direction is perpendicular to sail surface (labelled as pmnq in Figure 1). The sizes of the calculation domain and the sail are shown in Table 1. The depth of CES is D = 2 m, the length is L = 1 m, the diameter of the tunnel is d = 1 m, and the thickness of CES is negligible. The width of CES is W = 8 m, which is 48 m away from inlet boundary GK and 80 m away from the outlet boundary IJ.
5.1. General Flow Field
The simulation of the flow field around the CES is a dynamic process initial and then it becomes stable gradually. In the initial phase, the differential pressure (ΔP) between the windward and leeward is much larger when the air flow has just arrived CES and the leeward pressure has not changed. With part of the air flow around the CES, the leeward pressure increases, and ΔP decreases to a certain value. At the same time, part of air flows through the tunnel and has reached a certain velocity.
The contour of pressure and velocity on stabilization phase are presented in Figure 5 and Figure 6. In Figure 5, it can be seen that the pressure increases gradually from inlet boundary toward the CES and the largest differential pressure appears on the sail surface since the maximum and the minimum are on the windward and leeward respectively,

Figure 5. Contour of pressure (Pascal).
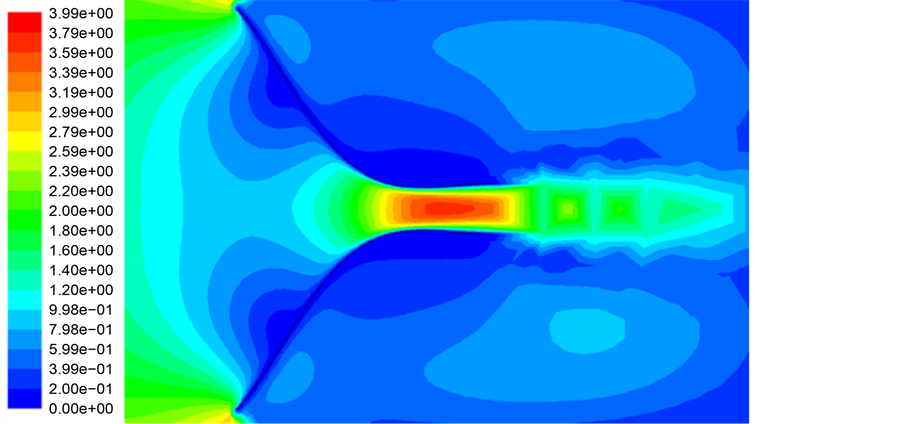
Figure 6. Contour of velocity (m/s).
which will provide a significant wind force as propulsion. Figure 6 shows the velocity contour within the red square domain of Figure 5. Because of the existence of large differential pressure between the inlet and outlet of tunnel, the velocity in the tunnel increases sharply and reaches a maximum much larger than the inlet velocity. The amplified velocity is much useful for the energy generator behind the tunnel outlet.
5.2. Input Velocity Effect
The simulation results of relative wind speed between 2 m/s to 15 m/s indicates that both the air velocity in tunnel outlet and the pressure upon CES changes along with variation of the input velocity. The air velocity in tunnel outlet escalates with the augment of wind speed, and the increment of velocity become larger when the wind speed increases.
Figure 7 shows the relationship between wind speed (Vi ) and the velocity in tunnel outlet (Vo). From Figure 7, it can be seen that Vo is in direct proportion to Vi, and the fitting curve shows their approximate relationship as follows:
Vo ≈ 1.31Vi (13)
From the theorem of kinetic energy, the change of the kinetic energy from input to output will be written as follows:
 (14)
(14)
From Equation (13) and Equation (14), it can be deduced that  , which means that airflow kinetic energy increase 72% after getting through the CES. So the turbine efficiency is supposed to be significantly improved when CES is utilized, even though energy loss due to the friction is taken into consideration.
The average differential pressures (ΔP) on the CES surface and input relative wind speeds are presented in Figure 8. The fitting curve shows that differential pressure increases linearly with the square of input speed and the pressure exists even in a gentle breeze. Take a 76,000 DWT Panama bulk carrier as an example. The carrier bears a resistance of 533 kN, when sailing in 10 knots. The CES with an active areas (A) of 101.7 m2 can provide 26.15 kN drive force which approximate to 5% of propulsive force. The adding resistance by CES can be neglected because the carrier’s additional draught approximates to zero. Therefore, from the aspect of assisted propulsion, using CES may be an effective approach.
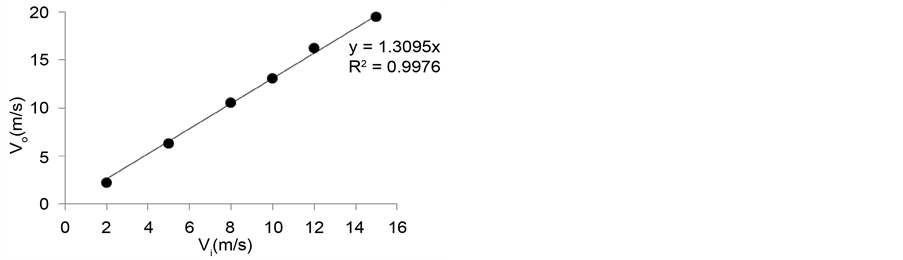
Figure 7. Velocities relationship between input and output.
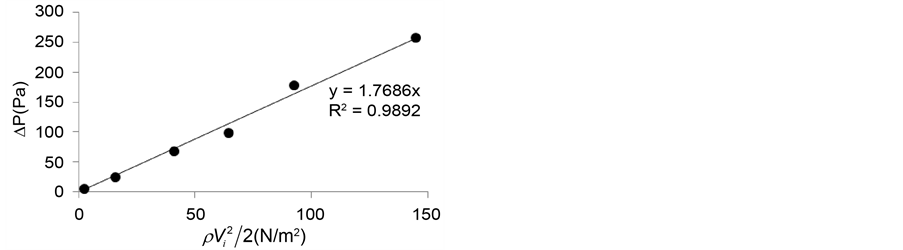
Figure 8. Relationship between  and ∆P.
5.3. Tunnel Diameter Effect
The tunnel, as an important component of the CES, has great effect on the outlet speed which directly determines the energy conversion. Therefore, different tunnel diameters (d) are investigated to find its effect to the outlet velocity (Vo). Figure 9 shows their relationship under different input speed conditions of 8 m/s (the most frequent velocity) and 15 m/s (high velocity), where the tunnel length L is a fixed value of 2 m.
From the two curves in Figure 9, it can be seen that Vo increase exponentially with the tunnel diameter when the diameter ratio is less than 0.6, and then its increment slows down when the axis value increase from 0.6 to 0.8, and there is little variation when d/L is larger than 0.8. Comparing the two curves, it can be found that the frequent and the high velocity seem alike all the time especially with thicker tunnel. From Figure 9 we can also see that in order to obtain Vo much more than Vi(Vo/Vi > 1), d/L should larger than 0.35, which means the tunnel begin to work to accelerate the air flow in it. Since the ratio d/L is more than 0.8, Vo will not increase substantially, so in this case 0.8 is an optimized ratio.
6. Conclusions
A verified CFD code has been used to simulate the flow field around the comprehensive energy-saving sail (CES), and the numerical analysis comes to the following conclusions:
The CFD code can effectively used for numerical investigation of sail aerodynamics.
The unique structure of CES can utilize wind energy in an efficient way, and the CES can increase the wind speed for turbine which can significantly improve generating efficiency.
A tunnel diameter-length ratio of 0.8 is sizable and efficient in the case of this paper.
The flow fields investigated depend on the sail shape, hence different results might be found by different parameter. In addition, the study of comprehensive energy-saving sail is an interdisciplinary work, the paper only focuses on the sail aerodynamic of sail
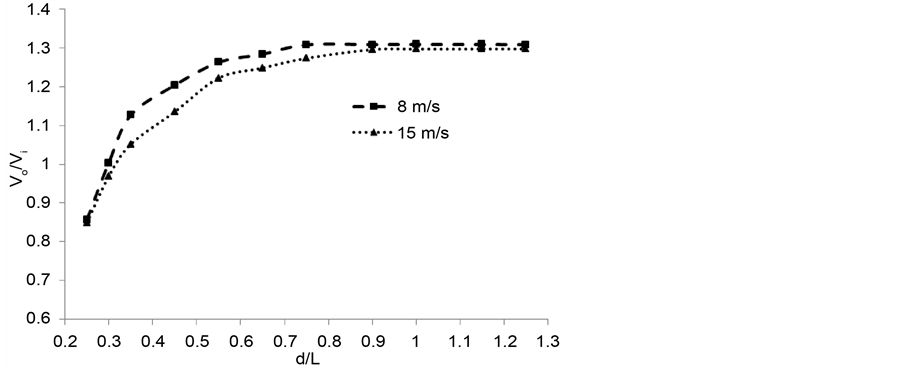
Figure 9. Relationship between d/L and Vo/Vi.
and more future works should be done such as structure optimization of CES, selection of turbine and wind generator, effect on ship stability and maneuvering capability. Finally, follow-up experiment or test is necessary since the limitation of CFD code.
In conclusion, the research and application of sail-assisted ship have been a negative correlation with the fuel prize over the past half century and few people followed up the research when fuel prize is stable, and the wind generator on ship was barely seen in the world. Nevertheless, with the exhausting of fossil energy and the increasing study on wind and other renewable energy, wind applications on ship would be indispensable in future.
Fund
This work was financially supported by the Nation Natural Science Foundation of China (51109022 and 51409037), the China Public Project of Marine Welfare (201405025) and China Scholarship Council (201404680006).
Cite this paper
Zheng, Y.N., Liu, D.X., An, H.W., Sun, W.J. and Xu, T.J. (2016) Study on a Comprehensive Energy- Saving Sail by CFD Method. Open Journal of Fluid Dynamics, 6, 145-155. http://dx.doi.org/10.4236/ojfd.2016.63012
References
- 1. Blasco, J., Durán-Grados, V., Hampel, M., et al. (2014) Towards an Integrated Environmental Risk Assessment of Emissions from Ships’ Propulsion Systems. Environment International, 66, 44-47.
http://dx.doi.org/10.1016/j.envint.2014.01.014 - 2. IMO (2013) Marine Environment Protection Committee 65th Session Pushes forward with Energy-Efficiency Implementation.
http://www.imo.org/MediaCentre/PressBriefings/Pages/18-MEPC65ENDS.aspx - 3. Banos, R., Manzano-Agugliaro, F. and Montoya, F.G. (2011) Optimization Methods Applied to Renewable and Sustainable Energy: A Review. Renewable and Sustainable Energy Reviews, 15, 1753-1766.
http://dx.doi.org/10.1016/j.rser.2010.12.008 - 4. Shukla, P.C. and Ghosh, K. (2009) Revival of the Modern Wing Sails for the Propulsion of Commercial Ships. International Journal of Mathematical, Computational, Physical and Quantum Engineering, 3, 5-10.
- 5. Ren, H.Y., Sun, P.T., Li, T., Wu, G.T. and Huang, L.Z. (2012) Simulation on Disturbance Characteristics of Marine Diesel Engine with Wing-Assisted System. Advanced Materials Research, 347-353, 3564-3570.
- 6. Ren, H.Y., Sun, P.T., Zhao, Y.T., Huang, L.Z., Wang, H.M. and Yang, B.S. (2012) Research on the Wing’s Thrust of “Wenzhuhai” Ship with Install Wing. Advanced Materials Research, 462, 307-312.
http://dx.doi.org/10.4028/www.scientific.net/AMR.462.307 - 7. Sumi, K., Hikima, T., Hashimoto, T., et al. (2001) A Study on the Application of Wind Energy Conversion System to a Coal Cargo Ship. Journal of the Japan Institution of Marine Engineering, 36, 160-167.
http://dx.doi.org/10.5988/jime.36.160 - 8. Bockmann, E. and Steen, S. (2011) Wind Turbine Propulsion of Ships. Proceedings of Second International Symposium on Marine Propulsors, Hamburg, June 2011.
- 9. Viola, I.M. (2009) Downwind Sail Aerodynamics: A CFD Investigation with High Grid Resolution. Ocean Engineering, 36, 974-984.
http://dx.doi.org/10.1016/j.oceaneng.2009.05.011 - 10. Viola, M. and Flay, R.G. (2011) Sail Pressures from Full-Scale, Wind-Tunnel and Numerical Investigations. Ocean Engineering, 38, 1733-1743.
http://dx.doi.org/10.1016/j.oceaneng.2011.08.001 - 11. Paton, J. and Morvan, H. (2009) Using Computational Fluid Dynamics to Model Sail Interaction—The “Slot Effect” Revisited. Journal of Wind Engineering and Industrial Aerodynamics, 97, 540-547.
http://dx.doi.org/10.1016/j.jweia.2009.08.005 - 12. Tahara, Y., Masuyama, Y., Fukasawa, T., et al. (2012) Sail Performance Analysis of Sailing Yachts by Numerical Calculations and Experiments. In: Hector Juarez, L., Ed., Fluid Dynamics, Computational Modeling and Applications. InTech Open Access Publisher, 116-117.
http://dx.doi.org/10.5772/2403 - 13. Shao, H.Z. and Xiong, Z.M. (1990) Theoretical and Experimental Study of Sail Aerodynamic Performance. Journal of China Shipbuilding and Marine Engineering, 9, 103-132 (in Chinese).