Open Journal of Fluid Dynamics
Vol.3 No.1(2013), Article ID:29362,8 pages DOI:10.4236/ojfd.2013.31001
A New Surfactant Flooding Model for Low Permeability Reservoirs
Exploration &Production Institute, Daqing Oil Company, Heilongjiang, China
Email: *yongwei.li1976@gmail.com
Received November 28, 2012; revised December 30, 2012; accepted January 12, 2013
Keywords: Surfactant Flooding; Simulation; Threshold Pressure; Pilot Test
ABSTRACT
Surfactant as a successful Enhanced Oil Recovery (EOR) agent has been widely used in many mature reservoirs. This research focuses on the description of surfactant solution at low permeability condition. A new three-dimensional, twophase, three-component surfactant simulator is presented. The simulator is based on the non-Darcy flow characteristics of surfactant flooding in the low permeability formations. The change of threshold pressure and influences of surfactant on convection, diffusion, adsorption, and retention, are all considered. A new equation for the calculation of surfactant adsorption is employed, which can significantly promote the matching degree between the mathematical model and field practice. The design of this new simulator is to help the decision-making in the reservoir engineering analysis of surfactant EOR projects, to face the challenge of the design of injection schemes, to assist the surfactant screening, to screen and assess laboratory and field data and their effect on the performance predictions, and to find the optimal methods of field development.
1. Introduction
The modeling and simulation of the surfactant flooding process have been studied for a few decades since the late 1960s. Currently, a few commercial simulators are available for polymer injection, like Eclipse (surfactant), CMG (Stars), VIP, Grand, etc. Over several decades of development, these simulators have been capable to handle the polymer injection in most conventional reservoirs. The injection of surfactant is, in a sense, to reduce the interfacial tension between oil and water phases. The injection is restricted by quite a few parameters. The design of this new simulator is to help the decision-making in the reservoir engineering analysis of surfactant EOR projects, to face the challenge of the design of injection schemes, to assist the surfactant screening, to screen and assess laboratory and field data and their effect on the performance predictions, and to find the optimal methods of field development.
Oil-production from Enhanced Oil Recovery projects continues to supply an increasing percentage of the world’s oil. Taber, et al. [1] estimated that more and more of the worldwide oil production would come from EOR. That number has continued to increase and in the future it is expected that EOR will eventually produce the majority of the world’s oil. In China, the use of polymer in Daqing has already obtained a great success. Surfactant functions work by adding certain concentrations of surfactants to injection water to reduce the interfacial tension (IFT) between displacing and displaced phases [2,3]. Flow of the surfactant formulation through the reservoir allows the trapped oil droplets to deform and become mobile oil. These oil droplets then coalesce and form a new flowing oil bank. In the process of surfactant flooding, the surfactant adsorbs onto the oil-water interface and surface of rock which may also make a wetability change of rock [4]. The experiment shows that the oil drops are becoming easier to deform when the oil-water interfacial tension reduces, so the resistant force lowers when the oil drops flow through the pore throat. Increase of dispersion of crude oil in the water. With the decrease of IFT, the crude oil can disperse in the surfactant solution, meantime, the surface of oil drops are charged after adsorption, so the oil drops are not easy to stick onto the surface of rock particles.
Low permeability reservoirs account for a considerable reserve and play an important role in the stable output in Daqing. The pilot test in Daqing shows surfactantflood can be a good candidate of the enhanced oil recovery for the low permeability reservoirs. The indoor experiments show that the surfactant flooding can lower the threshold pressure and increase the oil recovery efficiency of low permeability oilfield [5,6]. Several pilot tests of surfactant flooding were carried out in Daqing’s low permeability oilfields, such as Yushulin and Chaoyanggou oilfields, the objectives of pilot tests are to reduce the injection pressure, to increase the injection rate, and to enhance the oil recovery [7-9]. The experimental screening of surfactant was finished, but the theoretical study on surfactant flooding in low permeability reservoirs is limited; the reservoir simulation software that includes the threshold pressure is not reported. Because of the existence of threshold pressure, current commercial simulators cannot exactly reflect the flow of surfactant solution in the low-perm formations. In order to overcome this obstacle, the investigation of a simulator for surfactant floods with threshold pressure was conducted.
Because the cost of surfactant is comparatively high, the amount of surfactant used is one of the biggest concerns and should be first determined for the field application to obtain the maximum economic benefit. Thus, it is very important to conduct reservoir numerical simulation study. On the basis of compositional model, a mathematical model of surfactant flooding was established, in which the changes of threshold pressure and relative permeability which are caused by surfactant flooding [3,10], and influence of adsorption and retention of surfactant in the reservoir are included in the model. This model was used to optimize the injection plan for pilot test of surfactant flooding in Chaoyanggou oilfield of Daqing to provide a theoretical basis of decision for the development of oilfield.
2. Modeling
2.1. Mathematical Model
2.1.1. Feature and Assumption
1) Two phases, three components (oil, water, and surfactant);
2) Non-Darcy flow of oil and water;
3) The reservoir rock and fluids compressible;
4) Anisotropic and heterogeneous reservoir;
5) Description of threshold pressure change;
6) Consideration of convection, diffusion and adsorption on rock;
7) Influences of capillary force and gravity effect;
8) No salinity considered (Low salinity in Chaoyanggou reservoirs)
2.1.2. Continuity Equations
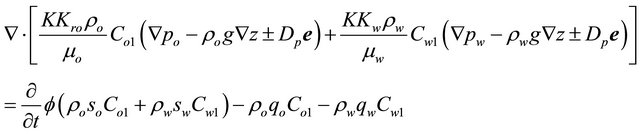
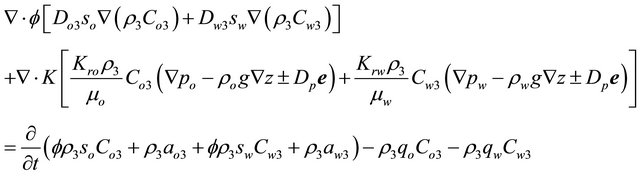
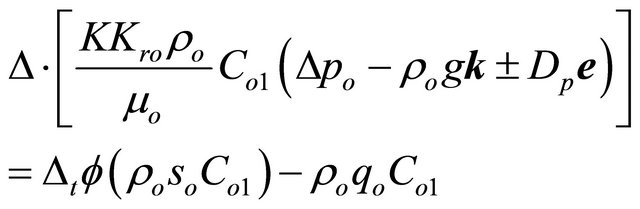
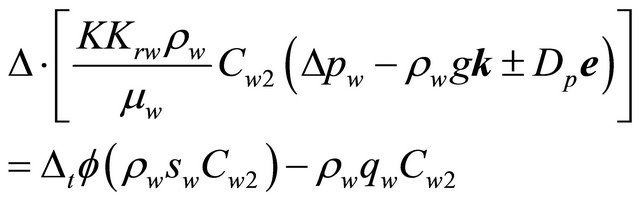
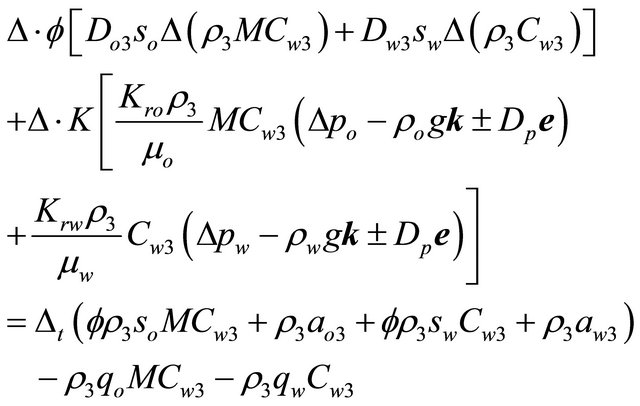
The flow equation of two-phase, three-component is used to describe the process of surfactant flooding [11]. The downward direction is positive direction of z-axis, then the mathematical model of each component is as follows:
 (1)
(1)
 (2)
(2)
 (3)
(3)
 (4)
(4)
 (5)
(5)
 (6)
(6)
where subscript 1 denotes the oil component, subscript 2 stands for the water, and sub3 represents the surfactant.
For the process of surfactant flooding, it is assumed that the volume percentage of water component in oleic phase,  , is zero, and the volume percentage of oil component in aqueous phase,
  , is zero too, and
 . Then the above model can be simplified, and the block-center difference can be used to solve equation.
2.2. Numerical Solution of Mathematical Model
2.2.1. Differential Equations
 (7)
(7)
 (8)
(8)
 (9)
(9)
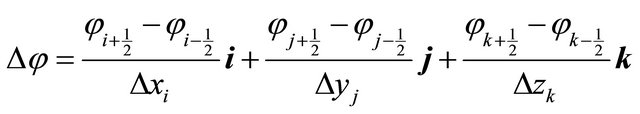
where  is spatial difference operator,
 is time difference operator,
 ;
;  is unit vector,
 .
.
The choose of positive or negative sign for threshold pressure is determined by the signs of , the signs between them are always opposite to guarantee that the threshold pressure gradient is always the resistance force.
2.2.2. Model Solution
The method of implicit pressure, explicit saturation, and implicit concentration is used to solve equation, the steps are as follows:
Difference Equations (7), (8), (4) and (5) are used to implicitly calculate pressure;
The values of pressure are substituted into difference Equation (8) to explicitly calculate values of water saturation;
Then substituting pressure value  and value of saturation
  into Equations (6) and (9) to implicitly compute values of concentration
 .
.
2.3. Adsorption Treatment
The isothermal equation of Langmuir adsorption is used to describe the adsorption process. The effects of salinity, concentration of surfactant and rock permeability on adsorption are considered. The isothermal equation is (Liao et al., 1999):
 (10)
(10)
The concentration  in isothermal equation of Langmuir adsorption is the average concentration of surfactant in different phases of liquids in pores. This will cause major error in calculation. Because the saturations of oleic, and aqueous phases are always changing in the process of surfactant flooding, the concentration of surfactant in each phase is different and changes with the time. Therefore, in this study, the adsorption from oil phase and adsorption from water phase are calculated separately. A function
  is used to adjust the adsorption calculation due to the partial contact between solid particles and phase i. The calculation equation of surfactant adsorption in oleic phase and aqueous phase are:
 (11)
(11)
 (12)
(12)
where:  and dimensionless function
  are determined by experiments, and they meet the following conditions:
 .
.
2.4. Relative Permeability Curve
The mechanism of surfactant flooding is to reduce interfacial tension (IFT) between oil phase and water phase. Macroscopically, this mechanism reflects that relative permeability curve of oleic phase is moved up. Therefore, correct representation of relationship between the oleic and aqueous phases’ relative permeability and surfactant concentrations is very important for accurate simulation of surfactant flooding. In the process of simulator development, two methods to determine the relative permeability of oil and water phases at different surfactant concentrations are provided. The first is obtained through the interpolation of relative permeability curves which are measured at the various surfactant concentrations. The second method is the theoretical calculation equation. The interpolation method is based on the experimental data, and can represent the real situation more accurately. Therefore, this method is recommended. However the interpolation method also needs large amount of experimental data. When the enough experimental data are not available, the theoretical formula can be used. The following is the introduction of interpolation method.
Inputting N different relative permeability curves determined at different surfactant concentrations into the simulator, assuming that the surfactant concentration corresponding to ith relative permeability curve is . The curve is treated with saturation normalization:
 (13)
(13)
When the surfactant concentration in some place of oil reservoir is , which is between
  and
and , the interpolation method is applied to calculate relative permeability at
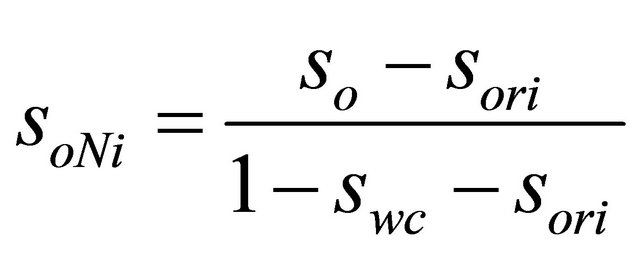
 . First, the residual oil saturation
  corresponding to this concentration is calculated:
 (14)
(14)
The value of  is used to consult the ith and
  relative permeability curves to obtain the relative permeability of oleic phase,
  and
and , the oil phase relative permeability corresponding to concentration
  and saturation
  is:
is:
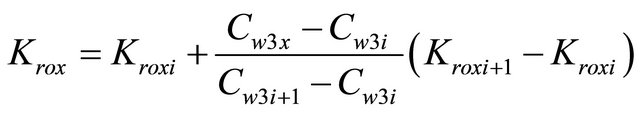 (15)
(15)
The interpolation method of relative permeability of water phase is the same as the oil phase.
3. Integrated Study inChao-522
The pilot is located in the Chao 82-152 well block. There are 4 injecting and 10 production wells in the pilot area. The average permeability is .The geological reserve is
 . The comprehensive water cut is 82.9% at the end of history match. The average daily oil production rate per well is
 . Four injection wells started injecting water since January of 2002. In January of 2005, just before the start of pilot test, the designed water injection rate was
 ; the actual water injection was
 .The designed injection rate was still not reached even the bottom hole flowing pressure of water injection wells was up to 23.4 MPa which was close to the fracturing pressure (Tables 1 and 2). The shortage of injection made serious problems on the pressure maintenance and stable oil output. Thus, this block was selected as the pilot test of surfactant flooding, aiming to reduce the injection pressure and to increase injection.
3.1. Core Flooding Tests
In order to fully understand the non-Darcy flow behaviors of surfactant solution in low permeability reservoirs, the core flooding tests of surfactant injection on natural cores were conducted. The chosen displacing-liquid was solution of nonionic alkanol acid amide surfactant and auxiliary agent, which aimed to reduce the interfacial tension between crude oil and water of Chaoyanggou oilfield to reach ultra-low interfacial tension (IFT). The experimental results are shown in Table 1. As shown in Table 3, after injecting the displacing liquid of surfactant, the pressure of chase water injectionwas reduced by 40% compared with that of fresh water injection before the surfactant slug. Thus the injection pressure can be significantly dropped by the participation of surfactant, compared with secondary water injection. The results also showed the recovery efficiency was enhanced by 5.12%. In order to further estimate the effects of surfactant concentration on the threshold pressure gradient, the relationship between surfactant concentration, water saturation and threshold pressure gradient were measured, shown in Figure 1. From Figure 1, we can find that, with the increase of surfactant concentration and water saturation, the threshold pressure gradient reduces gradually, but the decrease extent becomes smaller.
3.2. Simulation Study
A simulator was developed based on the above theoreticcal model, and then it is applied to pilot test of surfactant flooding in Chao 522 Block of Chaoyanggou low permeability oilfield. Before numerical simulation of surfactant injection, the history match of water flooding was first conducted. The calculated water saturation and pressure field are initial values for the surfactant flooding research, the predicted ultimate recovery efficiency of conventional water flooding is 32.34% of OOIP.
The pilot test is located in the Chao 82-152 well block, there are four injecting wells and 10 production wells, the average permeability is , the geological reserve is
 , the comprehensive water cut is 82.9%, the average daily oil production rate per well is
 . Four injection wells were put into production in January of 2002, as of January of 2005, just before the start of pilot test, the allocated water injection rate is
 , the actual water injection is
 , the bottom hole flowing pressure of water injection wells is 23.4 MPa, which is close to the fracturing pressure, but the allocated injection rate cannot be achieved (Figure 2), therefore, this block was selected as the pilot test of surfactant flooding, aiming to reduce the injection pressure and to increase injection
3.2.1. Determination of Surfactant Concentration
The calculation results of development indexes and economic indexes of surfactant injection schemes are shown in Table 4. With the increase of surfactant concentration, the bottom hole flowing pressure of injection wells decreases, the water injection rate increases, the recovery efficiency increases, but the extent of increase becomes
Table 1. Comparison of water injection history for Chao-522.
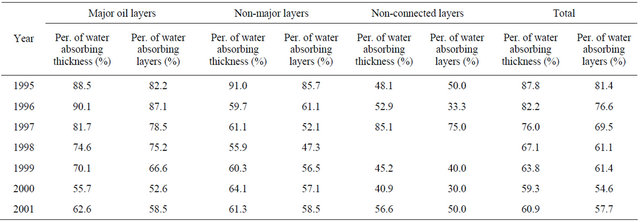
Table 2. Classification of water injection for Chao-522.
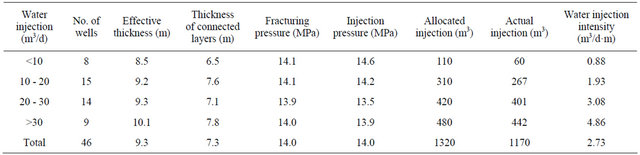
Table 3. Experimental results of core flooding.
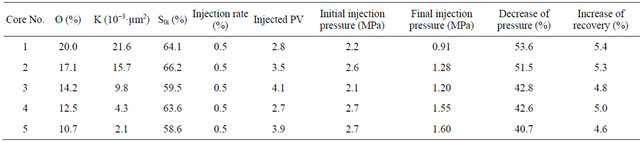
Table 4. Net benefit of different schemes in condition of different slug concentration.

smaller. Because the production cost increases due to the increase of amount of surfactant used, based on the economic evaluation, the reasonable slug concentration is 1.0%.
3.2.2. Optimization of Surfactant Slug Size
As the surfactant concentration is kept at 1.0% of Scheme 2, the slug volumes of Plans 5 - 8 are 0.05 PV, 0.10 PV, 0.20 PV and 0.30 PV, respectively, the calculation results of development indexes and economic indexes are summarized in Table 5. As shown in Table 5, with the increase of slug volume, recovery efficiency also increases, but the increase becomes smaller, and the cost goes up. Through the economic evaluation, the reasonable slug volume is 0.10 PV of Scheme 6, the net benefit is the largest.
3.2.3. Injection Process
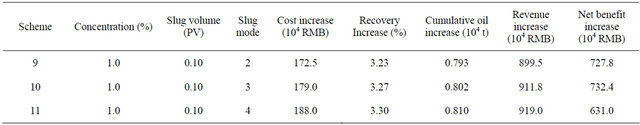
Schemes 8 and 9 are based on the Scheme 6, the injection slugs are 2, 3 and 4, respectively, the calculation results are shown in Table 6. The results show that the effect of multiple slugs is better than that of one slug injection, this is because the multi-slug injection mode can prolong the displacement time of surfactant, reducing the inefficient flow of surfactant in the reservoir. Comparing multi-slug injection mode with the one slug injection mode, the former has higher recovery efficiency, this is because the multi-slug injection mode can prolong the displacement time of surfactant, reducing the ineffective flow of surfactant in the reservoir. But the multiple slug injection mode has complicated operation process, which increases the operation cost, considering that there is no obvious difference in economic benefit between Scheme 9 and Scheme 10, in order to have an easier field operation, the Scheme 9 is chosen.
3.3. Pilot Testing
Based on the results of the field scale simulation, the pilot test was performed. According to the optimized surfactant injection process, the most favorable surfactant
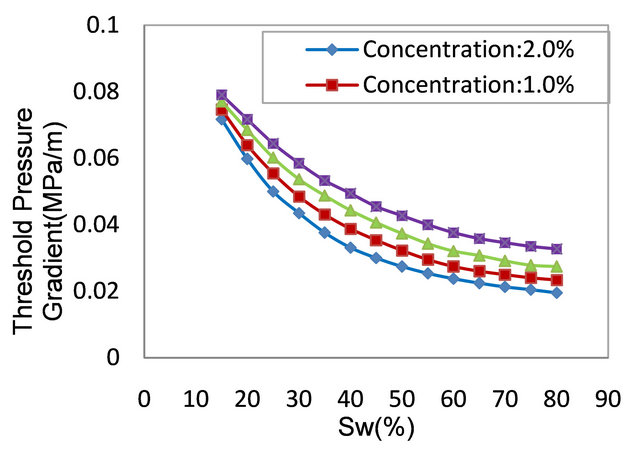
Figure 1. Relation between threshold pressure and surfactant.
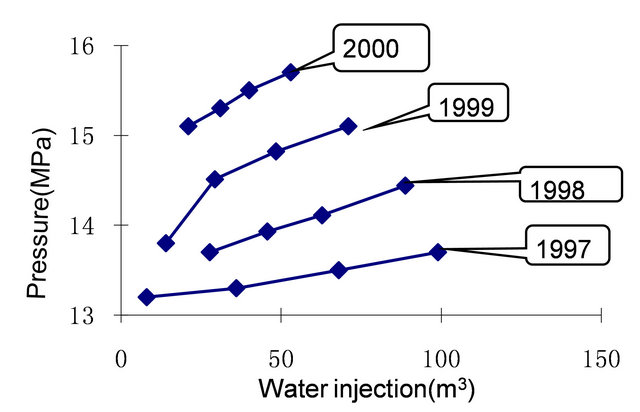
Figure 2. Water injection curve for Chao 84 - 144 block.
concentration was 1.0%. Volume of each and every slug was 0.10 PV. The injection procedure in the pilot testing can be seen as follow:
1) Main surfactant slug;
2) Water slug;
3) Supplementary surfactant slug;
4) Chase water.
3.4. Results Comparison between Simulation and Pilot
The injection of surfactant solution lowered the threshold pressure and increased the water injectivity. The pilot test of surfactant flooding started in January of 2005, the effect of surfactant flooding was seen in injectors after one month of surfactant injection, the average bottom hole flowing pressure of injectors was decreased to 22.9 MPa, and the daily water injection rate increased to 124.8 m3/d, the allocated injection rate was met, the extent of increase of water injection was 27.3%, so the effect of pressure-reducing and increase of injection rate was significantly obvious. For June of 2006 to June of 2007, the predicted value of average bottom hole flowing pressure was 22.3 MPa, the actual value is 22.7 MPa, the relative error was 2.3%; the predicted average daily water injection rate was 122.5 m3/d, the actual value was 128.9 m3/d, the relative error was 5.2%. The comparison of water injection profile before and after surfactant for well Chao 82 - 152 showed that the water absorbing thickness was increased 2 m, the daily water injection increased from 14 m3 to 22 m3, which was increased by 57.1%. Especially, the water intake of FІ 72 layers increased from 0 m3 to 2 m3 (Figure 3).
The displacement efficiency was improved, especially in low permeability zones. In the condition of 300 m well pattern, the displacement pressure difference was 0.073 MPa/m, the zones, which had higher threshold pressure than 0.073 MPa/m, could not be displaced in the condition of conventional water flood. On average, the 18 zones were drilled through by wells, 11 zones could be displaced by conventional water flood, accounting for 60%. The simulation predicted results showed that 14
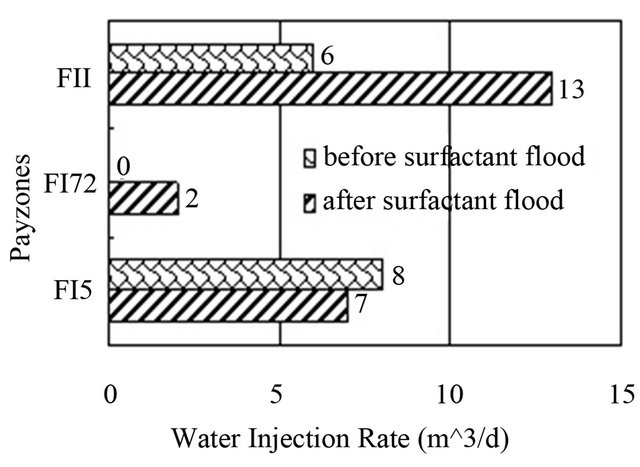
Figure 3. Comparison of water injection for different payzones for well Chao 82 - 152.
Table 5. Development indexes and economic indexes of schemes at the different slug volumes.
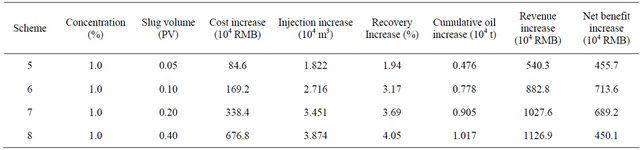
Table 6. Net benefit of schemes with different slugs.
zones can be displaced by surfactant flooding, actually, 15 pay zones were displaced, increased by 22%, indicating that water was injected into some low permeable zones after surfactant flooding because of decrease of threshold pressure.
The prediction showed significant decline of water cut and obvious increase of oil production. At the end of the injection of first slug, the predicted water cut was 75.5%, the actual water cut was 74.2%, the absolute error was 1.3%, the water cut was decreased by 8.7% over the pre-pilot test; the simulation predicted daily oil production was 3.72 t/d, the actual value was 3.89 t/d, and the relative error was 4.2%, the increase of daily oil production was 0.94 t/d compared with that of pre-pilot test, the average increase of oil for single well was 31.5%, and the cumulative increase of oil is 3479.0 t.
It was assumed that price of crude oil was 1450.0 RMB/t. The operation cost was 550.0 RMB/t. Deducting 86.0 × 10⁴ RMB of investment, as of December 2006, the net economic benefit was 2.619 × 10⁶ RMB, the ratio of cost to revenue was 1/3, so the economic benefit was significant.
The comparison between simulation results and pilot test show that the calculation error of main development indexes is within 6%, meeting the requirement of engineering calculation. The mathematical model presented in this paper includes the threshold pressure gradient, and can be used to simulate such characteristics of surfactant flooding in low permeability reservoir as effect of pressure-reducing and injection-increase, and increase of displaced pay zones, the conventional chemical flooding simulators do not have this function.
4. Conclusions
1) The laboratory experiments showed that the surfactant flooding lowered the threshold pressure by more than 40% and increase the oil recovery efficiency of low permeability by 5.0% of OOIP at Chao-522 reservoir conditions;
2) A three-dimensional, two-phase, three-component mathematical model for surfactant flooding is established, which is able to reflect the changes of threshold pressure, influence of convection, diffusion and adsorption of surfactant on rock;
3) The method to calculate surfactant adsorption quantity and treatment of relative permeability curve are improved, which increase the matching between simulation results and field application, the calculation error of main development indexes is within 6.0%;
4) The pilot test shows that surfactant flooding can decrease water injection pressure, increase the water injectivity in low permeable layers, and increase number of displaced zones, increase the oil production rate, the extent of increase reaches 3.0%;
5) This investigation of surfactant flooding simulator is an excellent opportunity to manage the surfactant flood in the Chao-522 field and shows that this should be of reference value to improve the surfactant floods in the low permeability reservoirs.
REFERENCES
- J. J. Taber, F. D. Martin and R. S. Seright, “EOR Screening Criteria Revisited-Part 1: Introduction to Screening Criteria and Enhanced Recovery Field Projects,” SPE Reservoir Engineering, Vol. 12, No. 3, 1997, pp. 189-198. doi:10.2118/35385-PA
- V. Hornof and A. Chaaraoui, “Viscosity of Surfactant-Polymer Solution,” SPE 11775, The Paper was Presented at the International Symposium on Oilfield and Geothermal Chemistry Held in Denver Co, 1-3 June 1983.
- P. Gao, B. Towler and X. Zhang, “Integrated Evaluation of Surfactant-Polymer Floods,” SPE-129590, Presented at the 2010 SPE EOR Conference at Oil & Gas West Asia, Muscat, 11-13 April 2010.
- W. Kang, et al., “Mechanism of Tertiary Oil Recovery,” Chemistry Industry Press, Beijing, 1996, pp. 101-122.
- Q. Liu and Y. Jiang, “The Application of Surfactant in Oilfield Development,” Petroleum Industry Press, Beijing, 1987, pp. 22-37.
- X. Zhao, Y. Wu, P. Gao, et al., “Investigation of Steam Injection at Critical Condition and a Pilot Test in 119-52, Chao-601,” SPE 130968, Presented at the 2010 International Oil and Gas Conference and Exhibition in China, Beijing, 8-10 June 2010.
- K. P. Sun, et al., “Theory Basis of Reservoir Numerical Simulation,” Petroleum Industry Press, Beijing, 1996, pp. 198-212.
- Y. Feng, B. Ji and P. Gao, “An Improved Grey Relation Analysis Method and Its Application in Dynamic Description for a Polymer Flooding Pilot of Xingshugang Field, Daqing,” SPE 128510, Presented at the North Africa Technical Conference and Exhibition, Cairo, 14-17 February 2010, 10 Pages. doi:10.2118/128510-MS
- G. Z. Liao, Q. M. Wang and D. M. Wang, “Principles of Chemical Combination Flooding ant Its Application,” Petroleum Industry Press, Beijing, 1999, pp. 132-166.
- X. Zhao, Y. Wu, P. Gao, et al., “Strategies to Conduct Steam Injection in Waterflooded Light Oil Reservoir and a Case in Fuyu Reservoir, Jilin,” SPE 142650, Presented at the 2011 SPE Middle East Oil and Gas Show and Conference, Manama, 25-28 September 2011.
- D. Yin, P. Gao and H. Pu, “Investigation of a New Simulator for Surfactant Floods in Low Permeability Reservoirs and Its Application in Chao-522 Field, 2010 Update,” SPE 128645, Presented at the 2010 SPE EOR Conference at Oil & Gas West Asia, Muscat, 11-13 April 2010.
Nomenclature
 permeability
 oil phase relative permeability
 gas phase relative permeability
 water phase relative permeability
 porosity
 gravity coefficient
 water viscosity
 oil viscosity
 gas viscosity
 water saturation
 oil saturation
 gas saturation
 oil phase pressure
 surfactant concentration
 time difference operator
 unit vector
 residual oil saturation
 surfactant concentration
 ith relative permeability curve
 adsorption coefficients
 adsorption concentration
NOTES
*Corresponding author.