CellBio
Vol.1 No.1(2012), Article ID:22497,10 pages DOI:10.4236/cellbio.2012.11001
The Number of Cyclic Stretch Regulates Cellular Elasticity in C2C12 Myoblasts
Faculty of Advanced Life Sciences, Hokkaido University, Sapporo, Japan
Email: *mizutani@sci.hokudai.ac.jp
Received April 28, 2012; revised May 30, 2012; accepted June 15, 2012
Keywords: Cellular Elasticity; Mechanical Stimulation; Atomic Force Microscopy; Myosin Regulatory Light Chain; Regulation of Cellular Function
ABSTRACT
Mechanical stimulations have been shown to regulate cellular mechanical properties. However, the stimulation patterns for effective regulation are as yet unclear. We investigated the effects of application of differing numbers of mechanical stimulation sets, each set consisting of 8% extension and compression to cells via deformation of cell culture elastic chamber, on cellular elasticity. Elasticity increased with only a single step-like stretch and with a single step-like stretch after 1 set of mechanical stimulation, whereas elasticity did not change with a single step-like stretch after 10 sets of mechanical stimulation. These results indicate that the increase in cellular elasticity with the single step-like stretch depends on the number of applied mechanical stimulations. Immunofluorescence staining showed that phosphorylation and dephosphorylation of myosin regulatory light chain (MRLC), which regulates intracellular contractile force and cellular elasticity, accompanied cellular elasticity changes. These findings suggest that cellular elasticity changes under cyclic and step-like stretches are mediated by MRLC.
1. Introduction
Cellular responses to external mechanical stimuli, such as gravity, stretch and shear flow, and ultrasound, play important roles in expressing cellular physiological functions [1-4]. For example, cardiac or smooth muscle cells respond to the stretch induced by elevated blood pressure and alter their mechanical properties to modulate blood pressure to maintain adequate blood circulation [5]. In addition, bone cells respond to ultrasound by increasing cellular growth rate and extracellular matrix secretion [6]. Such controlled cellular growth and matrix secretion is expected to be available in the clinical field. Thus, cellular response to external mechanical stimuli is not only a fundamental cellular function, but it is also adaptable for medical usage. Therefore, investigation of the types of available mechanical stimulus and their resulting cellular responses are of great interest in both cell biology and biophysics.
Mechanical stretch has the ability to change cellular physiological functions, such as differentiation and cellular morphology. For example, cyclic stretch (with some additives) inhibits to differentiate myoblasts into myotubes [7]. In addition, uniaxial cyclic stretch induces cell orientation perpendicular to the stretch axis [8], although other stretch patterns like a single step-like stretch do not induce such effects. In the case of a single step-like stretch, this mechanical stimulus also keeps cells stretched, i.e., mechanical stimulus continues to be impressed to cells; however, cellular responses to a single step-like stretch are different from responses to cyclic stretches. To use mechanical stretch more effectively for cell regulation, it is important to consider its application pattern.
Our previous work showed that cellular elasticity could be regulated by mechanical stretch [9]. Briefly, application of only a single step-like stretch increased cellular elasticity, while more than 30 sets of cyclic stretch before the single step-like stretch inhibited the increase in cellular elasticity. These results indicate that adequate patterns of mechanical stretch are available to regulate cellular elasticity. However, the stretch patterns for effective regulation of cellular elasticity are not clear as yet.
The purpose of this study was to determine the number of cyclic stretches that are sufficient to inhibit the increase in cellular elasticity after the single step-like stretch. We examined the cellular elasticity response by changing the number of cyclic stretches from 1 to 10 sets. In addition, we examined signaling cascades known to be involved in the regulation of cellular elasticity following cyclic stretches. Cellular elasticity is known to be related to actomyosin-based contractile force [10]. As candidates for regulating contractile force under mechanical stretch, we examined changes in phosphorylation of myosin regulatory light chain (MRLC) and intracellular Ca2+. Our results indicated that the number of cyclic stretches regulated phosphorylation of MRLC and resulting cellular elasticity. We discuss the need to investigate the relationship between the expected cellular physiological response and mechanical stimulation parameters, and we address the regulatory mechanism of cellular elasticity following mechanical stimulation.
2. Materials and Methods
2.1. Cell Culture
Murine C2C12 skeletal myoblasts obtained from RIKEN Cell Bank (Tsukuba, Japan) were cultured on plastic flasks supplied with Dulbecco’s modified Eagle’s medium (DMEM; Sigma-Aldrich, MO, USA), 10% FBS, and 1% antibiotic solution (Sigma-Aldrich) at 37°C in a humidified atmosphere of 5% CO2.
2.2. Stretch Device and Sample Preparation
Living cells were stretched or contracted via deformation of a deformable elastic cell culture chamber combined with a uniaxial stretch device [11]. For cellular elasticity measurements, an elastic chamber was formed into a 5-mm thick bottom (30 × 30 mm) with a wall height of 20 mm by using transparent silicone rubber (SYLGARD 184; Dow Corning, Michigan, USA). For immunofluorescence observation, we used 10 μm of a thin-bottom elastic chamber and a high magnification lens. To deform the chamber at a constant velocity and degree, we used a motor-driven uniaxial slide stage (TAM-401SOMEBMDC(15); Sigma Koki, Tokyo, Japan): 2 ends of the chamber were attached to the stage with handmade steel clamps (Figures 1(A) and (B)). By using this experimental setup, we applied 8% rectangular-like repetitive strain or a single step-like strain to cells. One set of rectangular-like strain consisted of the following 4 steps: stretch (from 0% to 8% of strain with 200 μm/s velocity); rest (maintaining the 8% strain for 18 s); compression (from 8% to 0% of strain with 200 μm/s velocity); rest (maintaining the 0% of strain for 18 s). Thus, application of 1 set of rectangular-like strain took 1 min. A set of rectangular-like strain was defined as 1 set of cyclic stretch.
The chamber was sterilized by exposure to ultraviolet light for 6 h, and then the bottom of the chamber was coated with 20 μg/ml fibronectin (Roche Diagnostics, Basel, Switzerland) in PBS for 30 min. Cells grown on
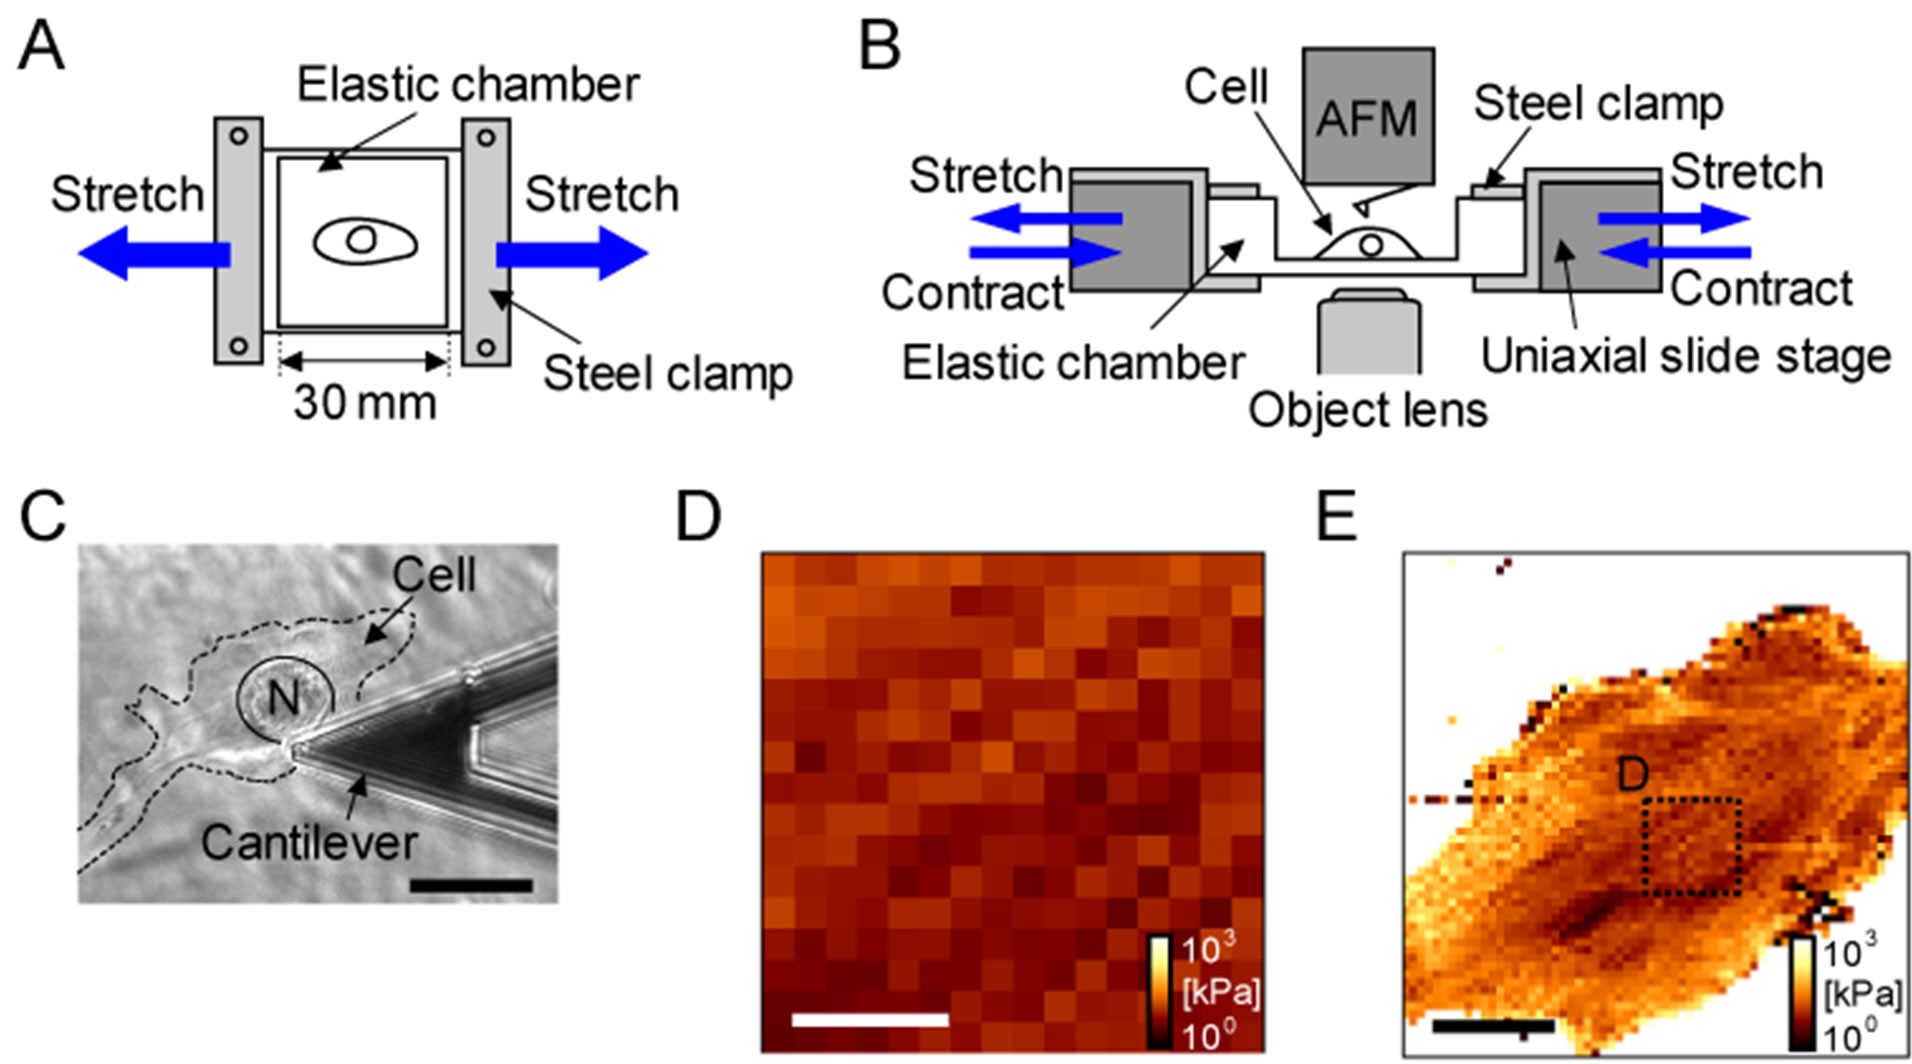
Figure 1. Experimental setup for stretching C2C12 myoblasts. Stretching cells were performed by deformation of a deformable elastic cell culture chamber to which cells adhered. (A) Overhead view of uniaxial stretch device. The elastic chamber was formed into a bottom of 5 mm or 10 mm thick and a wall of 20 mm height by transparent silicon rubber. Two ends of this chamber were fixed with handmade steel clamps; (B) Lateral view in measurement system of cellular elasticity. The chamber fixed with clamps was combined with uniaxial slide stage and was deformed at a constant velocity and degree by motors. Cellular elasticity under uniaxial stretch was measured by atomic force microscopy (AFM); (C) Monitor of cellular position by optical microcope. Relative position of cell (dashed line), cellular nucleus (indicated as N) and cantilever were checked by the optical image. We adjusted the top of cantilever (center of the AFM measurement area) onto cellular nucleus. Scale bar indicates 15 mm; (D)-(E) Verification of targeted region of elasticity measurement. We used 15 mm area (16 pixels × 16 lines) of elasticity image (D) for the evaluation of cellular elasticity. Position of the area was determined by the above procedure. To verify that the position is on an adequate place (on cellular nucleus), wide-field elasticity image (60 mm, 64 pixels × 64 lines) for the cell (C) was measured (E). Elasticity distrition in (D) is very similar to distribution in (E), suggesting that the targeted 15 mm area is roughly on celular nucleus.
the plastic flasks were trypsinized and cultivated in the incubator for 1 day prior to the stretch experiments. A few hours before the stretch experiments, the cell culture medium was replaced with 4-(2-hydroxyethyl)-1- piperazineethanesulfonic acid (HEPES)-buffered DMEM (pH 7.2 - 7.3) with 10% FBS and 1% antibiotic solution.
2.3. Cellular Elasticity Mapping with Atomic Force Microscopy
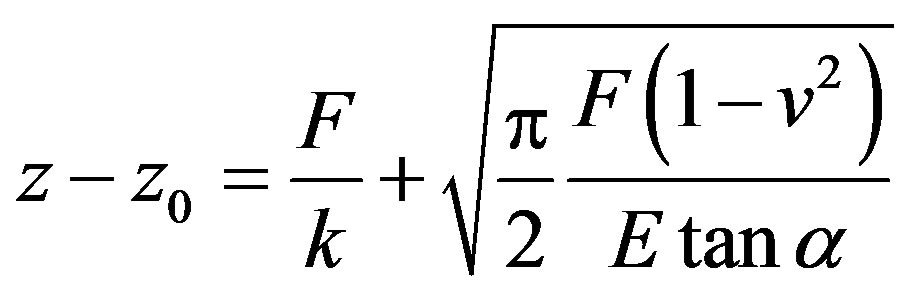
Cellular elasticity mapping was achieved by a combination of a commercial atomic force microscope (AFM) and our developed force mapping method [12]. The AFM (NanoScope IIIa BioScope; Veeco, CA, USA) was equipped with a piezo translator with a maximum xy scan range of 100 μm and a z range of 10 μm. We used a silicon-nitride cantilever (MLCT-AUNM; Veeco, CA, USA) with the following specifications: a spring constant of 0.01 N/m; tip geometry, pyramidal shape with an opening angle of 35˚. The spatial distribution of cellular elasticity was measured by the force mapping method. Briefly, the relationship between the force acting on the cantilever versus distance between the cantilever and sample (so-called force curve) was taken at each pixel point in a scan area. The force versus distance curves were taken typically at 5.0 Hz with a z range of 1500 nm. The force curves were fit to the Hertzian contact model for a pyramidal indenter by using the non-linear leastsquares method. The Hertzian contact model predicts the following relation:
 (1)
(1)
where z is the position of the piezo scanner, F is the loading force, v is the Poisson ratio, and α is the halfopening angle of the cantilever tip. Here v was assumed as 0.5 for simplification. Young’s modulus (elasticity) E was acquired as fit parameters when the force curve data were fit to the above model.
To monitor minute time scale of cellular elasticity change, we improved temporal resolution to obtain representative cellular elasticity at each condition. Conventional force mapping mode for 64 pixels × 64 lines requires about 30 min to obtain one image. The 64 pixels × 64 lines measurement has an advantage for comparison of cellular elasticity maps and immunofluorescent images [12] because of the better spatial resolution. On the contrary, it has a weakness in the temporal resolution to obtain one image. In the present study, we prioritized temporal resolution over the spatial resolution by the reduction of target pixel points to 16 pixels × 16 lines. A measurement for the 16 pixels × 16 lines takes 2 - 3 min.
To ensure that the targeted measurement region on a cell is identical during a set of AFM measurements, we used an inverted optical microscope (TE2000; Nikon, Tokyo, Japan) and adjusted the center of the target region onto the cellular nucleus by transference of the cantilever position (Figures 1(C)-(E)). As a representative value of cellular elasticity at each condition, we applied averaged elasticity from the 16 × 16 pixel points for a 15 μm scan area. To compare cellular elasticity under mechanical stimulations, we chose cells with initial elasticity of 10 to 12 kPa.
2.4. Intracellular Ca2+ Measurement
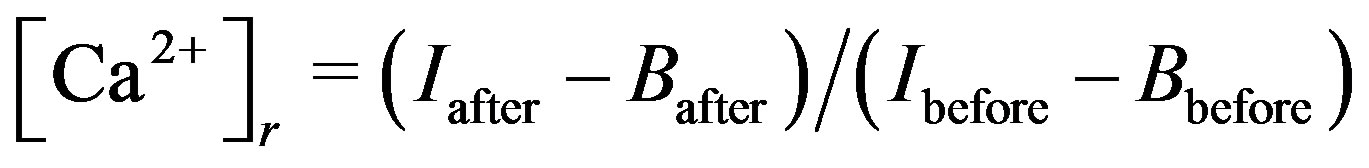
Changes in cytosolic Ca2+ concentration ([Ca2+]) in response to mechanical stretch were measured using a Ca2+ indicator (Quest Fluo-8™ AM; AAT Bioquest, Inc., CA, USA). We prepared a Fluo-8 stock solution (50 mM of Fluo-8 AM esters in DMSO) and stored them at –20°C. For [Ca2+] measurements, we added 200 μl of DMEM with 10% FBS and 1% antibiotic solution to 10 μl of the stock solution. Cells were then incubated with the Fluo-8 AM mixture overnight at 37˚C, and then culture media was replaced with HEPES-buffered DMEM (pH 7.2 - 7.3) containing 1.8 mm Ca2+ prior to the mechanical stretch application. Intracellular Ca2+ signals were measured by a confocal laser scanning microscope (TCS-SP5 confocal imaging system; Leica) with a 20× objective lens every 15 s. We recorded the fluorescence intensity over 520 nm excited by 490 nm. The effects of cyclic stretch on relative [Ca2+]r were estimated from the following equation:
 (2)
(2)
where Iafter and Ibefore are the intensities after and before the cyclic stretch, and Bafter and Bbefore are the corresponding background autofluorescence values.
2.5. Immunofluorescence Microscopy and Quantification of Changes in Diphosphorylated Myosin Regulatory Light Chain
Cells were fixed with 1% formaldehyde in PBS for 5 min and permeabilized with 0.5% Triton-X100 in PBS for 5 min. For staining diphosphorylated MRLC (pp-MRLC), cells were incubated with rabbit anti-pp-MRLC primary antibody (dilution 1:250; 3671S; Cell Signaling Technology, MA, USA) diluted in PBS containing 0.5% skim milk (SM-PBS) for 2 h, then with Alexa594-conjugated goat anti-rabbit IgG secondary antibody (dilution 1:500; Invitrogen) diluted in SM-PBS and AlexaFluor-488 phalloidin (dilution 1:200; Invitrogen) for 1 h. The stained cells were observed using a confocal laser scanning microscope (C1 confocal imaging system; Nikon) with a 60× objective lens. To quantify the changes in pp-MRLC under mechanical stretch, we measured the relative intensity of pp-MRLC. The pp-MRLC intensities on an F-actin-positive area in a cell were summed using ImageJ software (NIH, MD, USA). The values from 40 - 50 cells in each condition were averaged and normalized to the average under static conditions.
3. Results and Discussion
To determine the number of cyclic stretches that are sufficient to inhibit the cellular elasticity increase after the single step-like stretch, we examined the cellular elasticity response by changing the number of cyclic stretch sets from 0 to 10. Figure 2(A) shows the cellular elasticity map on the nucleus with 10 sets of cyclic stretch and a subsequent single step-like stretch. The elasticities were averaged and their time course was plotted (Figure 2(B)). The immediate increase after the cyclic stretch and the decrease after 20 min were similar to data previously reported [13]. After these responses,
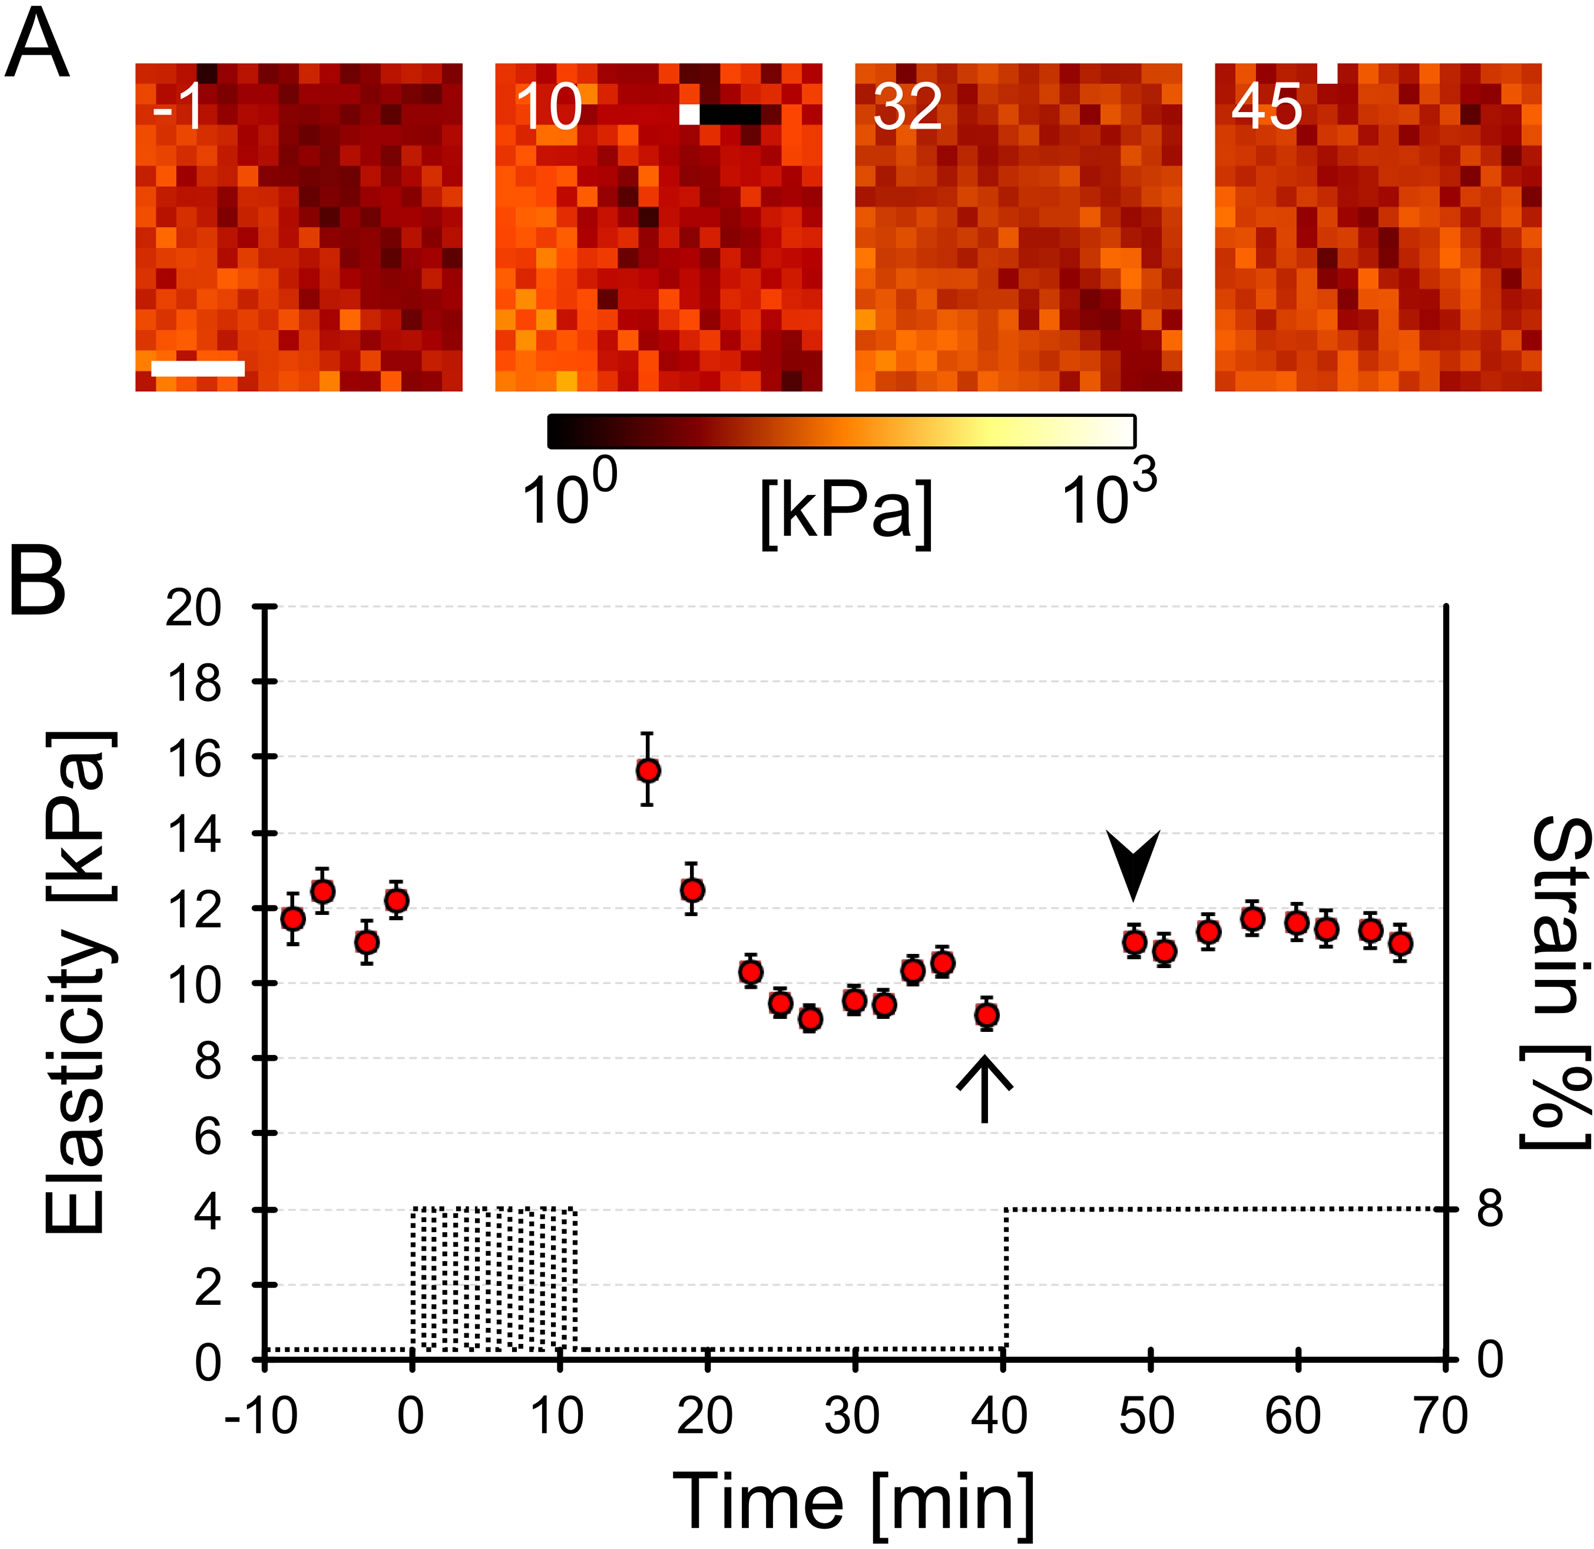
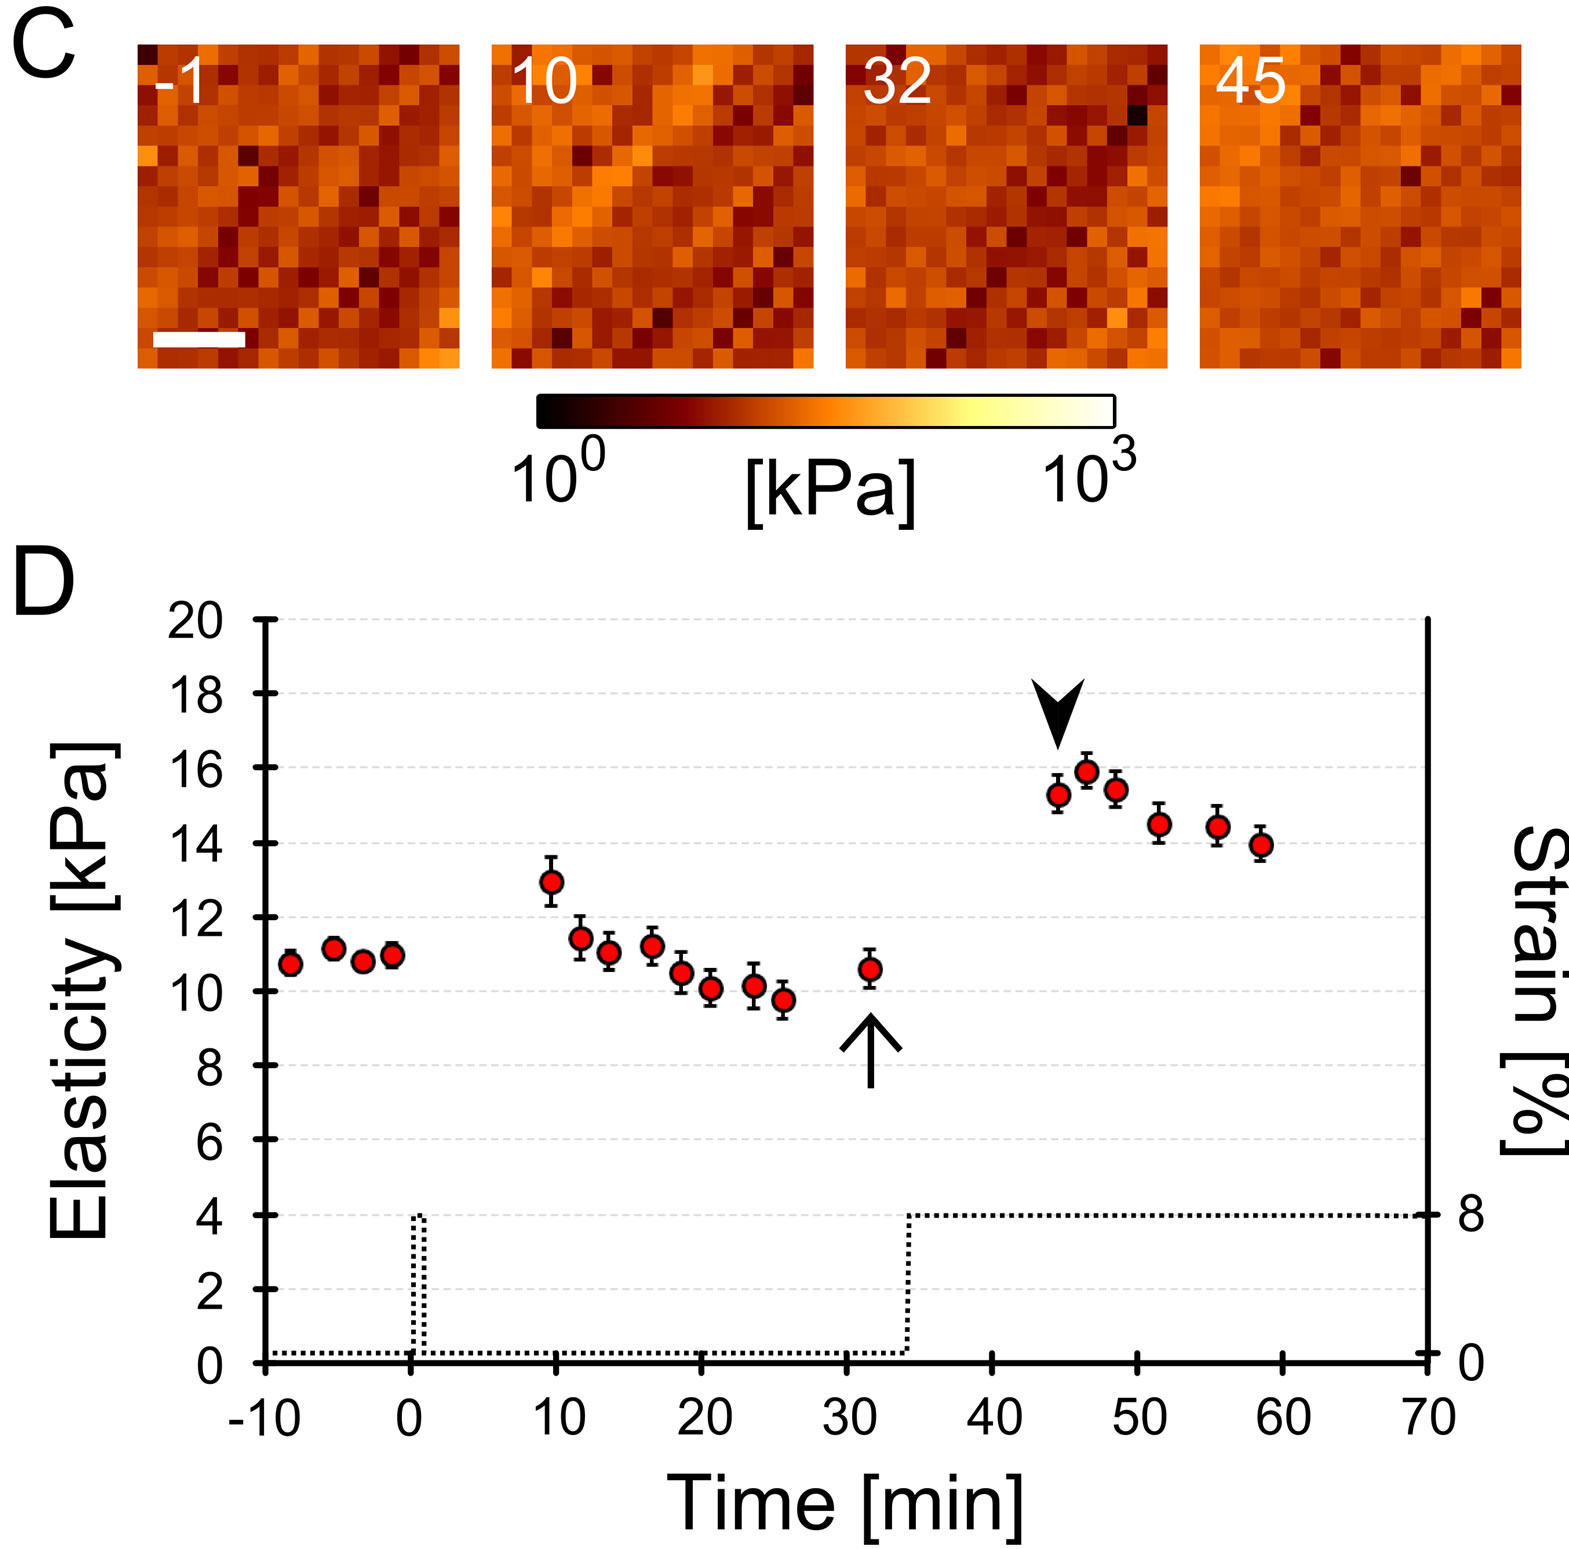
Figure 2. Representative cellular elastic responses under distinct mechanical stimulations. Myoblasts were cultured on a deformable chamber and subjected to 2 1 or 10 sets of mechanical cyclic stretch via deformation of the chamber. Changes in cellular cortex elasticity around the nucleus were evaluated by atomic force microscopy (details are described in Materials and Methods and Figure 1). (A) Temporal changes of cellular elasticity with 10 sets of cyclic stretch and a subsequent single step-like stretch. 16 × 16 pixels of the elasticity map were measured every 2 - 3 min. Numbers in these images represent the relative time (min) from the starting point of the cyclic stretch. The cell was subjected to 10 sets of cyclic stretch from 0 to 10 min and subjected to a single step-like stretch at 40 min (see the time course of applied strain in Figure 2(B)). Scale bar = 5 μm; (B) Time course of the averaged elasticity of the cell subjected to 10 sets of cyclic stretch. Dotted line denotes applied cyclic stretch (strain on substrate). Cellular elasticity of the 16 × 16 pixels map was averaged and plotted as a function of time. The error bar denotes the standard error from the 16 × 16 of elasticity data. There is not a clear distinction in cellular elasticity between before (indicated as an arrow) and after the single step-like stretch (indicated as an arrowhead); (C) Temporal changes of cellular elasticity after 1 set of cyclic stretch and a subsequent single step-like stretch. Numbers in these images rep resent the relative time (min) from the starting point of the cyclic stretch. The cell was subjected to 1 set of cyclic stretch from 0 to 1 min and subjected to a single step-like stretch at 31 min (see the time course of applied strain in Figure 2(D)). Scale bar = 5 μm; (D) Time course of the averaged elasticity of the cell subjected to 1 set of mechanical cyclic stretch. Dotted line denotes applied cyclic stretch (strain on substrate). Cellular elasticity of the 16 × 16 pixels map was averaged and plotted as a function of time. The error bar denotes the standard error from the 16 × 16 elasticity data. Cellular elasticity after a single step-like stretch (indicated as an arrowhead) increased significantly compared to before the single step-like stretch (indicated as an arrow).
the elasticity did not increase despite the application of a single step-like stretch (arrow and arrowhead in Figure 2(B)). In contrast, with 1 set of cyclic stretch, cellular elasticity increased in response to the subsequent single step-like stretch (Figures 2(C) and (D)). To characterize the cellular elasticity response to a single step-like stretch after a different number of cyclic stretches, relative elasticity changes were statistically analyzed using data from 4 independent experiments (Figure 3(B)). Elasticity with only a single step-like stretch, 1 or 2 sets of cyclic stretch followed by a single step-like stretch significantly increased compared to changes in static conditions. On the other hand, elasticity changes with 7 or 10 sets of cyclic stretch followed by a single step-like stretch were not significantly different than changes under static conditions. Furthermore, the elasticity changes with 10 sets of cyclic stretch were significantly smaller than changes with 1 set of cyclic stretch. These results indicate that both a single step-like stretch, 1 and 2 sets of cyclic stretch with a single step-like stretch increase cellular elasticity, while 7 and 10 sets of cyclic stretch inhibit the increase caused by single step-like stretch. In other wordscellular elasticity responses with a single step-like stretch are dependent on the number of cyclic stretches that are applied prior to the single step-like stretch.
Next, we elucidated the residual effect directly on cellular elasticity after 10 or 2 sets of cyclic stretch. Cellular elasticity is known to be in a range [14]. We observed an increase in elasticity after 10 or 2 sets of cyclic stretch, which then decreased (Figures 2 and 3). If elasticity reaches a maximum after the cyclic stretches and the time constants for the decay in elasticity are different, elasticity changes on the single step-like stretch following the cyclic stretch would be different until the residual effect by the cyclic stretch disappears. To examine our hypothesis, we measured the time constant of elasticity decay by the 10 or 2 sets of cyclic stretch (Figure 4). Cellular elasticity immediately increased after the application of 10 sets of cyclic stretch and decreased to a constant value for the following 15 min (i.e., time constant = 15 min). In the case of 2 sets of cyclic stretch, the profile of the change was similar to that of the 10 sets cyclic stretch, although the time constant
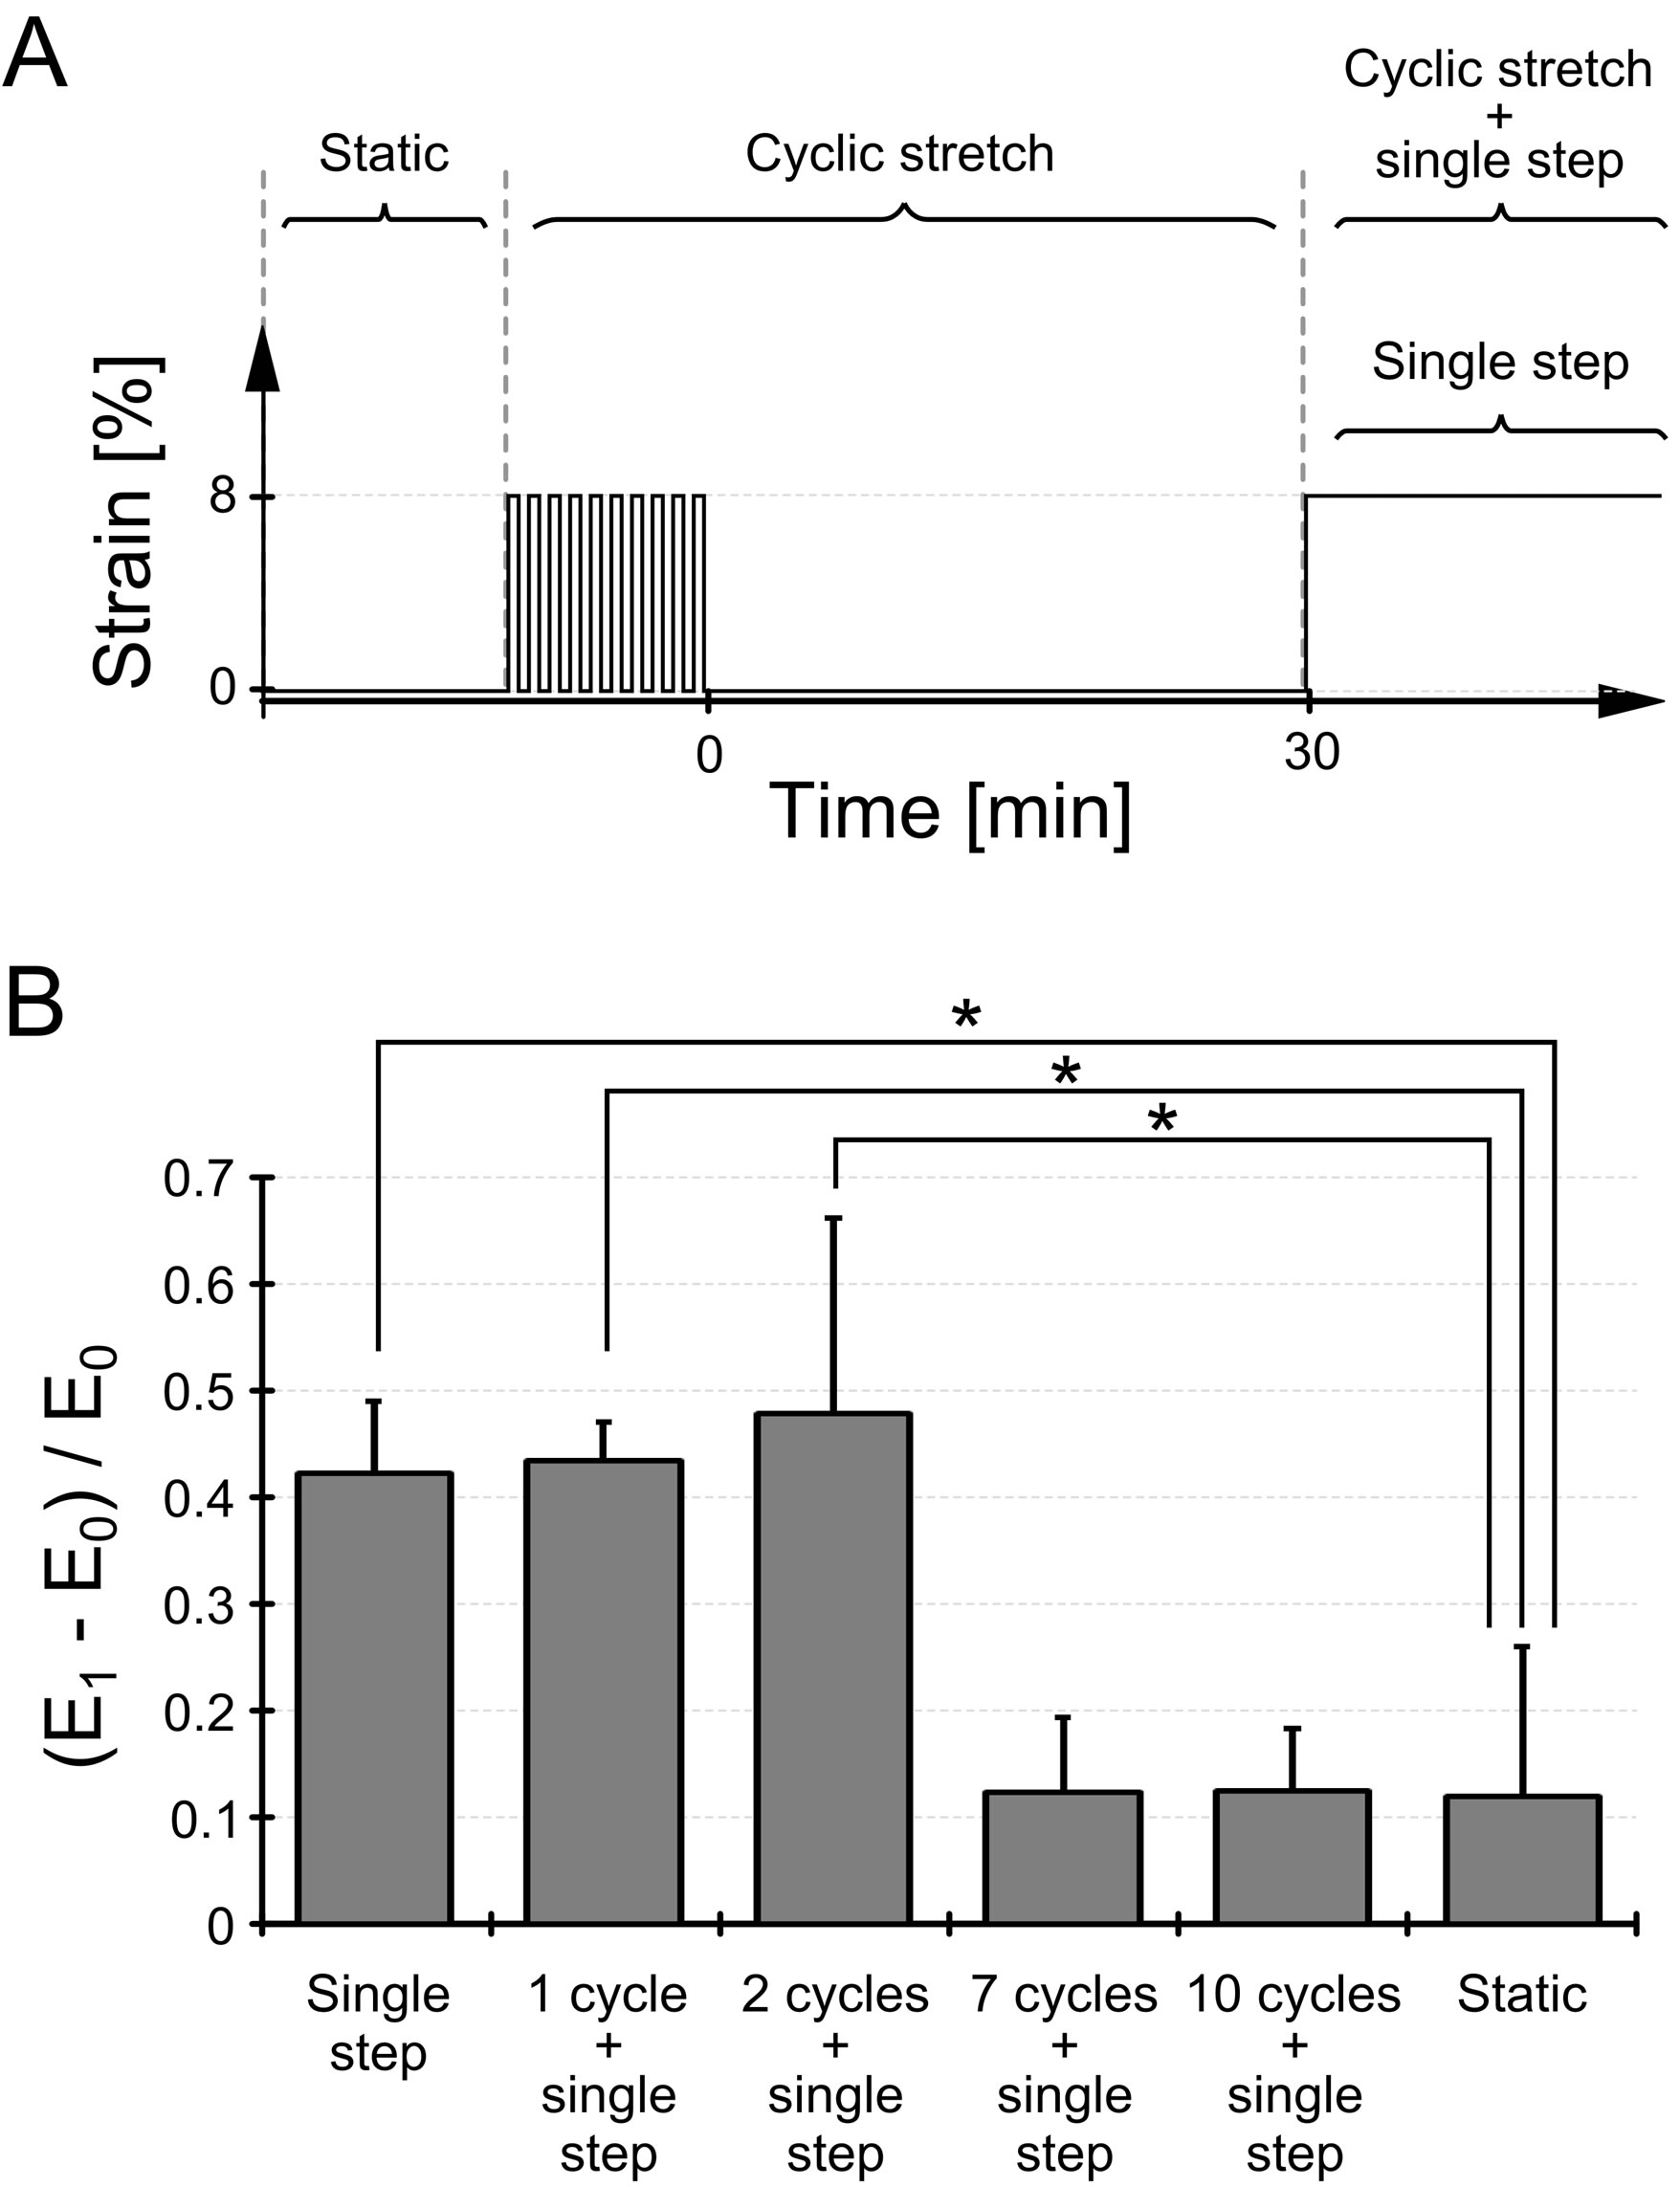
Figure 3. Effects of the number of cyclic stretches on the cellular elasticity response. (A) The schematic drawing describes the pattern of applied strain to myoblasts. We applied 1, 2, 7, or 10 sets of cyclic stretch to cells and applied a single step-like stretch 30 min after the cyclic stretch. The closing time point of the cyclic stretch is defined as the origin of the time course (0 min); accordingly, the starting time point of the single step-like stretch is at 30 min. The legends are as follows: “static”, condition without any mechanical stretch; “cyclic stretch”, term from the beginning of the cyclic stretch application to just before application of the single step-like stretch; “cyclic stretch + single step” and “single step,” term after the application of the single step-like stretch; (B) Cellular elasticity responses under distinct cyclic stretches were statistically compared. E0 denotes the cellular elasticity just before the single step-like stretch application, and E1 denotes the cellular elasticity at the beginning of the “cyclic stretch + single step” or “single step” term. Thus, (E1 − E0)/E0 represents the cellular elasticity change by the single step-like stretch. The time interval between E0 and E1 is 9 min. Each data point represents the mean ± standard error from ten experiments. *denotes significant differences from the “static” state (p < 0.01).
was 25 min. These results imply that there may be a residual effect on elasticity during the 25 min after the application of 10 or 2 sets of cyclic stretch. In other words, 30 min is sufficient to eliminate the residual effect on elasticity by the cyclic stretches. Taken together, our finding that 10 or 2 sets of cyclic stretch differently affect the cellular elasticity response induced by the single step-like stretch is valid because we used 30 min intervals between the end of the cyclic stretch and the beginning of the single step-like stretch (Figures 2(B) and (D)).
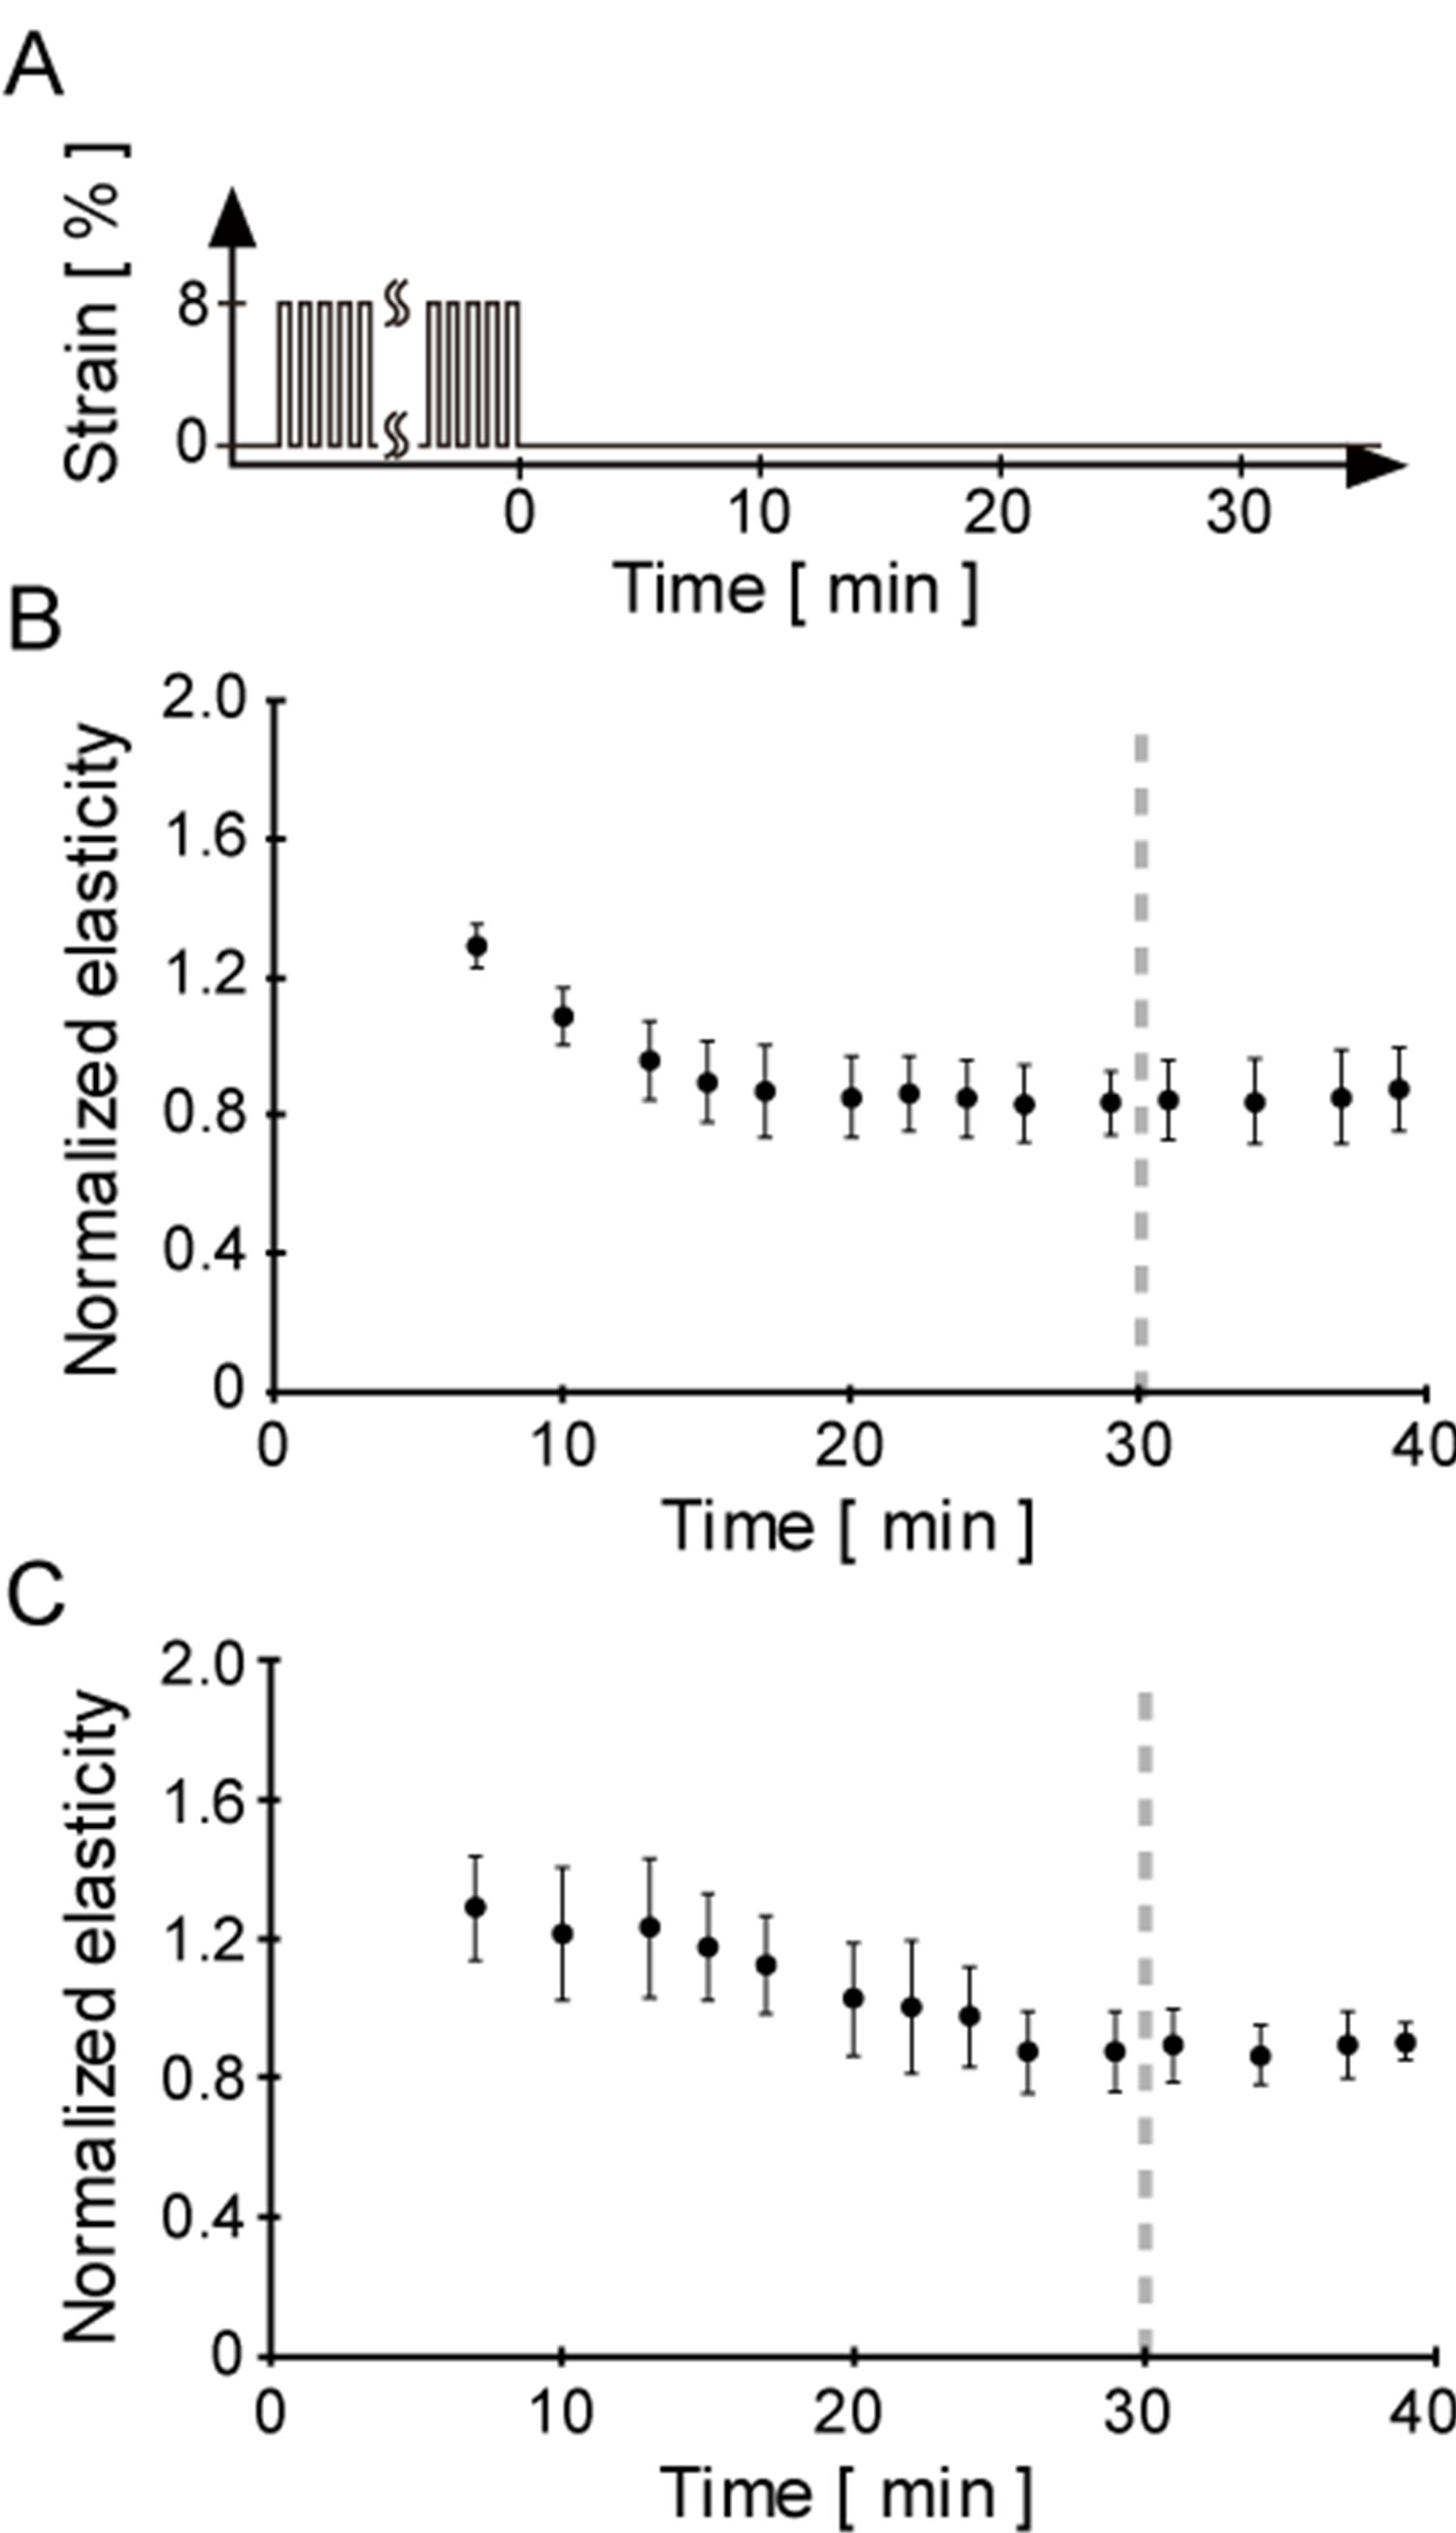
Figure 4. Confirmation of the quasi-stable state of cellular elasticity after the cyclic stretch. To elucidate the residual effect on cellular elasticity caused by the cyclic stretch, the time course of cellular elasticity changes after 2 or 10 sets of cyclic stretch was measured. (A) Schematic drawing indicates the pattern of applied strain to cells. The time point at the end of the cyclic stretch application was defined as the origin (i.e., 0 min) of the following time course data; (B) Time course of normalized cellular elasticity after 10 sets of cyclic stretch. Each elasticity data point was normalized by the division of the elasticity just before application of the cyclic stretch. Error bars were calculated as a standard error from 6 independent experiments. Cellular elasticity immediately increased after 10 sets of cyclic stretch and then decreased to a quasi-state during the following 20 min; (C) Time course of normalized cellular elasticity after 2 sets of cyclic stretch. Normalization of cellular elasticity was performed in the same manner described above. Error bars were calculated as a standard error from six independent experiments. Time course of cellular elasticity response to 2 sets of cyclic stretch was similar to that of 10 sets. Hence, the direct effect on cellular elasticity by mechanical pulses would be eliminated by 30 min intervals (the end of the term is indicated as dashed lines in Figures 4(B) and (C)).
To survey molecular mechanisms as to how cyclic stretch affect the cellular elasticity response by a single step-like stretch, we focused on phosphorylation of MRLC, which are thought to contribute to cellular elasticity [15]. First, we examined changes in pp-MRLC with a single step-like stretch and/or with cyclic stretches. Previous reports have shown that pp-MRLC increases intracellular contractile force and cellular elasticity [15], and diphosphorylation can be induced by a single step-like stretch [16]. To quantify changes in pp-MRLC, we stained cells with anti-pp-MRLC and measured the intensity (Figure 5). The pp-MRLC intensity with only a single step-like stretch was significantly larger than the intensity under static conditions. A similar change was seen after the single step-like stretch following 2 sets of cyclic stretch. However, the intensity after a single step like stretch following 10 sets of cyclic stretch did not show clear differences compared to the static conditions. These results correlate with the cellular elasticity data (Figures 2 and 3). We also verified that there was no residual pp-MRLC induced by the 2 or 10 sets of cyclic stretch prior to the single step-like stretch. Taken together, these results suggest that the cellular elasticity response under mechanical stimulation originates from the pp-MRLC change.
Next, we investigated the contribution of cellular [Ca2+] to the diphosphorylation of MRLC because many groups have reported that [Ca2+] increases with cyclic stretch [8], and MRLC phosphorylation is induced by activation of myosin light-chain kinase (MLCK) in a Ca2+-dependent manner [17]. Our preliminary data showed that [Ca2+] did not change after1 or 10 sets of cyclic stretch and a subsequent single step-like stretch (Figure 6). This result implies that Ca2+ does not contribute to regulation of elasticity changes.
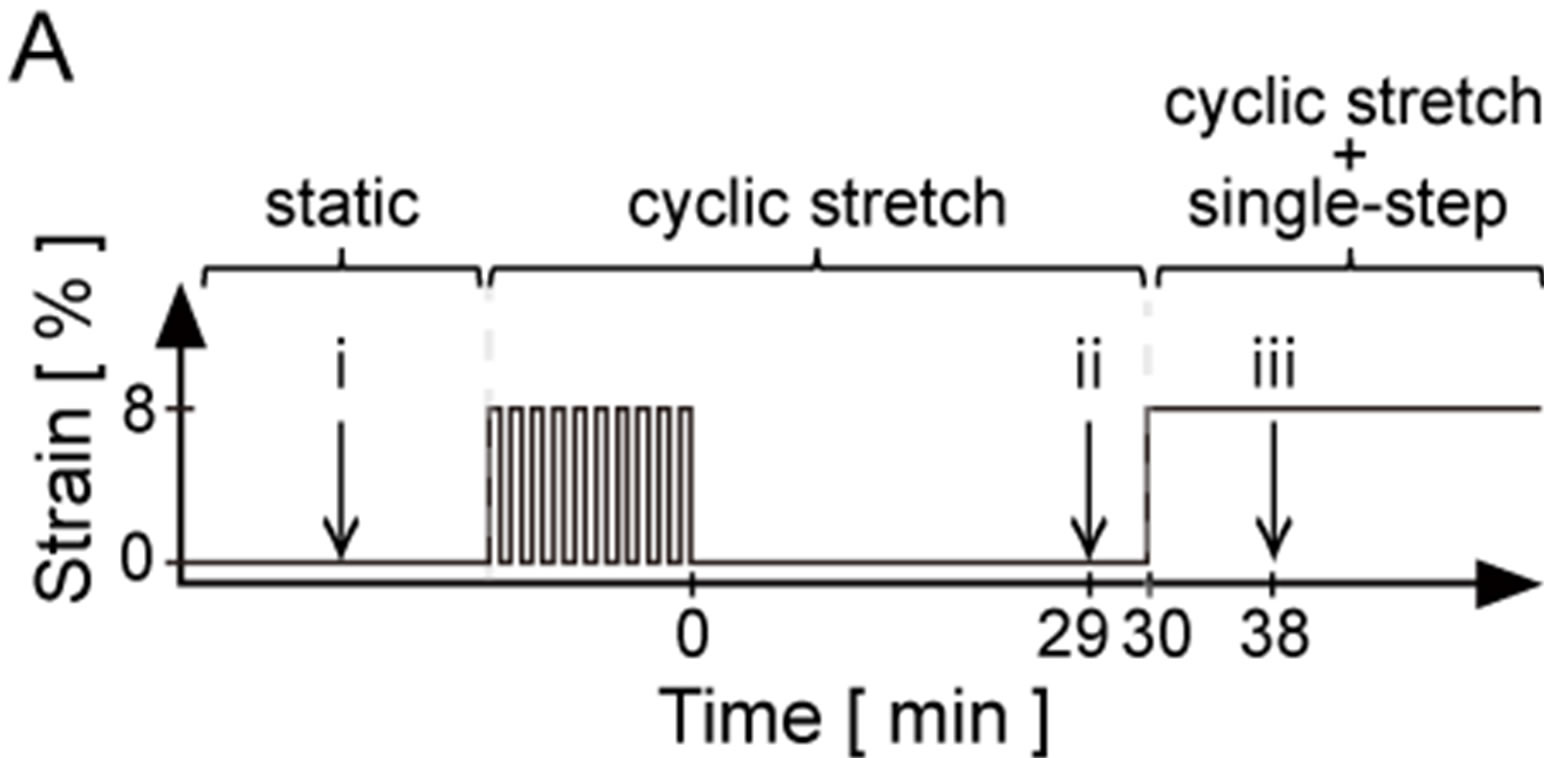
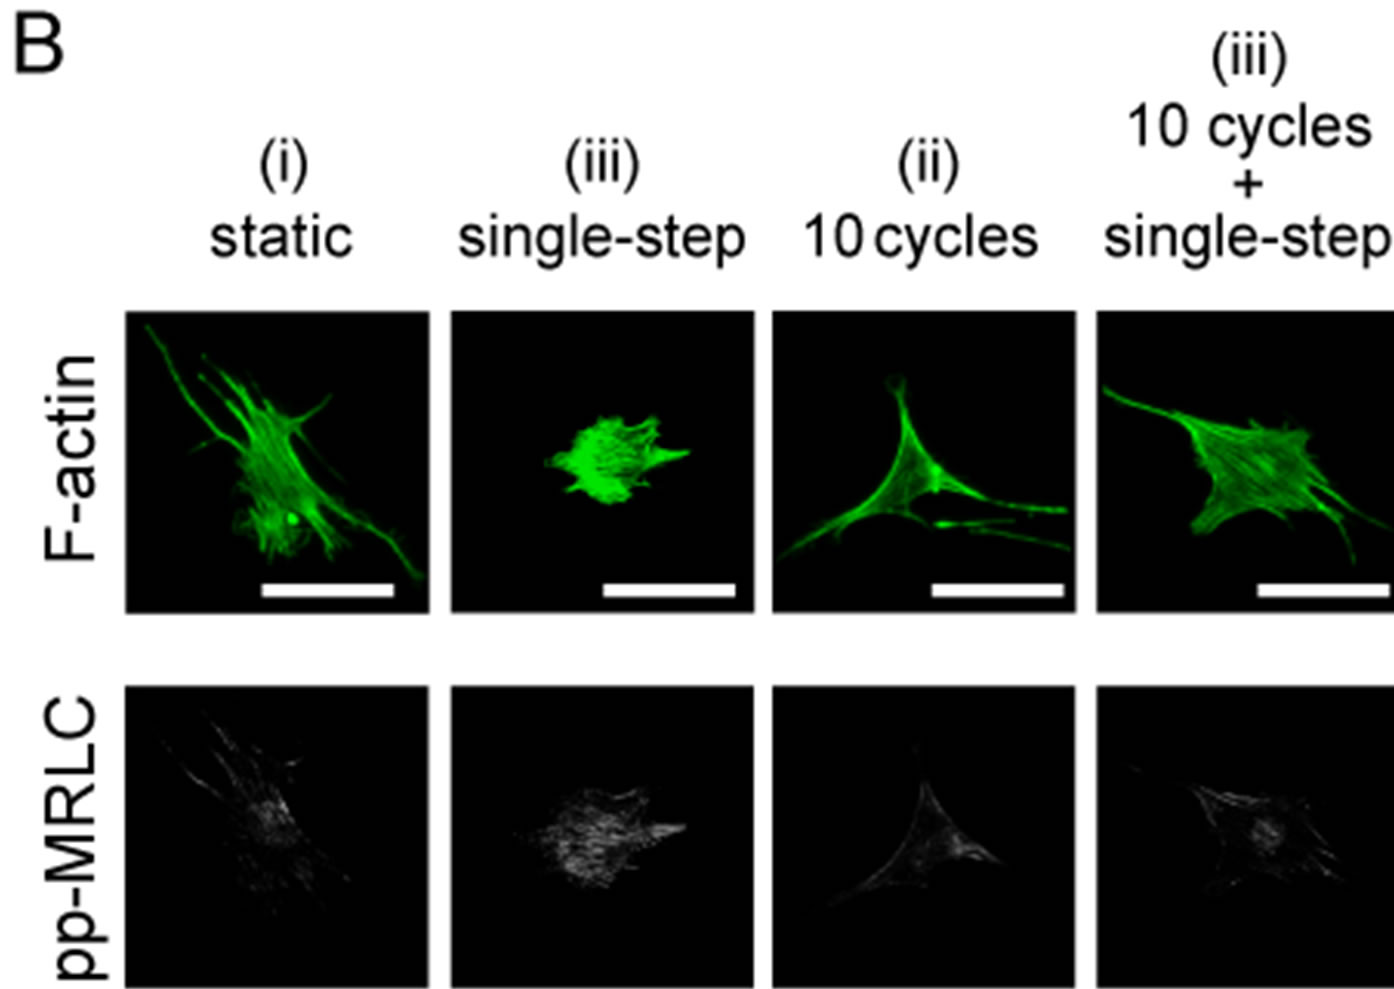
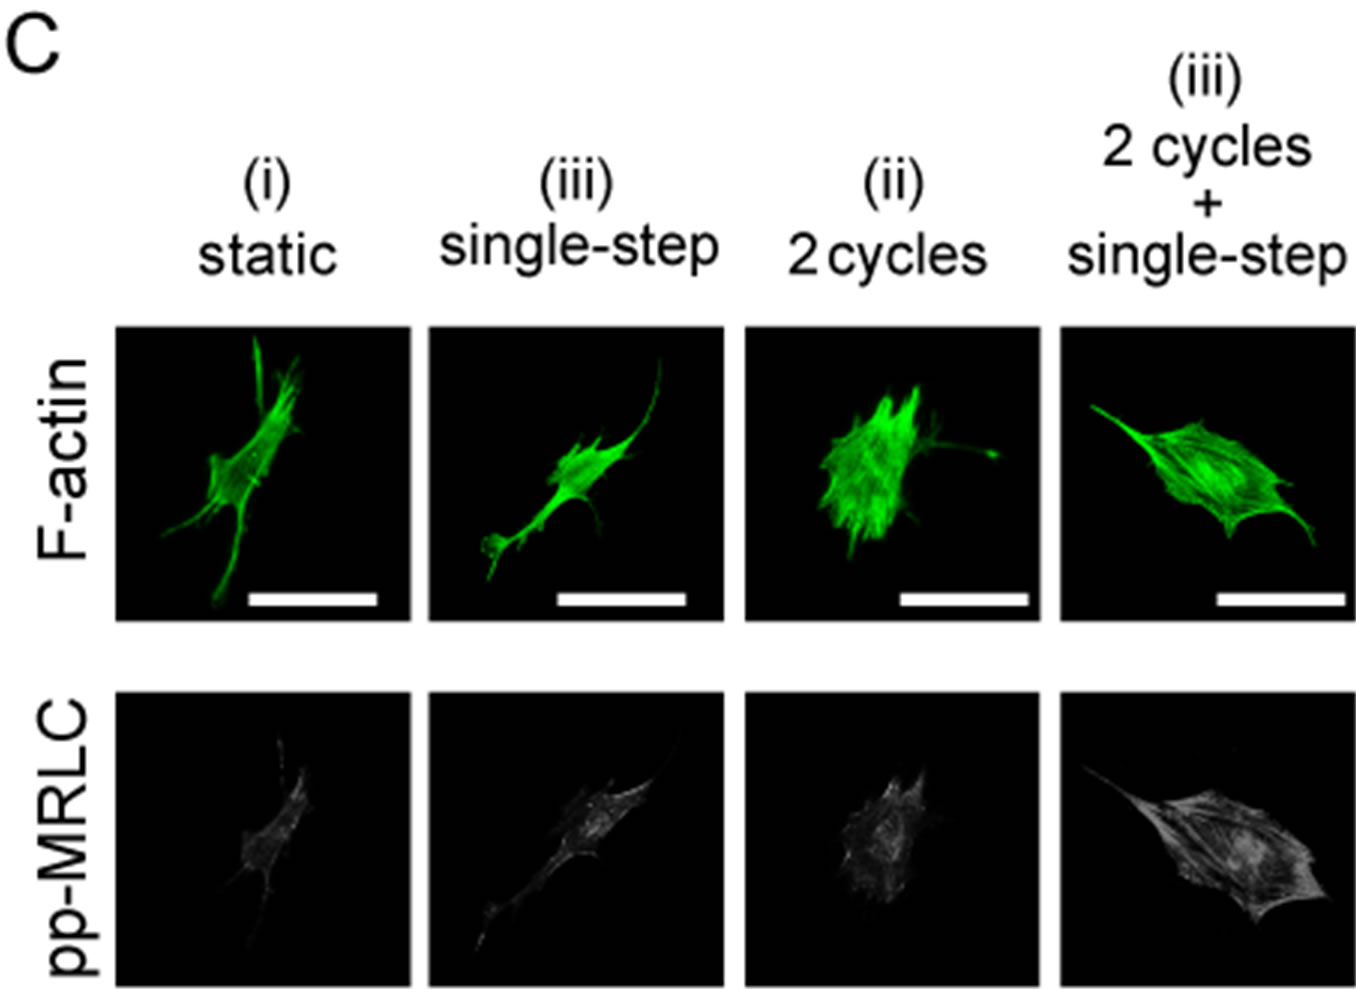
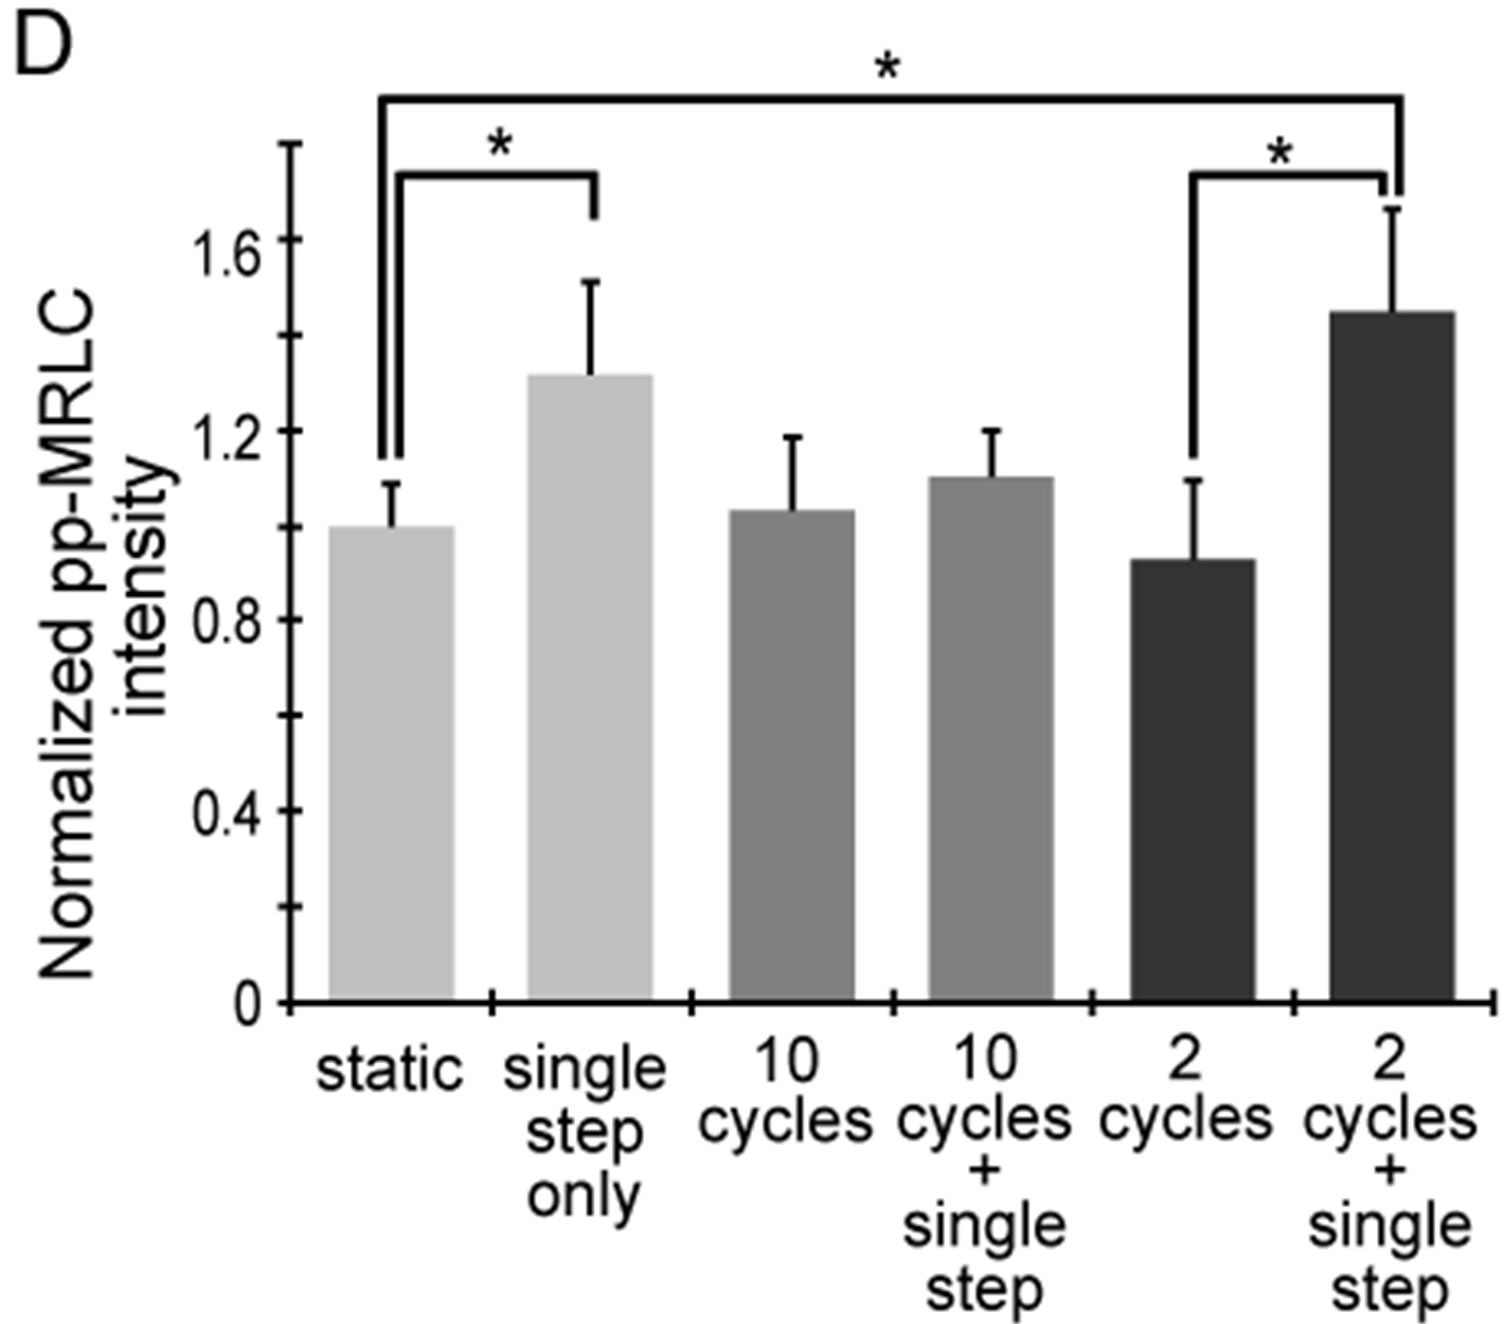
Figure 5. Changes in diphosphorylation of MRLC with 2 or 10 sets of cyclic stretch. Myoblasts were stained with anti-ppMRLC and phalloidin after application of mechanical stimulations. (A) Schematic drawing indicates the pattern of the applied strains. Cells were fixed and stained at the following 3 time points: “static”, term without mechanical stimulations; “cyclic stretch”, time point 29 min after cyclic stretch; “cyclic stretch + single step”, time point 38 min after the single step-like stretch; (B)-(C) A set of fluorescent images after 10 sets (B) and 2 sets (C) of cyclic stretch. Scale bar = 50 μm; (D) Changes in pp-MRLC intensity were statistically compared. Each data point represents the mean ± standard errors from 40 - 50 cells from 2 independent experiments. *indicates significant differences (p < 0.01).
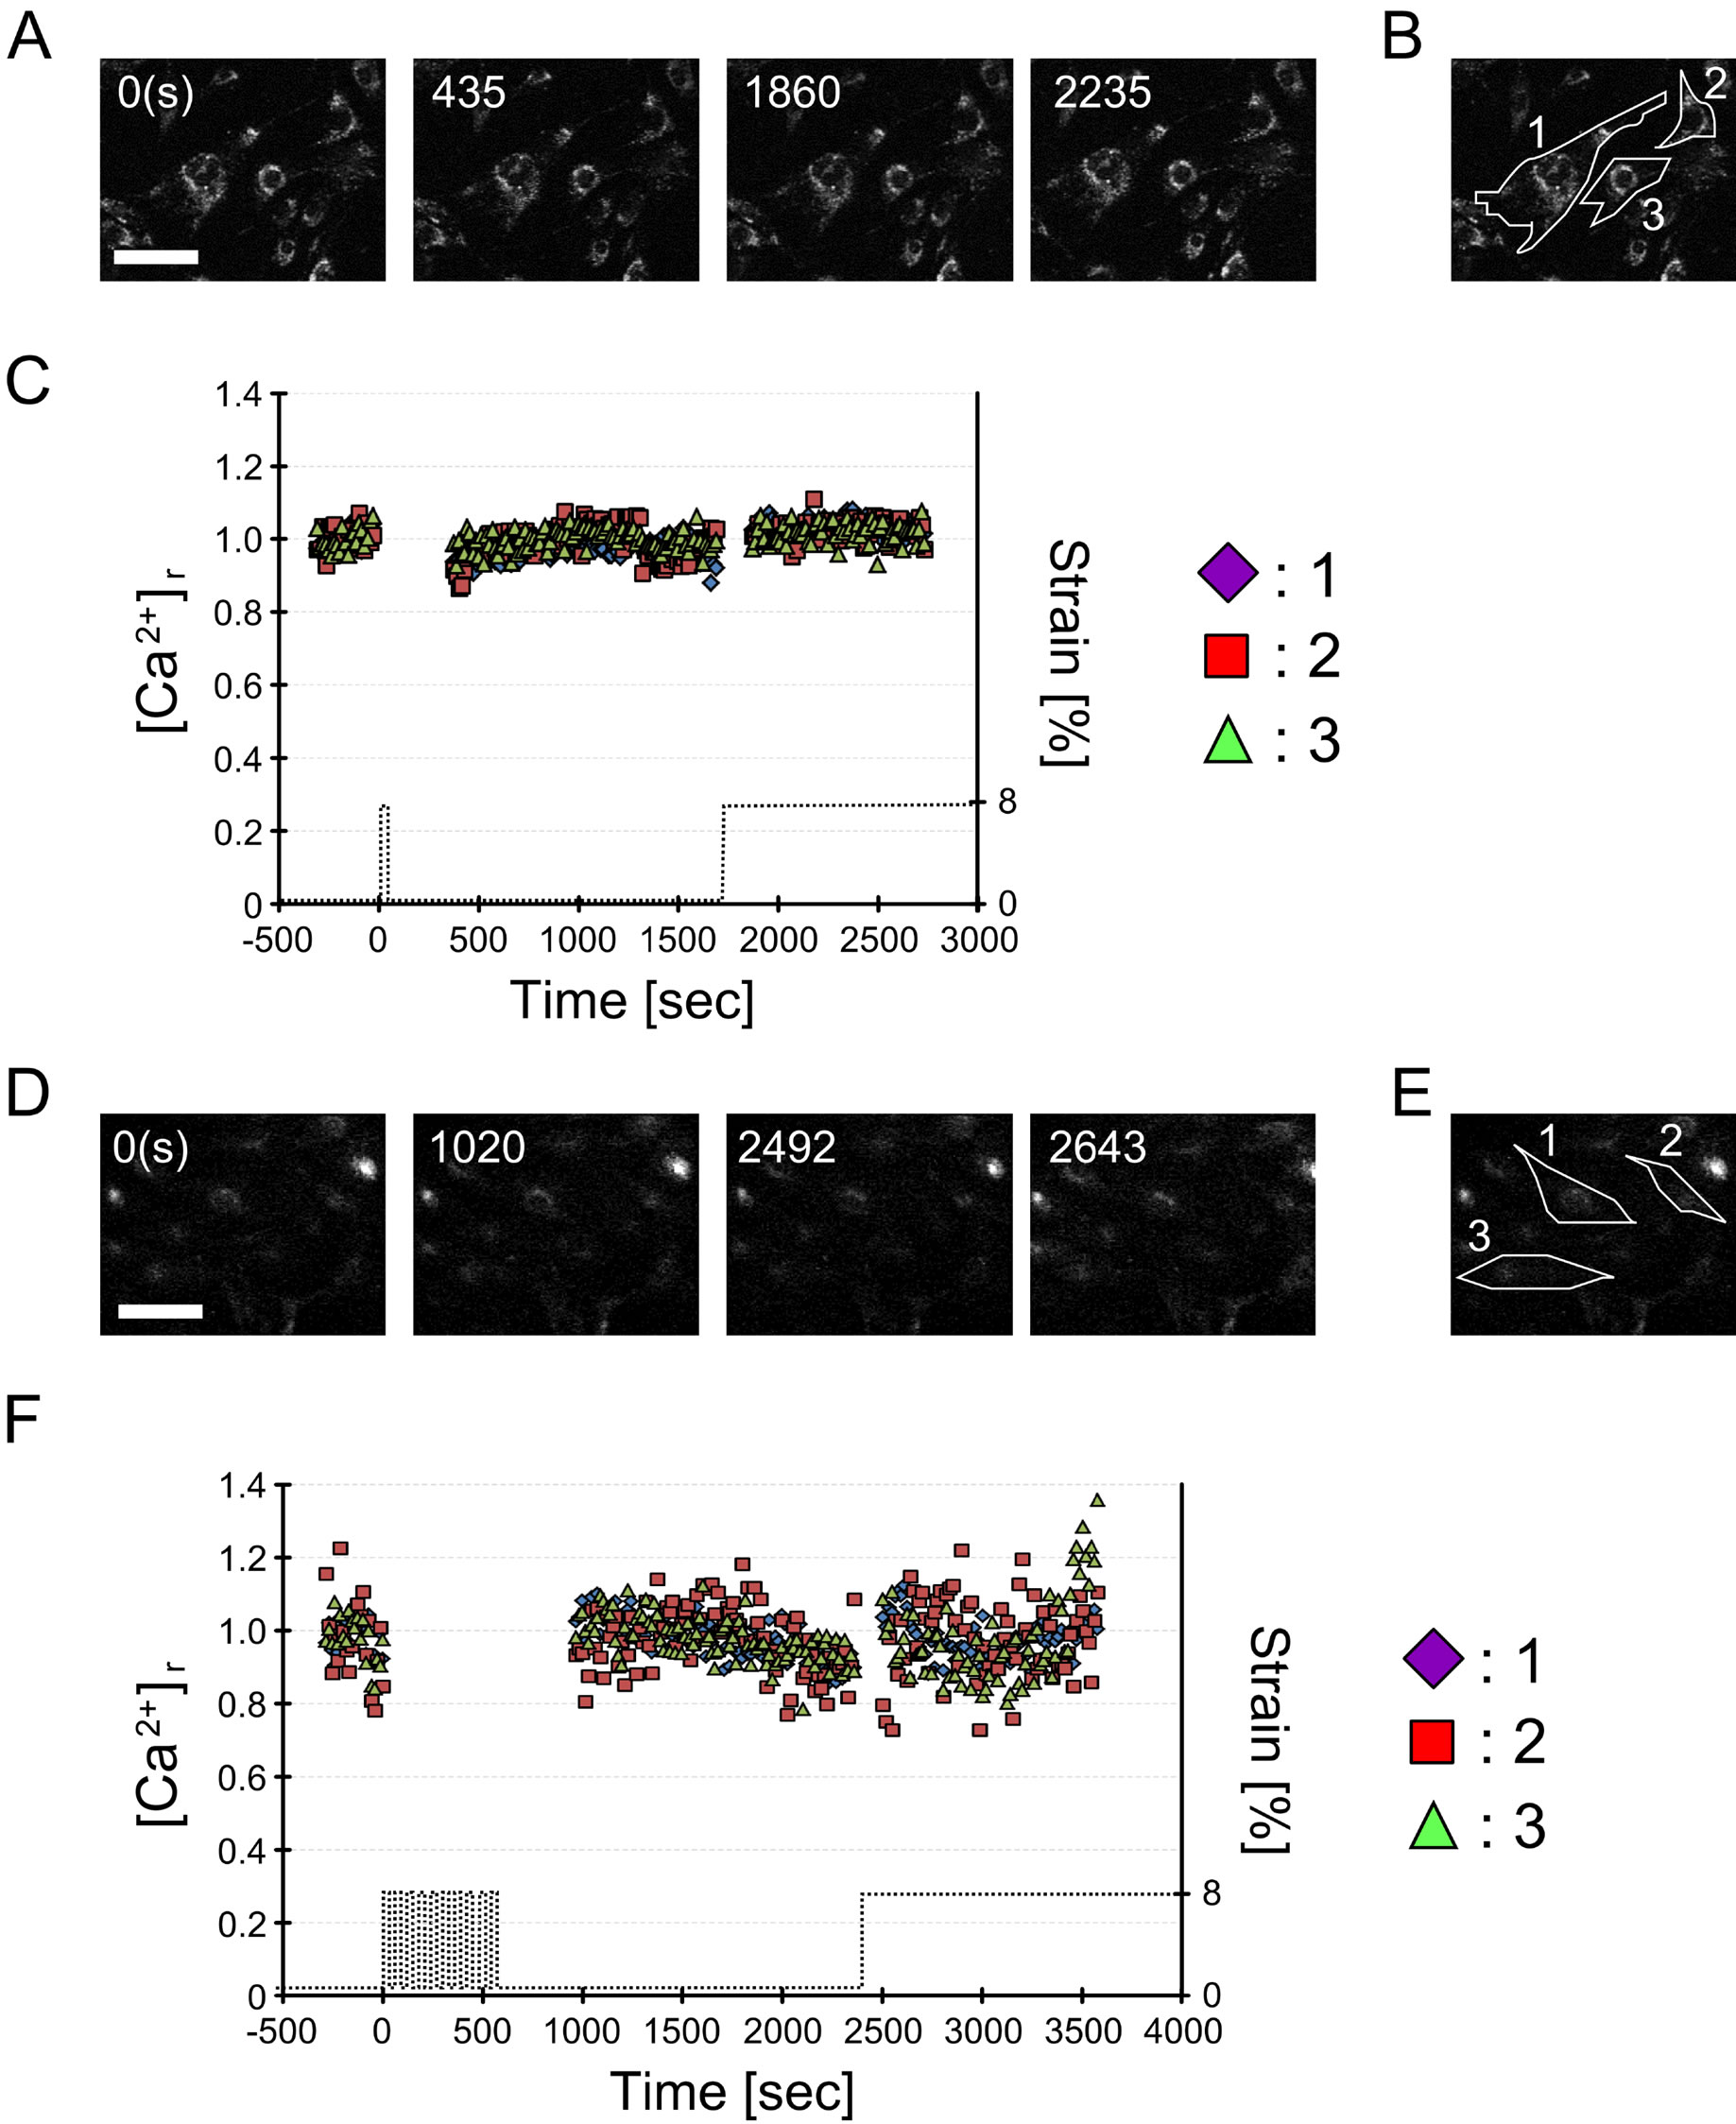
Figure 6. Changes in intracellular Ca2+ concentration under 1 or 10 sets of cyclic stretch. Changes in cytosolic Ca2+ concentration ([Ca2+]) in response to 1 or 10 sets of cyclic stretch were measured using a Ca2+ indicator. (A) Temporal changes in intracellular [Ca2+] under 1 set of cyclic stretch. Numbers in these images represent the relative time (sec) from the starting point of the cyclic stretch. The cell was subjected to 10 sets of cyclic stretch from 0 to 60 sec and subjected to a single step-like stretch at 1860 sec (see the time course of applied strain in Figure 6(C)). The scale bar indicates 100 μm; (B) Definition of cells perfomed time-lapse observation of [Ca2+] under 1 set of cyclic stretch by numbers; (C) Time course of [Ca2+] intensity of cells under 1 set of cyclic stretch. [Ca2+] did not change under 1 set of cyclic stretch and a subsequent single step-like stretch; (D) Temporal changes in intracellular [Ca2+] under 10 sets of cyclic stretch. Numbers in these images represent the relative time (sec) from the starting point of the cyclic stretch. The cell was subjected to 10 sets of cyclic stretch from 0 to 600 sec and subjected to a single step-like stretch at 2400 sec (see the time course of applied strain in Figure 6(F)). The scale bar indicates 100 μm; (E) Definition of cells perfomed time-lapse observation of [Ca2+] under 10 sets of cyclic stretch by numbers; (F) Time course of [Ca2+] intensity of cells under 10 sets of cyclic stretch. [Ca2+] also did not change under 10 sets of cyclic stretch and a subsequent single step-like stretch.
A variety of mechanical stimuli have the potential to regulate cellular physiology. With respect to cyclic stretch, changing the magnitude or frequency rearranges cell orientation [8,18] and cytoskeletal networks [19], and upor down-regulates cell growth rate and protein synthesis [20]. Moreover, application of a large number (~1000) of cyclic stretches also affects cell growth [21] and cell orientation. In the present study, we showed that application of even a small number (1 - 10) of cyclic stretches differently changed the cellular elasticity response (Figures 2 and 3) and molecular activity (Figure 5), although cell alignment did not change (Figure 7). Thus, there may be a relationship between the predicted cellular physiological response and parameters of the mechanical stimulations. To regulate cellular functions more effectively, the parameters of mechanical stimulation should be considered.
To discuss the mechanism as to how cells change their elasticity after mechanical stretches, changes in the cytoskeleton and activity of its regulators should be considerd. Many types of cells are reported to sense mechanical stimulation, which are transformed into intracellular signals [22,23]. With respect to regulators of cellular mechanical properties, Ca2+ influx, integrin complex activation, and RhoA activation are known to act as first messengers [24]. As such, F-actin polymerization, cellular elasticity change, and focal adhesion (FA) creation are induced [13,25]. In these processes, MRLC phosphorylation is thought to be a principal mediator (An and Hai 2000). Our results showed that MRLC phosphorylation and dephosphorylation accompanied cellular elasticity changes (Figures 2 and 3) and FA area (Figure 8). Taken together, these data indicate cellular elasticity changes resulting from cyclic and step-like stretches are likely mediated by MRLC. Furthermore, we hypothesize that MRLC changes are indendent of Ca2+ because the Ca2+ time-course was diffent from time-course of ppMRLC and elasticity (Figure 6), which is supported by a previous report indicatingthat influx of Ca2+ by cyclic stretch occurs in second time scale [8]. To investigate our hypothesis, experiments using expression of a non

Figure 7. Effects of 2 or 10 sets of cyclic stretch on the cell morphology. Cyclic stretch (over 1 Hz of frequency, and 10% of amplitude) induced cell orientation perpendicular to the stretch axis. In this study, we examined effects of 2 and 10 sets of cyclic stretch on the cell morphology. The closing time point of cyclic stretch is defined as the origin of the time course (0 min). The “static” is a condition whithout any mechanical stretch. The direction of stretching cells is shown by a double-headed arrow. The scale bar indicates 100 μm. Cell orientation did not change after the application of 2 and 10 sets of cyclic stretch.

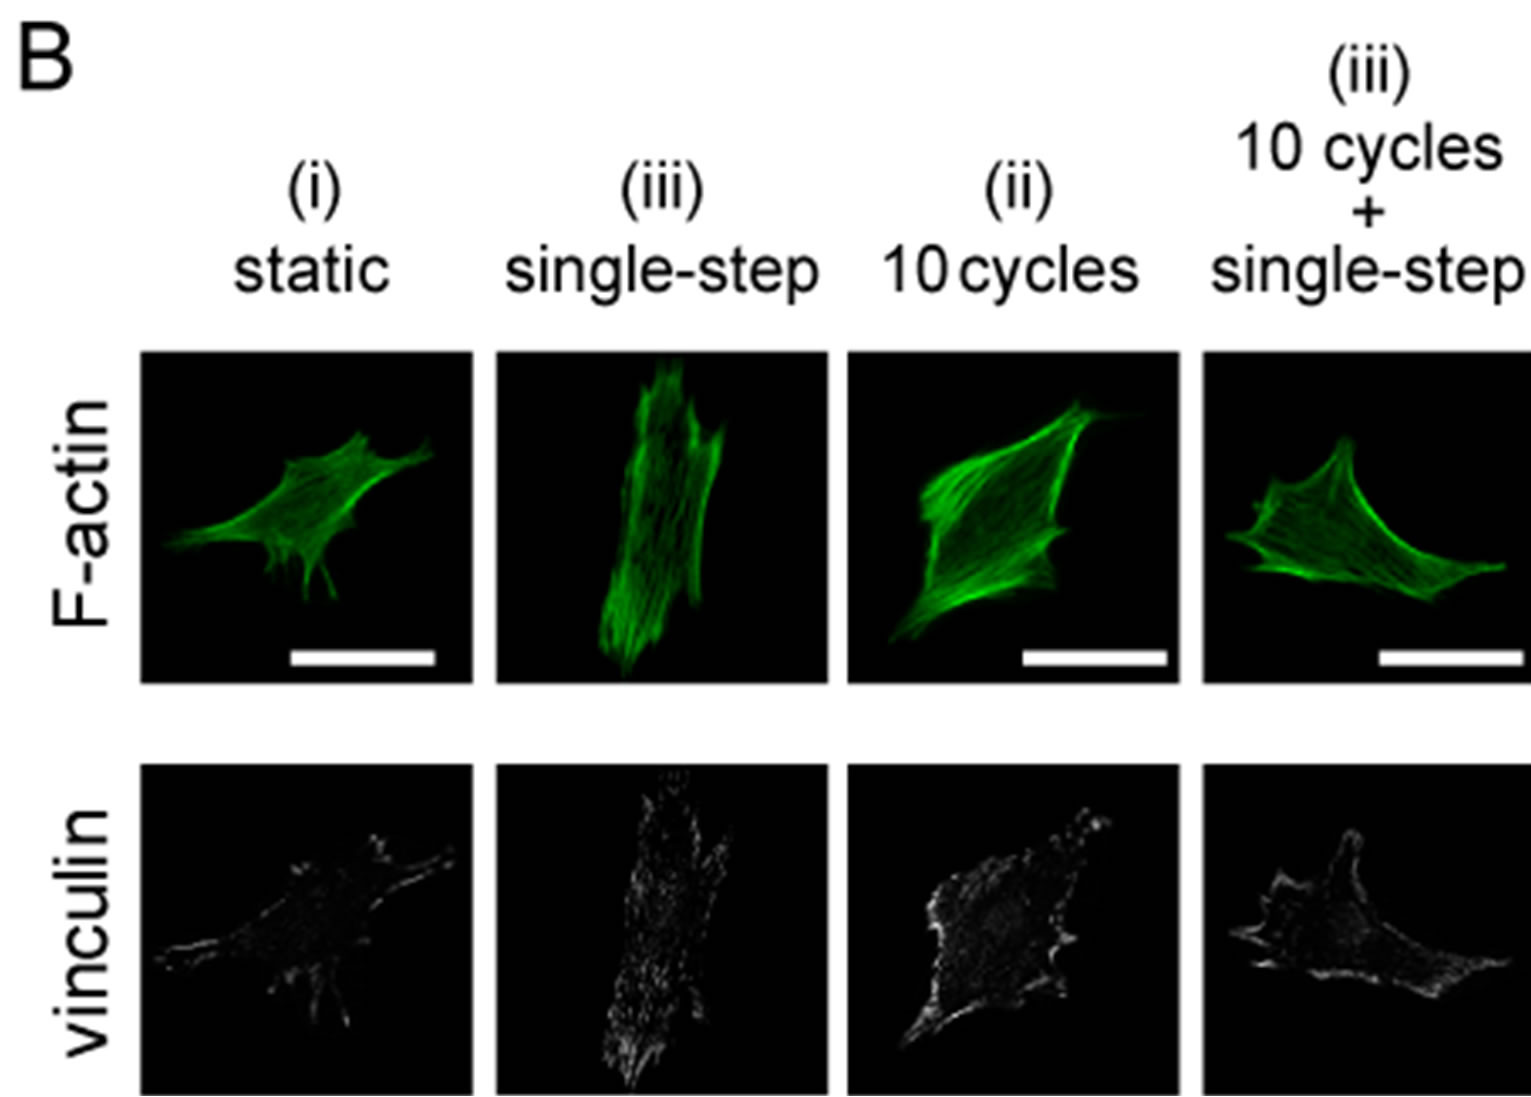
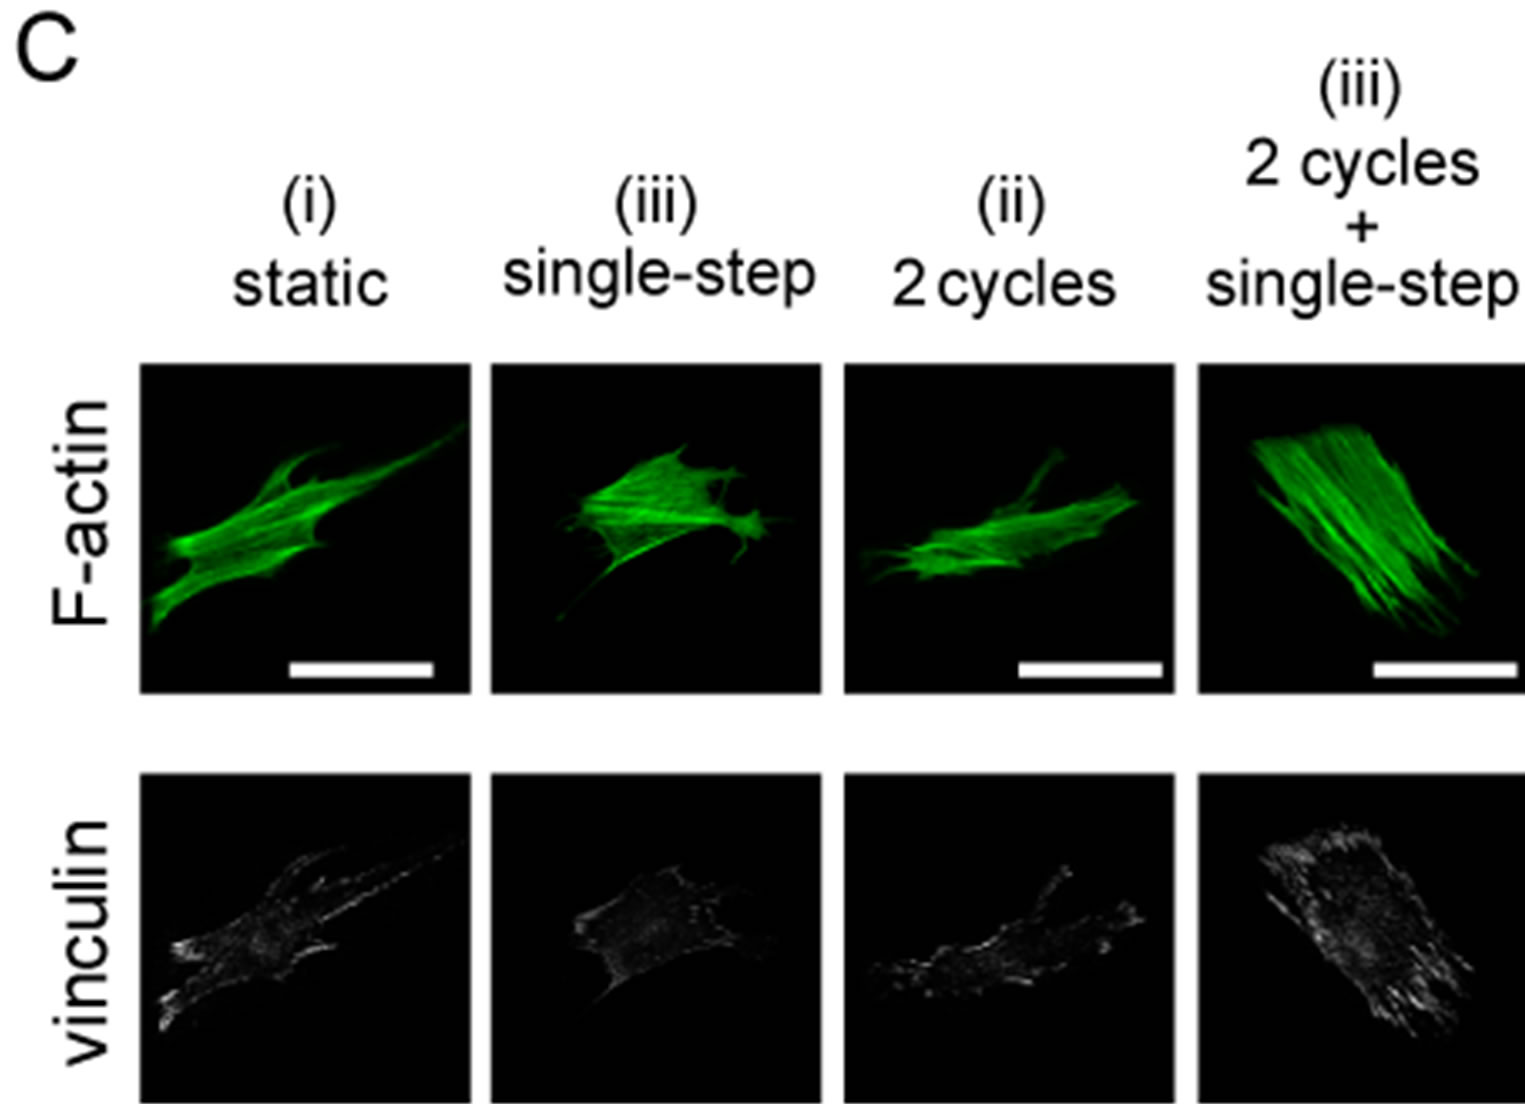
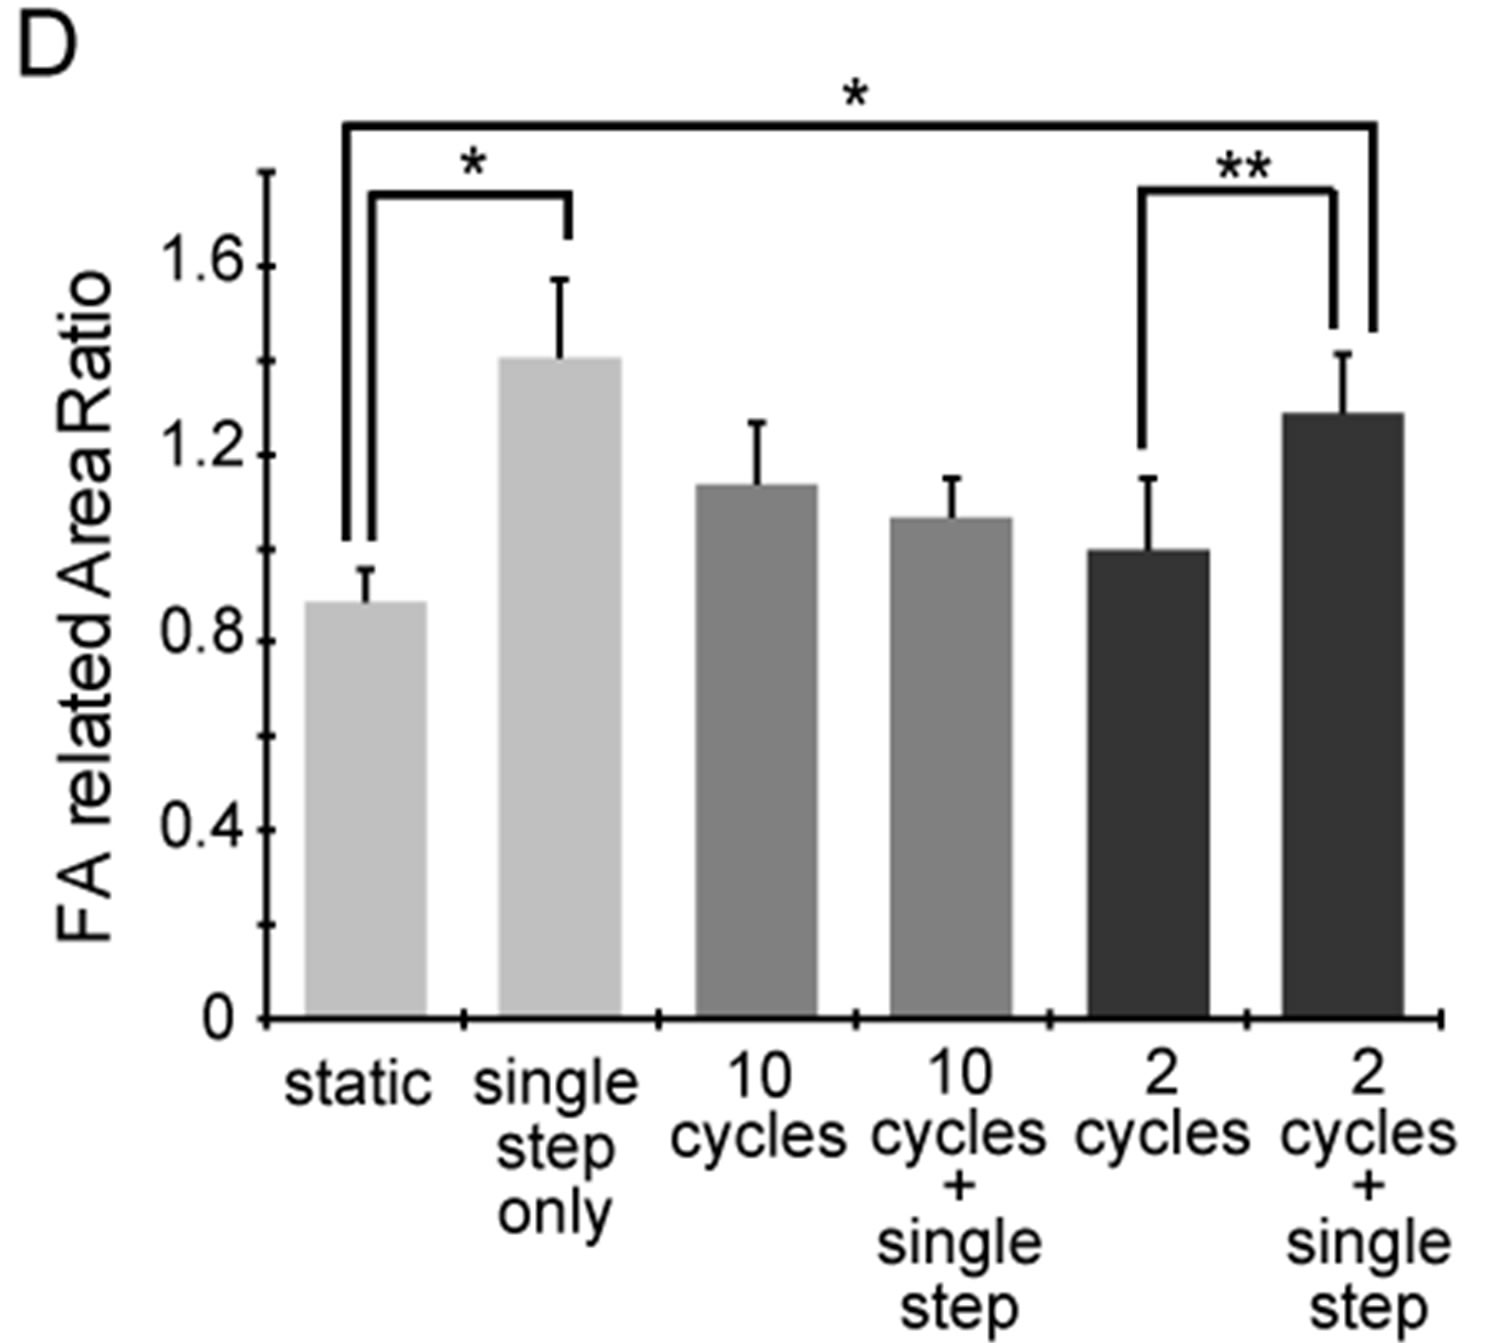
Figure 8. Changes in focal adhesion (FA) area under 2 or 10 sets of cyclic stretch. Myoblasts were cultured on elastic chamber and stained with anti-vinculin and phalloidin at a suitable timing after the application of mechanical stimulations. (A) Schematic drawing indicates the pattern of the applied strains. Cells were fixed and stained at the following 3 timings: “static”, term without any mechanical stimuli; “cyclic stretch”, time point 29 min after cyclic stretch; “cyclic stretch + single step”, time point 38 min after the single step-like stretch; (B)-(C) A set of fluorescent images under the condition of 10 sets (B) and 2 sets (C) of cyclic stretch. The scale bar indicates 50 μm; (D) Changes in FA area were statistically compared. To quantify the changes in FA areas under mechanical stretch, we used following methods. We used an established method [26]. Briefly, whole areas of a cell were measured by the cell contour which was traced using F-actin image and ImageJ software (NIH, MD, USA), and the vinculin positive areas in the cell were summed. The degree of FA areas in a cell is defined as following equation:

where Avin is the total areas of vinculin within a cell and AF-actin is the total areas of F-actin. Each data represent mean ± standard errors from 40 - 50 cells for two independent experiments. *indicates significant differences (p < 0.01) and **also indicates significant differences (p < 0.05) [26].
phosphorylatable MRLC [27] and RhoA inhibitors [28] are necessary.
Although it is still unclear how the different elasticity responses to single step-like stretch after 2 or 10 sets of cyclic stretch are induced, we predict that it may be due to a balance between activation and deactivation of MRLC. We observed that a single step-like stretch increased elasticity, and 2 sets of cyclic stretch did not alter the elasticity response; however, 10 sets of cyclic stretch inhibited the increase caused by the single stepike stretch (Figures 2 and 3). As these elasticity changes were accompanied with diand de-phosphorylation of MRLC (Figure 5), proteins that activate (kinases) or inhibit (phosphatases) the activity of MRLC may be involved in the elasticity response depending on the number of cyclic stretches. We hypothesize the following: net MRLC photion is determined by a balance of activity between MRLC kinases and phosphatases; differences in reaction rate between kinases and phosphatases responding to the cyclic stretch; homeostatic mechanism in kinase and phosphatase activity. To investigate these hypothezes, future work will include measuring the time course of both kinase and phosphatase activity after application of the cyclic stretches.
4. Acknowledgements
This work is supported by Scientific Research (C) (2157- 0158) to H. H., by Exploratory Research (21654058) to K. K., and by Grant-in-Aid for Young Scientists (B) (23770167) to T. M. from the Japan Society for the Promotion of Science.
REFERENCES
- J. A. Beamish, et al., “Molecular Regulation of Contractile Smooth Muscle Cell Phenotype: Implications for Vascular Tissue Engineering,” Tissue Engineering Part B-Reviews, Vol. 16, No. 5, 2010, pp. 467-491. doi:10.1089/ten.teb.2009.0630
- C. Galli, et al., “Osteocytes and WNT: The Mechanical Control of Bone Formation,” Journal of Dental Research, Vol. 89, No. 4, 2010, pp. 331-343. doi:10.1177/0022034510363963
- L. Y. Liu, et al., “Mechanisms for Osteogenic Differentiation of Human Mesenchymal Stem Cells Induced by Fluid Shear Stress,” Biomechanics and Modeling in Mechanobiology, Vol. 9, No. 6, 2010, pp. 659-670. doi:10.1007/s10237-010-0206-x
- Z. Yin, et al., “Stem Cells for Tendon Tissue Engineering and Regeneration,” Expert Opinion on Biological Therapy, Vol. 10, No. 5, 2010, pp. 689-700. doi:10.1517/14712591003769824
- I. Schofield, et al., “Vascular Structural and Functional Changes in Type 2 Diabetes Mellitus—Evidence for the Roles of Abnormal Myogenic Responsiveness and Dyslipidemia,” Circulation, Vol. 16, No. 5, 2002, pp. 3037- 3043. doi:10.1161/01.CIR.0000041432.80615.A5
- J. Harle, et al., “Effects of Ultrasound on the Growth and Function of Bone and Periodontal Ligament Cells in Vitro,” Ultrasound in Medicine and Biology, Vol. 27, No. 4, 2001, pp. 579-586. doi:10.1016/S0301-5629(00)00326-4
- S. H. Kook, et al., “Cyclic Mechanical Stretch Stimulates the Proliferation of C2C12 Myoblasts and Inhibits Their Differentiation via Prolonged Activation of p38 MAPK,” Molecules and Cells, Vol. 25, No. 4, 2008, pp. 479-486.
- K. Naruse, et al., “Involvement of SA Channels in Orienting Response of Cultured Endothelial Cells to Cyclic Stretch,” American Journal of Physiology-Heart and Circulatory Physiology, Vol. 43, No. 5, 1998, pp. H1532-H1538.
- T. Mizutani, et al., “Cellular Stiffness Response to External Deformation: Tensional Homeostasis in a Single Fibroblast,” Cell Motility and the Cytoskeleton, Vol. 59, No. 4, 2004, pp. 242-248. doi:10.1002/cm.20037
- M. Nagayama, et al., “Contribution of Cellular Contractility to Spatial and Temporal Variations in Cellular Stiffness,” Experimental Cell Research, Vol. 300, No. 2, 2004, pp. 396-405. doi:10.1016/j.yexcr.2004.07.034
- K. Tamura, et al., “Visualization of Stretch-Induced Intracellular Tensional Response of Single Fibroblasts by Mechanical Scanning Probe Microscopy,” Japanese Journal of Applied Physics Part 1—Regular Papers Brief Communications & Review Papers, Vol. 46, No. 8B, 2007, pp. 5631-5635.
- H. Haga, et al., “Elasticity Mapping of Living Fibroblasts by AFM and Immunofluorescence Observation of the Cytoskeleton,” Ultramicroscopy, Vol. 82, No. 1-4, 2000, pp. 253-258. doi:10.1016/S0304-3991(99)00157-6
- S. Na, et al., “Time-Dependent Changes in Smooth Muscle Cell Stiffness and Focal Adhesion Area in Response to Cyclic Equibiaxial Stretch,” Annals of Biomedical Engineering, Vol. 36, No. 3, 2008, pp. 369-380. doi:10.1007/s10439-008-9438-7
- T. G. Kuznetsova, et al., “Atomic Force Microscopy Probing of Cell Elasticity,” Micron, Vol. 38, No. 8, 2007, pp. 824-833. doi:10.1016/j.micron.2007.06.011
- T. Mizutani, et al., “Diphosphorylation of the Myosin Regulatory Light Chain Enhances the Tension Acting on Stress Fibers in Fibroblasts,” Journal of Cellular Physiology, Vol. 209, No. 3, 2006, pp. 726-731. doi:10.1002/jcp.20773
- T. Mizutani, et al., “Regulation of Cellular Contractile Force in Response to Mechanical Stretch by Diphosphorylation of Myosin Regulatory Light Chain via RhoA Signaling Cascade,” Cell Motility and the Cytoskeleton, Vol. 66, No. 7, 2009, pp. 389-397. doi:10.1002/cm.20378
- J. T. Stull, et al., “Myosin Light Chain Kinase Phosphorylation in Tracheal Smooth-Muscle,” Journal of Biological Chemistry, Vol. 265, No. 27, 1990, pp. 16683- 16690.
- S. Jungbauer, et al., “Two Characteristic Regimes in Frequency-Dependent Dynamic Reorientation of Fibroblasts on Cyclically Stretched Substrates,” Biophysical Journal, Vol. 95, No. 7, 2008, pp. 3470-3478. doi:10.1529/biophysj.107.128611
- K. D. Costa, et al., “Buckling of Actin Stress Fibers: A New Wrinkle in the Cytoskeletal Tapestry,” Cell Motility and the Cytoskeleton, Vol. 52, No. 4, 2002, pp. 266-274. doi:10.1002/cm.10056
- P. Reusch, et al., “Mechanical Strain Increases Smooth Muscle and Decreases Nonmuscle Myosin Expression in Rat Vascular Smooth Muscle Cells,” Circulation Research, Vol. 79, No. 5, 1996, pp. 1046-1053. doi:10.1161/01.RES.79.5.1046
- D. Kaspar, et al., “Proliferation of Human-Derived Osteoblast-Like Cells Depends on the Cycle Number and Frequency of Uniaxial Strain,” Journal of Biomechanics, Vol. 35, No. 7, 2002, pp. 873-880. doi:10.1016/S0021-9290(02)00058-1
- K. Jani and F. Schock, “Molecular Mechanisms of Mechanosensing in Muscle Development,” Developmental Dynamics, Vol. 238, No. 6, 2009, pp. 1526-1534. doi:10.1002/dvdy.21972
- A. J. Ricci, et al., “Mechano-Electrical Transduction: New Insights into Old Ideas,” Journal of Membrane Biology, Vol. 209, No. 2-3, 2006, pp. 71-88. doi:10.1007/s00232-005-0834-8
- P. G. Smith, et al., “Mechanical Stress Increases RhoA Activation in Airway Smooth Muscle Cells,” American Journal of Respiratory Cell and Molecular Biology, Vol. 28, No. 4, 2003, pp. 436-442. doi:10.1165/rcmb.4754
- J. J. Cunningham, et al., “Externally Applied Cyclic Strain Regulates Localization of Focal Contact Components in Cultured Smooth Muscle Cells,” Annals of Biomedical Engineering, Vol. 30, No. 7, 2002, pp. 927- 935. doi:10.1114/1.1500408
- S. S. An and C. M. Hai, “Mechanical Signals and Mechanosensitive Modulation of Intracellular [Ca2+] in Smooth Muscle,” American Journal of Physiology-Cell Physiology, Vol. 279, No. 5, 2000, pp. C1375-C1384.
- S. Komatsu, et al., “Effects of the Regulatory Light Chain Phosphorylation of Myosin II on Mitosis and Cytokinesis of Mammalian Cells,” Journal of Biological Chemistry, Vol. 275, No. 44, 2000, pp. 34512-34520. doi:10.1074/jbc.M003019200
- M. F. Santos, et al., “Rho Proteins Play a Critical Role in Cell Migration during the Early Phase of Mucosal Restitution,” Journal of Clinical Investigation, Vol. 100, No. 1, 1997, pp. 216-225. doi:10.1172/JCI119515
NOTES
*Corresponding author.