Journal of Sustainable Bioenergy Systems
Vol.4 No.3(2014), Article
ID:49026,12
pages
DOI:10.4236/jsbs.2014.43014
Numerical Analysis on Wood Pyrolysis in Pre-Vacuum Chamber
Hiroki Homma1, Hiroomi Homma2*, Muhammad Idris2
1National Institute of Technology, Matsue College, Nishiikumacho, Matsue, Japan
2University of North Sumatera, Jl. Almamater, Medan, Indonesia
Email: *hh-homma@dc4.so-net.ne.jp
Copyright © 2014 by authors and Scientific Research Publishing Inc.
This work is licensed under the Creative Commons Attribution International License (CC BY).
http://creativecommons.org/licenses/by/4.0/


Received 6 July 2014; revised 6 August 2014; accepted 18 August 2014
ABSTRACT
In the previous experimental work, a new technology system for wood pyrolysis was developed to aim at mitigating climate change, global warming, and energy crisis as well as enhancing low electrification in rural areas in developing countries. The new technology system equipped with a pre-vacuum chamber requires low cost and less maintenance. However, large wood pyrolysis in the pre-vacuum chamber is rather complicated. To obtain a good understanding of the previous experimental results, a numerical analysis taking account of heat-mass transfer and chemical reaction is carried out. Two-step general reaction model is proposed for the numerical analysis. The first stage is volatile and char formation from the wood pieces and the second state is decomposition of the volatile to five species including vapor of tar. In this analysis, chemical formulae of the volatile and the tar are successfully identified hypothetically. The results obtained by this numerical analysis can explain the experimental results reasonably and provide useful information about time evolution of volatile formation, temperature change in pre-vacuum chamber with time, and species mole concentration decomposed from the volatile.
Keywords:Pyrolysis, Pre-Vacuum Chamber, Chemical Reaction, Volatile Sublimation, ANSYS Fluent

1. Introduction
Conference of the parties (COP) under United Nations Framework Convention on Climate Change (UNFCCC) is held every year to discuss measures and action plans for decrease of greenhouse gas emission [1] . However, effective and acceptable measures or action plans for all member countries are not proposed yet, so far. Although necessity of technology development for renewable energy is commonly recognized by all the countries, the technology development has not reach a satisfactory level.
Some developing countries have another energy issue, that is low electrification. According to the World Energy Outlook Database by International Energy Agency, IEA [2] , electrification in rural areas is around 65%. In many cases, it is most unlikely that those rural areas are covered by grids from power stations. Those rural areas are isolated from power supply.
Seeking a solution to reduce greenhouse gas emission causing climate change, or global warming and furthermore to solve another type of energy issue, low electrification in rural areas described above, we may adopt biomass pyrolysis as the most practical technology. Recently, projects of biomass pyrolysis are carried out to develop large-scale plants on commercial basis [3] . In contrast to the large-scale plant, in the previous work [4] , aiming at enhancement of electrification in rural areas using pyrolysis gas engine generation, the authors developed a new technology of wood pyrolysis equipped with a pre-vacuum reactor chamber so that the pyrolysis gases could be directly used for a gas engine generator. In this new pyrolysis technology, no pre-treatment of feedstock and post-treatment of pyrolysis gases are necessary, and the system is a simple and requires less maintenance.
However, pyrolysis phenomena inside the pre-vacuum chamber is rather complicated. In order to understand the pyrolysis processes inside the pre-vacuum chamber and to find out ways enhancing pyrolysis performance of the plant, numerical analysis could provide useful information, especially on insight of pyrolysis processes in the pre-vacuum chamber.
According to the G. M. Simmons, and M. Gentry’s research [5] , if a particle size is greater than a certain limitation, chemical kinetics and heat transfer from the particle surface, or furnace environment to inside of the particle take place competitively and chemical kinetics cannot be considered as one for a particle heated uniformly, or a particle under uniform temperature. Numerical analysis on pyrolysis of wood has been carried out by several researchers [6] -[11] . Most of the researches analyze pyrolysis processes considering chemical kinetics and heat transfer inside particles, even though wood particles are small. In those numerical analyses, fundamental mathematical models are constructed taking into account conservation of energy, momentum, and continuity (mass) as well as chemical reactions and are solved simultaneously using numerical methods such as finite difference, Runge-Kutter, and others. However, in those analyses, only simple boundary conditions and simple initial conditions are postulated to obtain numerical solutions.
On the other hand, computational fluid dynamics (CFD) methods based on finite element concept are increasingly adapted for simulation of wood pyrolysis. One of most widely spread CFD finite element (volume) codes is ANSYS Fluent. For instance, K. Papadikis, et al. applies Fluent code for fast pyrolysis of biomass [12] -[14] . Advantages to use CDF finite element or volume code are to obtain overviews of pyrolysis process in reactors as well as detail analysis on heat and mass transfer including phase changes and chemical reactions inside wood particles. CFD approaches to pyrolysis are well reviewed by Y. Wang and L. Yan [15] .
In this work, heat transfer, fluid flow, and chemical reactions taking place during the pyrolysis process are numerically analyzed to understand phenomena inside the pre-vacuum chamber in the previous experiment [4] . The aim of this work is to obtain information about the phenomena accompanied by wood pyrolysis in the pre-vacuum chamber and to collect important factors controlling pyrolysis processes of large wood pieces used in the previous experiment.
2. Modelling of Pre-Vacuum Chamber Pyrolysis
2.1. Finite Element Model of Pre-Vacuum Chamber
ANSYS Fluent 12.0 was used for numerical analysis. Mesh model of the pre-vacuum chamber, wood, and furnace is shown in Figure 1. The problem is axi-symmetric and in the figure, a half of the cross section is shown. The actual dimensions of the pre-vacuum chamber are 254.0 mm in inner diameter, 13.0 mm in wall thickness, and 500.0 mm in inner height. However, in the finite element model, the wall thickness is zero. The pre-vacuum chamber was heated by wood furnace in the experiment. This heating effect is modelled by metal bath attaching the pre-vacuum chamber. The metal bath temperature is given as a function of time, which is the time-history of the temperature measured at the bottom center of the pre-vacuum chamber in the previous experiment [4] .
Thirty to forty wood pieces undergoing thermal decomposition are piled up in the pre-vacuum chamber. In the modelling, such randomness and complexity in wood pieces piling up are simplified by five concentric hollow

Figure 1. Fluent analysis model.
cylinder wood pieces with 241.5 mm height. The height is calculated so that total wood piece mass should equal 5.0 kg. The space between the concentric hollow cylinder is 1.0 mm and volatile gases from wood pieces enter the upper part of the pre-vacuum chamber through this spaces.
In the previous experiments [4] , the temperature near the top of the chamber inside was measured. This data is input into the numerical analysis. The heat exchange between the chamber wall and ambient air is postulated only through convection, not radiation. Material properties used for numerical analysis are summarized in Table1 Much higher value is assigned to thermal conductivity of wood, taking into account the fact that wood may become porous and hot volatile gas flows inside porous wood during the pyrolysis process.
2.2. Chemical Kinetics
Chemical kinetics on wood pyrolysis was studied by many researchers and review articles are also published [16] [17] . More recently, comprehensive review is published by C. D. Blasi [18] . Chemical kinetics of wood pyrolysis is not simple, because the wood is consisted of three main constitutions, cellulose, hemicellulose, and lignin, and those chemical kinetics are different. In spite of such difficulty, several models on chemical kinetics of wood pyrolysis are proposed. Based on the above review articles, they are categorized into:
1) One stage (one composition) global model.
2) One stage (one composition) and multi-reaction (or competitive parallel reaction) model 3) Two-stage and semi-global model 4) Three compositions and multi-reaction 5) Secondary tar cracking model One stage global model regards thermal decomposition of wood as decompositions into gas, tar and char from one substance (one composition) of wood. This model is widely used in the numerical analysis.
In this numerical analysis, two-stage and global model is adopted. The first stage is volatilization from wood and char formation. The second stage is decomposition from volatile to tar and gases. In the volatilization of wood, several kinds of volatiles are produced, but in the numerical analysis, one species of volatile is assumed. Experimental results [4] showed that secondary tar cracking process may not take place under the used experimental conditions. Therefore, the decomposition of the volatile is considered as one stage reaction. To simulate thermal decomposition by ANSYS Fluent, we must identify chemical formulae of wood, volatile and chemical kinetics parameters.
Many experimental data on chemical kinetics, activation energy and frequency factor of Arrhenius equation are available in literatures [16] -[18] , but as mentioned by C. D. Blasi [18] , these parameters are sensitive against pyrolysis temperature, heating rate, wood species, wood particle size and other factors.
As mentioned above, this numerical analysis adopts two-stage (one composition) global reaction model. The first stage is volatilization from wood and this process is not expressed by Arrhenius type of chemical kinetics in

Table 1 . Material properties used for numerical analysis.
this analysis. The volatilization is a main factor for pressure increase in the pre-vacuum chamber besides temperature rise. The volatilization from large pieces is rather complicated phenomenon as mentioned by G. M. Simmons, and M. Gentry [5] . This subject will be discussed in the next work and in this numerical analysis; the volatilization rate is adjusted so that the calculated absolute pressure in the pre-vacuum chamber would agree with the experimental result. The model used for the numerical analysis is outlined in Figure 2. In the first stage, volatile comes out from wood and char is remained in the wood. In the second stage, the volatile is decomposed into tar vapor and gases.
The decomposition of the volatile is assumed to conform to Arrhenius type of chemical kinetics as shown in Equation (1).
 (1)
(1)
Activation energy and frequency factor used for the numerical analysis are given in Table2
The frequency factor A was gradually increased from 1016.85 to 1028.6 to keep stable numerical analysis as a function of time and temperature so as to decompose majority of volatile gas entering the pre-vacuum chamber, and was fixed at a maximum of 1028.6.
2.3. Chemical Formulae and Reaction
Wood species used in the experiment was rubber wood, which is of low humidity and free of latex. In the numerical analysis, humidity is neglected. Wood has three main constitutions, cellulose, hemicellulose, and lignin and former two constitutions are intrinsically series connection of many saccharide units. The chemical formulae of cellulose and hemicellulose are known as (C6H12O6)n, and (C5H8O4)m, where n and m are ten to fifteen thousand and one to three hundred, respectively. On the other hand, lignin has quite complicated structure. Until now, its chemical structure is not completely clarified yet. In such situation, one trial to estimate its molecular elements ratio was done by Morais et al. [19] and it is estimated as (C9H7.9O2.73(OCH3)1.5)l. Wood is compound of these three constitutions. Constitution ratio of rubber wood was measured as around 44 wt% of cellulose, 33 wt% of hemicellulose, and 22 wt% of lignin [20] . Molar weight of three constitutions was also measured, and average molar mass of cellulose was 28.4 × 10³ ~ 109.0 × 10³ g/mol [21] , that of hemicellulose was 3.72 × 10³ ~ 54.3 × 10³ g/mol [22] , and that of lignin was 7.6 × 10³ ~ 95.6 × 10³ g/mol for hard wood lignin [23] [24] . Three constitutes are chemically bonded in part with each other, but substantially exist independently in wood and thus, wood cannot be expressed by one chemical formula as a molecular.
In spite of such awkward circumstance, ANSYS Fluent requires to input chemical formulae of involved all species to analyze chemical reaction. To avoid large uncertainty in the numerical analysis of wood pyrolysis, we will not deduce the chemical formula of the rubber wood in a bold manner. Thus, this numerical analysis focuses on the chemical reaction in only the second stage, but not including the first stage shown in Figure 2, because the second stage can be definitely treated by Fluent code with a volumetric reaction option.
For this purpose, we must identify a chemical formula of the volatile. For the identification, the following assumptions are made.
1) As mentioned above, molecular weights of three constitutions are not significantly different. Then, as a null hypothesis, it is postulated that three constitutions have the same molecular weight. Then the series connection number n, m, and l are 1.145, 1.557, 1.000 for cellulose, hemicellulose and lignin.
2) In addition, it is also postulated based on the experimental results by W. Jin et al. [25] that volatile gases are decomposed from 100% of cellulose and hemicellulose, and 100% of lignin from which 40 wt% of carbon has been extracted for char.
3) Constitution ratio of rubber wood is 45 wt% of cellulose, 33 wt% of hemicellulose, and 22 wt% of lignin, which is slightly modified from the result [20] mentioned above.
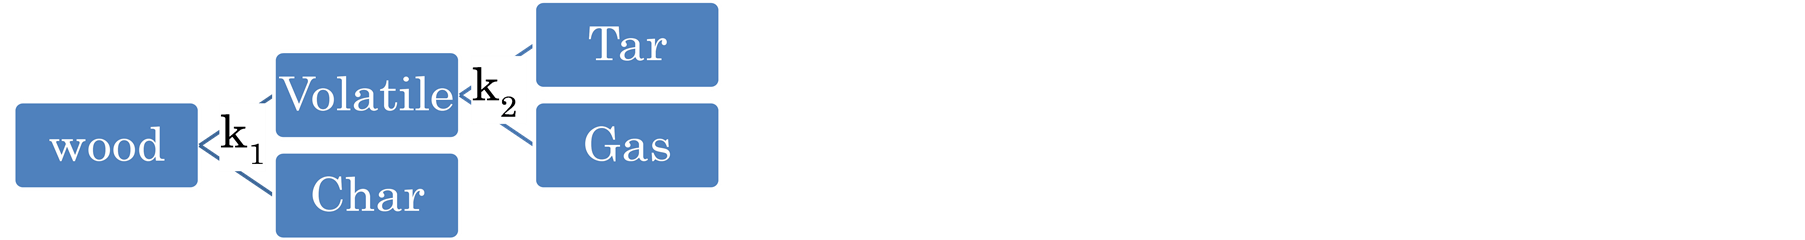
Figure 2. Pyrolysis kinetics used for this numerical analysis.
Table 2. Arrhenius type of chemical kinetics parameters.
From these assumptions, elements C, H, and O of the volatile gas is calculated as C6.5H13.0O6.1. Then, a chemical formula of the volatile gas molecular is defined as
 (2)
(2)
where λ is integer and will be decided later.
This volatile gas is decomposed to H2, CH4, CO, CO2, and tar vapor. In the previous experiment [4] , volume contents of the former four gases were measured by a gas chromatograph after a part of CO2 gas was removed by CO2 absorber. Those were 18.8, 36.6, 18.6, and 24.9 Volume%, respectively. In addition, the weights of four gases and the removed CO2 gas were measured. Those were 1.13 kg, and 0.49 kg, respectively. From these data, the volume percent of four gases before the CO2 absorber are determined as 15.6%, 30.3%, 15.4%, and 38.8%. However, when the element balance of the final chemical reaction expressed by Equation (5) is considered, the mole concentration of gas yields is redefined as:
 (3)
(3)
Primary tar was mostly produced from the wood pyrolysis in the previous experiment. Many researchers [26] -[28] investigate compositions of primary tar. Especially, comprehensive data on tars is reported by T. A. Milne and others [29] . Tar is compound of many aromatic hydrocarbon, CaHbOc.
Eventually, the second stage decomposition shown in Figure 2 is expressed as
 (4)
(4)
All parameters can be calculated from element balance between both sides of the above equation. In a matter of fact, unknown variables are more than element balance equations. Then, after several trials, α, β, γ, and λ are selected as 2, 1, 2, and 3 for the smallest integers combination, and other three unknown variables a, b, and c are obtained under the condition that all those are integers. Then, the tar compound average molecular formula is given as C9H18O4 T. A. Milne and others [29] indicated that the primary tar contains wide range of molecules from the lightest molecular Methanoic, CH2O2 the heaviest molecular Cellobiosan, C12H20O6. This molecular range contains the tar compound average molecular formula obtained from Equation (4).
Finally, the following equation is obtained for the second stage chemical reaction.
 (5)
(5)
The above equation is used for ANSYS Fluent analysis.
2.4. Volatilization
The first stage in pyrolysis kinetics shown in Figure 2 is sublimation of volatile substances in solid wood as volatile gases. In Figure 2, the kinetics rate is expressed by k1. Of course, we can define k1 as a certain equation like Arrhenius equation, or an equation to express sublimation phenomenon. Nevertheless, this numerical analysis uses a practical way to avoid a pure theoretical approach, because the objectives of this numerical analysis are not clarifying whole chemical kinetics of wood pyrolysis in details, but understanding pyrolysis process of large wood pieces in a rather practical phenomenological manner. Therefore, the volatilization rate is assumed numerically so that the pressure change in the pre-vacuum chamber measured in the experiment can be fittingly reconstructed by the numerical analysis. The volatile gas flows at a certain velocity into the pre-vacuum chamber from inlets made at the bottom of the chamber as shown in Figure 1. In the numerical analysis, volatile gas velocity is the same at all the inlets and adjusted observing the pressure change as follows:
Time < 890.0 sec; v = 0.0 m/sec 890.0 sec < Time < 960.0 sec; v = 1.0 × 10⁻² m/sec 960.0 sec < Time < 1110.0 sec, v = 5.2 × 10⁻³ m/sec 1110.0 sec < Time < 1170.0 sec; v = 0.0 m/sec 1170.0 sec
2.5. Endothermic Reaction
The thermal decomposition for wood pyrolysis is well known as endothermic and exothermic reactions [30] . W. C. Park [30] mentioned that numerical analysis on temperature distribution inside a wood particle undergoing pyrolysis could provide a good agreement between the numerical and measured results if the enthalpy of 66.0 kJ/kg was used for a whole pyrolysis reaction, in which plus sign of the enthalpy means the endothermic reaction.
In this numerical analysis, the endothermic reaction is expressed taking into account the species standard state enthalpy. The standard state enthalpy of each species is provided in Fluent database. If the standard state enthalpy provided by Fluent is used for volatile decomposition shown in Figure 2 and then, the chemical reaction rate is so rapid that volatile gas entering the pre-vacuum chamber can be almost completely decomposed, gas temperature in the chamber drops into the value less than 273 K. This is not realistic.
From the thermal decomposition expressed by Equation (5), total enthalpy can be calculated using database provided by Fluent. When the volatile of 1 kg is decomposed, total standard state enthalpy is calculated as 4827.7 kJ/kg. In this numerical analysis, several trial calculations were done changing species formation enthalpy from one fifth to one twentieth of Fluent database. When one fifth of species standard state enthalpy, namely total enthalpy, 965.6 kJ/kg is adopted, reasonable results can be obtained. However, this enthalpy value is slightly higher than the values obtained by other researchers [31] [32] . The species standard state enthalpy used in this numerical analysis is only for the decomposition of volatile gas, while other researchers’ data may be for the total pyrolysis process of solid wood pieces, which includes exothermic reaction of char formation.
3. Numerical Results
The temperature and the pressure were monitored as a function of time during the experiment [4] . As described in the previous section, volatile formation from wood pieces in the pre-vacuum chamber is expressed by numerically giving flow velocities at the inlet shown in Figure 1. Volatile gas flowing in the pre-vacuum chamber is decomposed according to the chemical reaction expressed by Equation (1). In this section, numerical results obtained by the current model are explained.
3.1. Pressure Evolution with Time
Floating pressure option of ANSYS Fluent was used to calculate absolute pressure in the pre-vacuum chamber.
The initial absolute pressure was set as 2.0 × 10⁴ Pa. The absolute pressure of gas in the pre-vacuum chamber is plotted as a function of time in Figure 3.
In the figure, the experimental result [4] is also plotted to compare with the numerical result. Of course, very good agreement between both results can be seen. This could suggest that volatile gas amount from wood pieces is appropriately reenacted in the numerical analysis. This numerical analysis also provides a corroboration of the fact that the pressure increase before 890 seconds is caused by the temperature increase alone, but not by volatile gas from wood pieces, because in the numerical analysis, volatile flow in the pre-vacuum chamber begins after 890 seconds.
Actually, formation of volatile gas from wood at the first stage indicated in Figure 2 may continuously
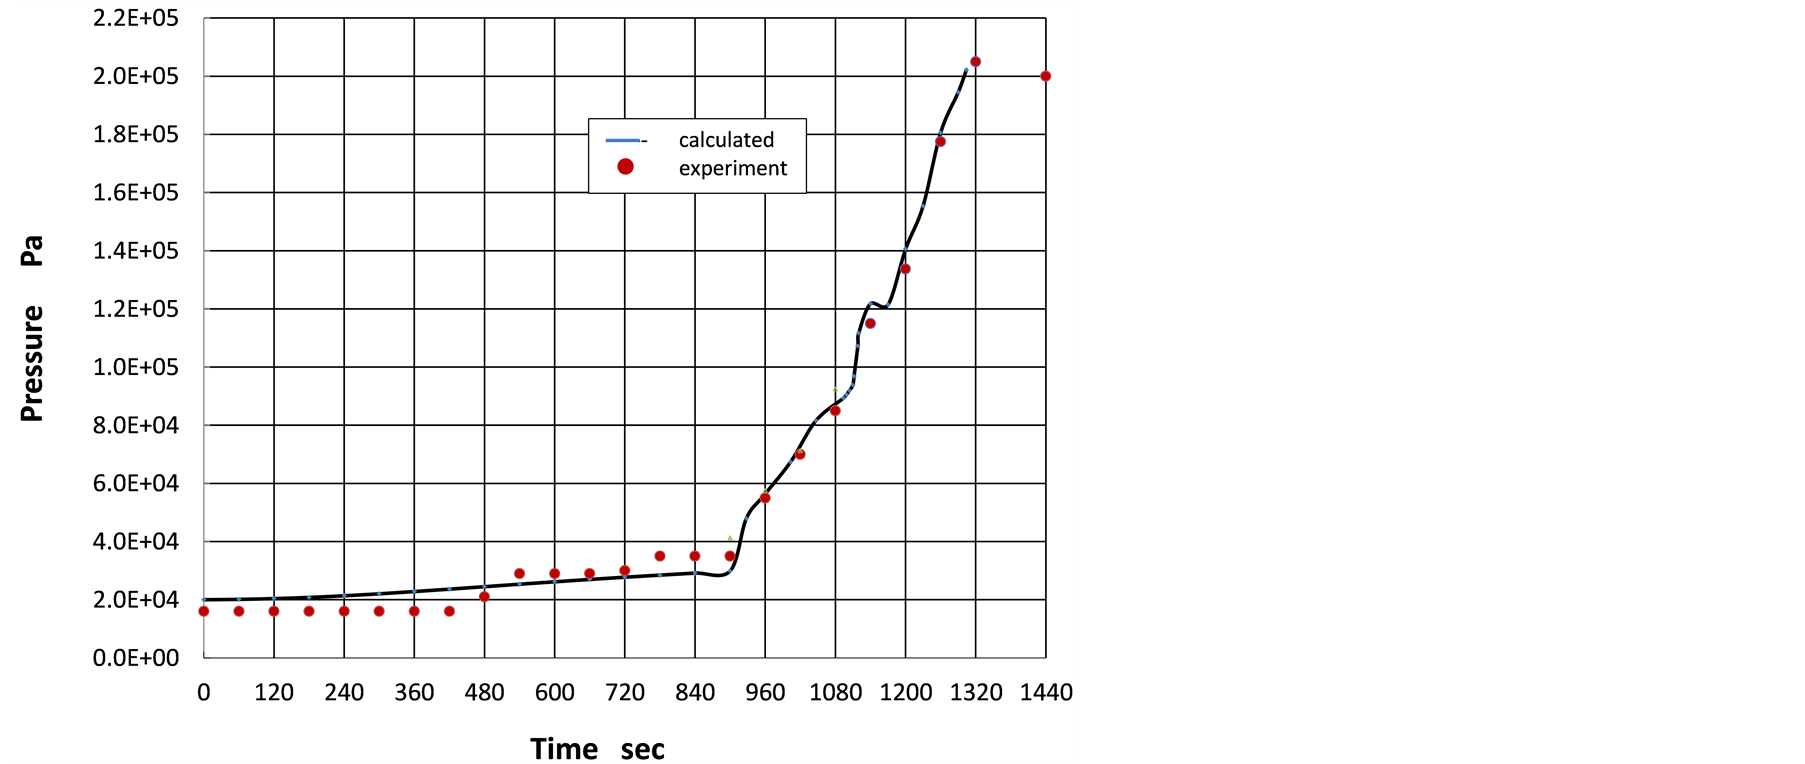
Figure 3. Pressure evolution with time in pre-vacuum chamber.
change in its rate through the whole process. In the numerical analysis, smooth transition from one time zone to the other mentioned in section 2.4 are provided in terms of mathematical functions of time.
3.2. Temperature in Pre-Vacuum Chamber
In Figure 4, temperature distribution in the pre-vacuum chamber is shown at the time before pyrolysis starts and the time when the pressure reaches 2 × 10⁵ Pa. The chamber wall is heated by the furnace and exposed at high temperature, but the chamber center is kept at moderate temperature. It is also noted that the chamber temperature distributes from the chamber wall to the center before the pyrolysis starts, while the chamber temperature after the pyrolysis has progressed is almost uniform at around 350 K.
In Figure 5, volume-averaged temperature of gases in the pre-vacuum chamber is plotted against the time. The temperature strongly depends on thermal decomposition, because of the endothermic chemical reaction. As mentioned above, this numerical analysis is carried out using one fifth of standard state enthalpy of each species provided by Fluent database. If the chemical reaction is slow, volatile gas flowing from the chamber bottom cannot be decomposed completely, certain volume of volatile gas is remained in the chamber. On the other hand, if the chemical reaction is so fast that almost all volatile gas can be decomposed into five species according to Equation (5), significant endothermic event appears on temperature-time diagram. In Figure 5, after 1100.0 seconds, volume-averaged temperature of gases in the pre-vacuum chamber steeply drops from 440 K to 320 K.
3.3. Decomposition of Volatile Gas
After 890.0 seconds, the volatile gas enters the pre-vacuum chamber and undergoes thermal decomposition. In Figure 6, mole concentration of each species, volume-weighted average in the pre-vacuum chamber, is plotted as a function of time from 860.0 seconds. Mole concentration of each species gradually increases with time after the thermal decomposition starts at 890 sec. After 1110 sec, rapid thermal decomposition progresses and mole concentration of each species steeply jumps up and continues to increase, while the volatile mole concentration drops down and stays a level of less than 2.02.0 × 10−3 kmol/m3.
In Figure 7, mole concentration of volatile at 1304 sec is plotted along the center axis of the pre-vacuum chamber.
The figure indicates that the volatile does not exist upper part of the vacuum chamber, but remains in the inlet pathes between wood pieces.
3.4. Density of Species
Gas density in the pre-vacuum chamber is calculated for each cell by Fluence. Then, in this numerical analsyis, volume weighted average of the density was evaluated for the upper room of the pre-vacuum chamber where volatile gas does not exist. In Figure 8, time evolution of averaved gas density is shown. As a result of volatile
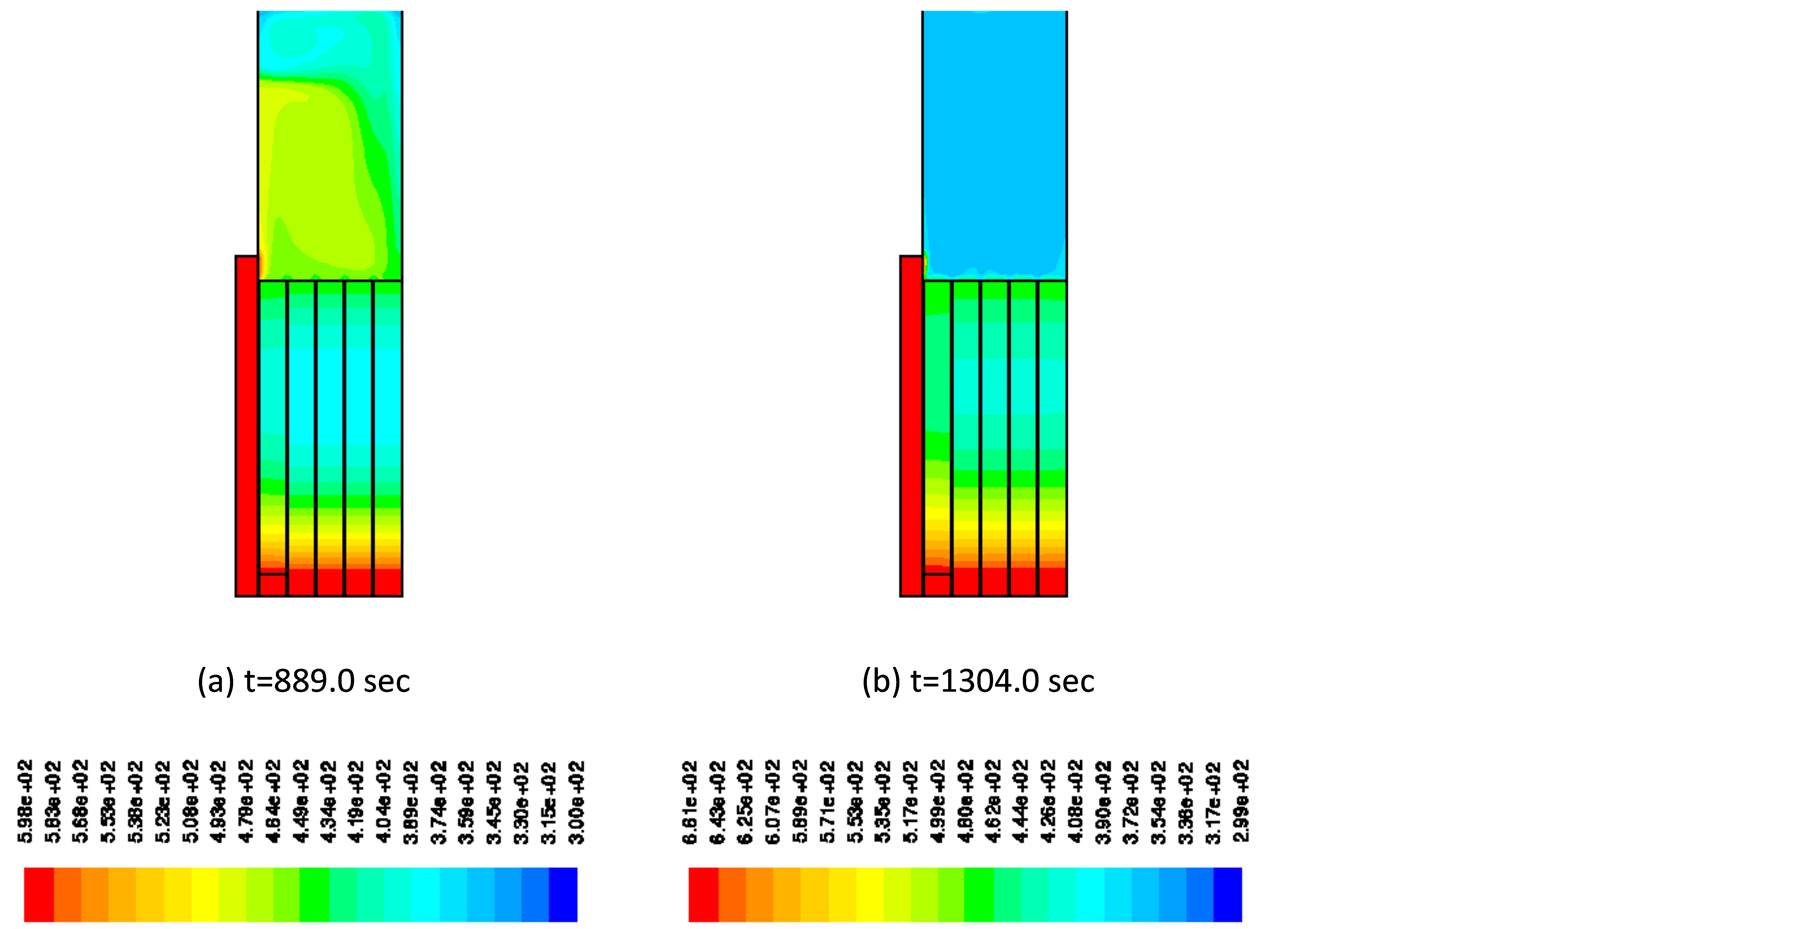
Figure 4. Contour of temperature in pre-vacuum chamber at 889 sec and 1304 sec.
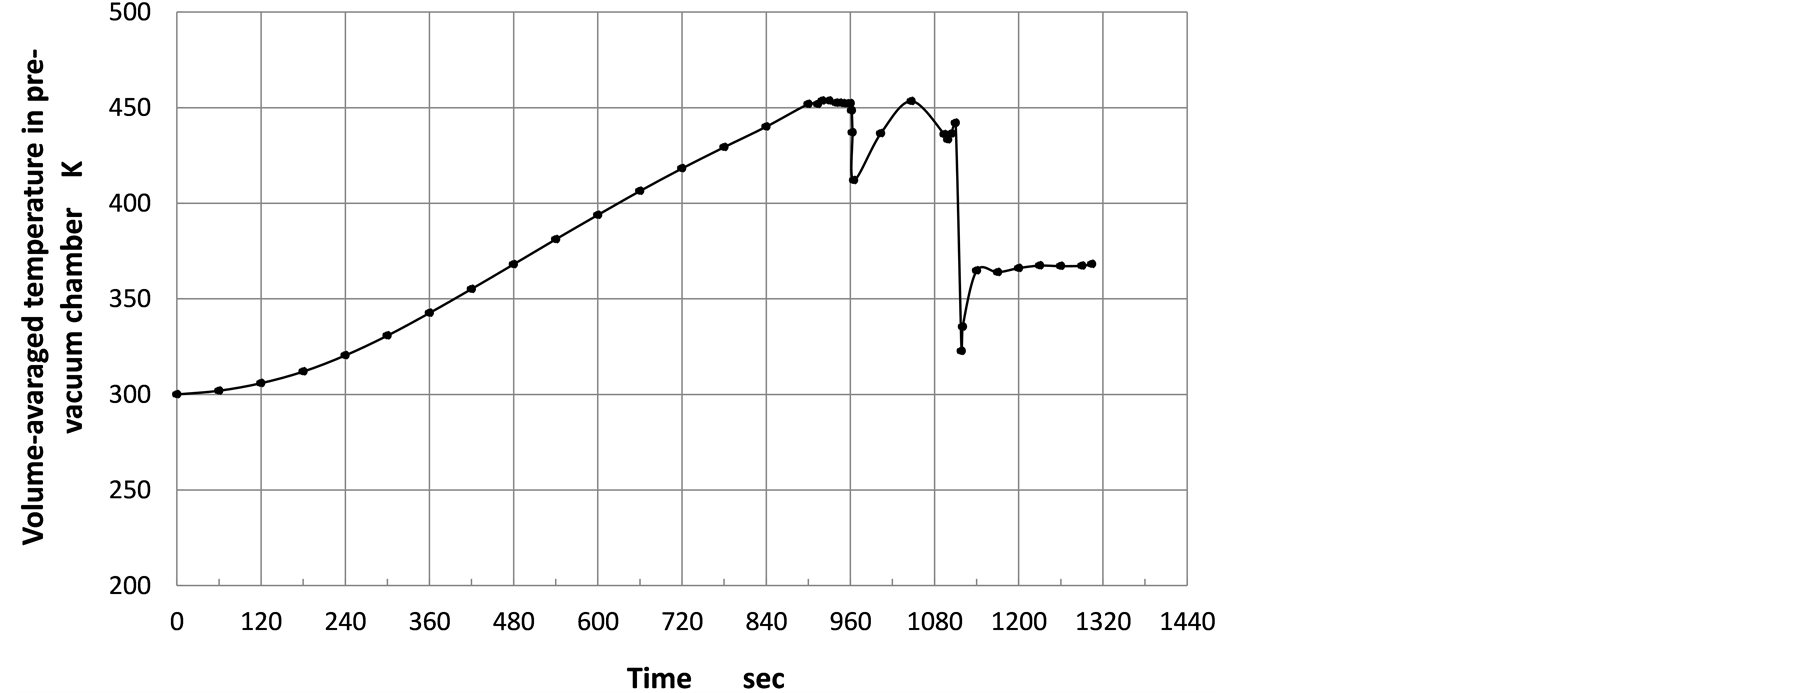
Figure 5. Time evolution of volume-averaged temperature in pre-vacuum chamber.
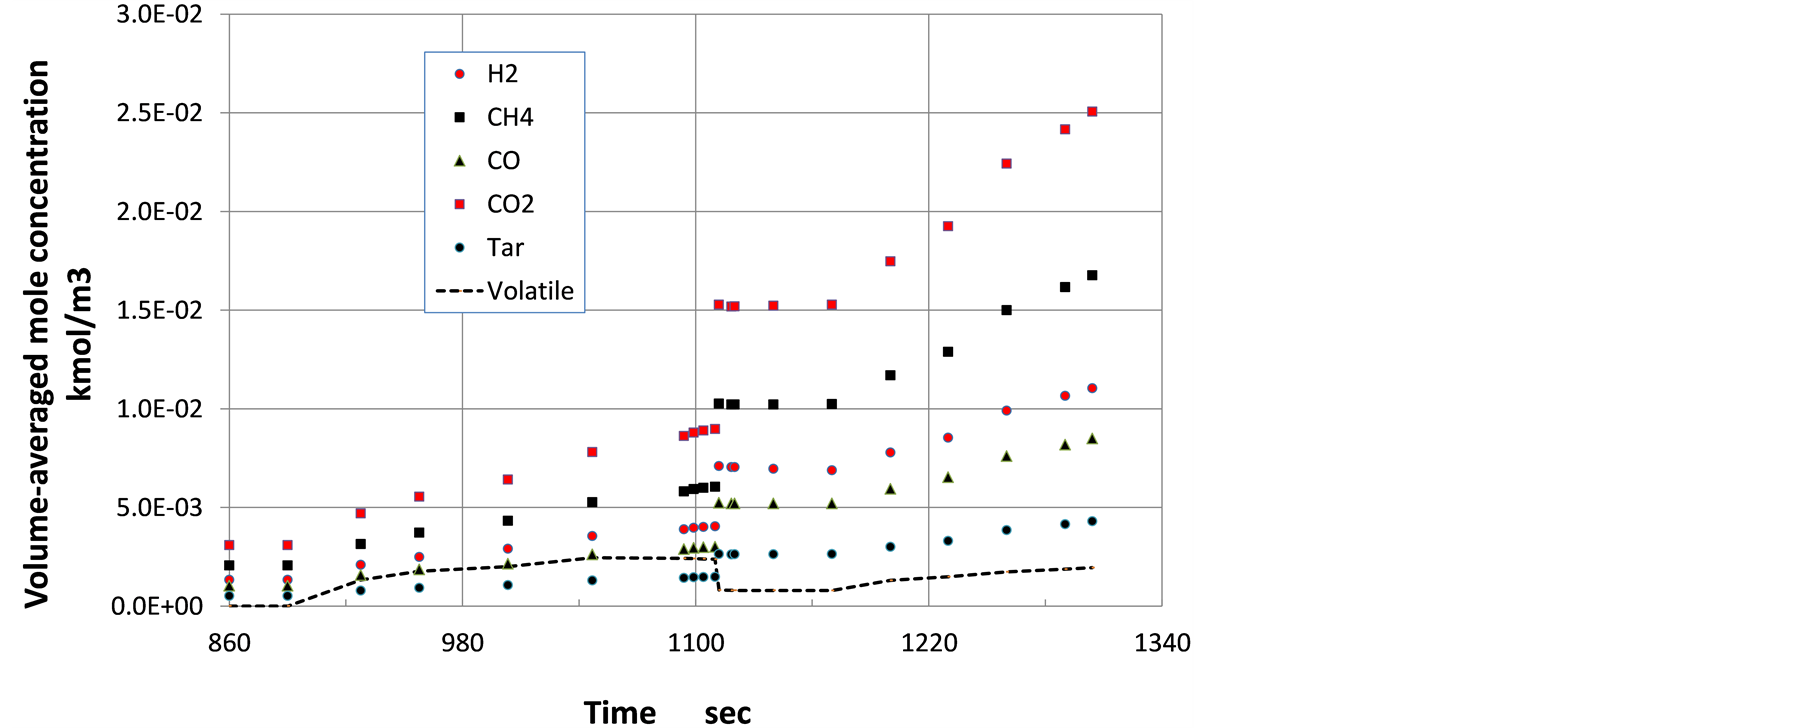
Figure 6. Mole concentration of each species as a function of time.

Figure 7. Volatile mole concentration along pre-vacuum chamber center axis at time of 1304 seconds.
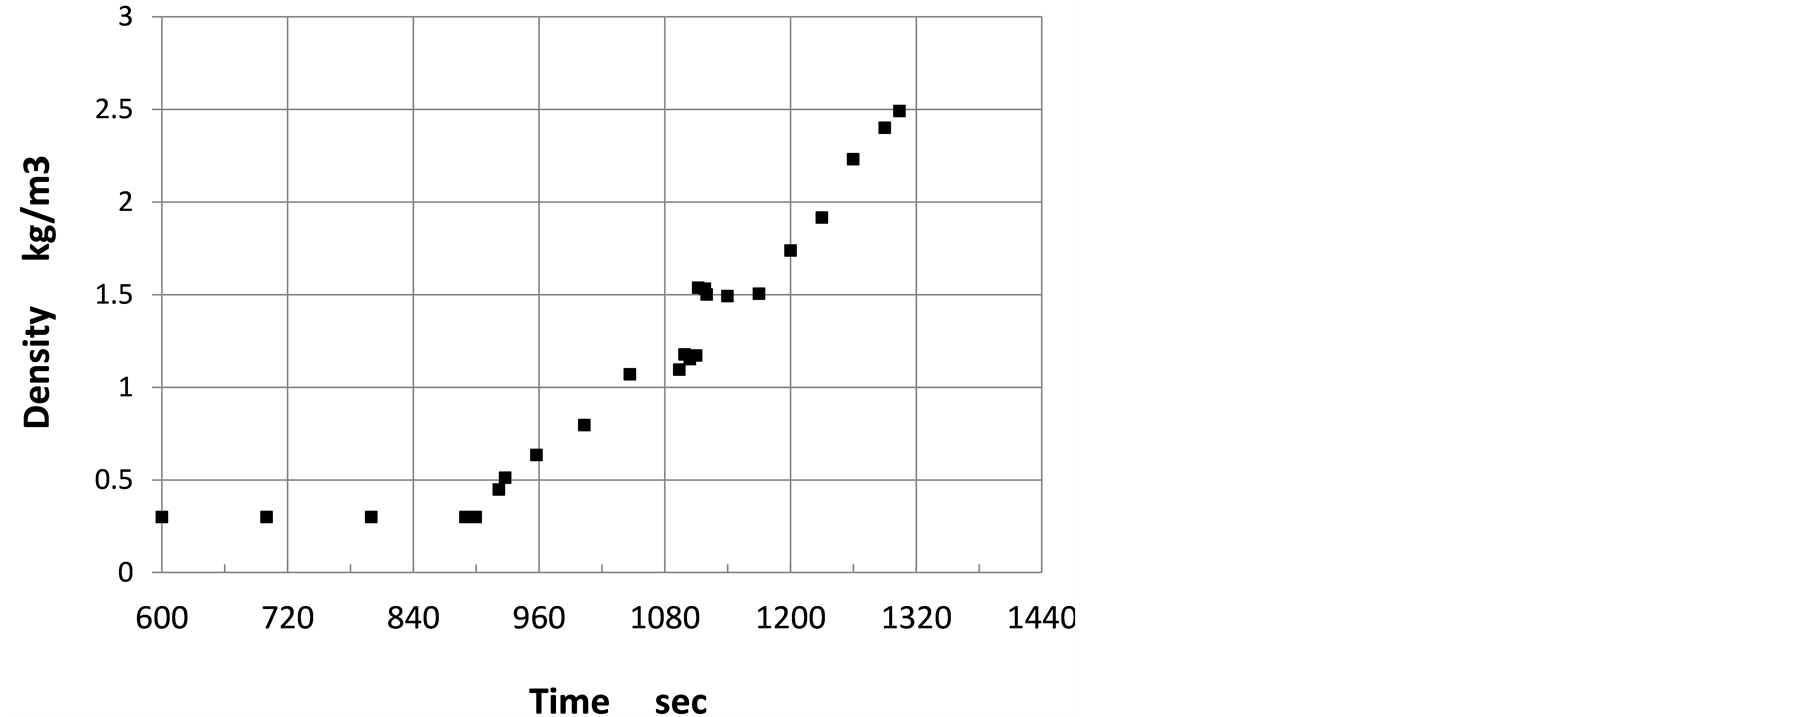
Figure 8. Time evolution of gas density in pre-vacuum chamber.
inflow into the pre-vacuum chamber, gas density enhances. Soon after volatile flows in the pre-vacuum chamber, the averaged gas density steeply increases and after 1110 secods, the density is almost constant for a short period. Then, the density steadly increases. The density-time evolution directly reflects the volatile flow volume into the pre-vacuum chamber.
4. Discussion
4.1. Volatile Formation
Volatilization from wood pieces is treated as isothermal reaction in this numerical analysis. According to the other researchers [31] [32] , volatile gas formation from wood particle is an endothermic reaction while char formation from wood is an exothermic reaction. The enthalpy of total pyrolysis is the sum of the both reaction enthalpies. In this numerical analysis, the both thermic reactions are neglected and only volatile gas decomposition is considered. However, volatile gas entering inlets at the bottom of the pre-vacuum chamber is heated up to the temperature around 440 K at the wood top edge. This may compensate the exothermic reaction for char formation.
As shown in Figure 8, density of gas steeply increases after inflow of volatile gas. The first steep increase in the density corresponds to inflow of the volatile gas of 1.0 × 10⁻² m/sec, and the plateau in the density-time evolution corresponds to no inflow of the volatile gas. After decomposition starts, the volume-weighted average of the gas temperature in the pre-vacuum chamber drops slightly, but after a while, the average temperature increases again to experience a steep drop from 440 K to 320 K. The steep temperature drop was also observed at around 1200 sec in the experiment [4] . The numerical results suggests that the steep temperature drop is due to the burst in the endothermic chemical reaction. In the experiments, the temperature was measured near the bottom of the pre-vacuum chamber and the steep temperature drop was around 150 K, while the numerical result is the volume-weighted average of the gas temperature and the steep drop is around 120 K. This fact may suggest that the numerical analysis can reconstruct the experimental events within an acceptable deviation, although the experiment showed the continuous increase in the temperature after the steep temperature drop, while in the numerical analysis, the temperature is almost constant after the steep drop.
4.2. Decomposition of Volatile Gas
Decomposition of the volatile gas is considered as endothermic reaction in this numerical analysis. As seen in Figure 6, five species, H2, CH4, CO, CO2 and tar are contained in the pre-vacuum chamber under the initial condition for Fluent analysis. Total mole concentration of those five species is calculated so as to pressurize the pre-vacuum chamber up to 2.0 × 10⁴ Pa for the initial absolute pressure. The density of gas averaged by a volume weighting method is calculated for the upper room of the pre-vacuum chamber in which volatile gas does not exist as shown in Figure 7. The averaged density is shown in Figure 8. The density increases from 0.30 kg/m3 to 2.50 kg/m3 when the pressure increases from 2.0 × 10⁴ Pa to 2.0 × 10⁵ Pa. Under the constant temperature and the constant volume, the pressure is proportional to the density. However, because the temperature is also increased from 300 K to 370 K as shown in Figure 5, the density does not reach 3.0 kg/m3.
The upper room of the pre-vacuum chamber has 2.04 × 10⁻³ m3 in volume. The yield gas weight including tar vapor can be calculated as
 (6)
(6)
Yield gas weight including tar vapor calculated above is much less than the final gas yield and tar yield obtained by the experiment [4] , 3.56 kg. This suggests that the numerical analysis is carried out for just beginning of the pyrolysis process. The period 414 seconds from the beginning of chemical reaction at 890 seconds to the time 1304 seconds when the pressure reaches 2.0 × 10⁵ Pa, is much shorter than total pyrolysis time, 5410 seconds obtained by the experiment [4] .
It can be suggested that after the pressure reaches 2.0 × 10⁵ Pa, the chemical reaction would continue under a steady state condition until the whole pyrolysis is terminated, namely, all the volatile gas comes out from wood pieces and the weight loss of wood pieces is terminated.
4.3. Species Compositions
When the pressure reaches 2.0 × 10⁵ Pa, species compositions is obtained in Figure 6. The mole concentration averaged by a volume-weighted method is 1.10 × 10⁻² kgmol/m3 for H2, 1.68 × 10⁻² kgmol/m3 for CH4, 0.85 × 10⁻² kgmol/m3 for CO, 2.51 × 10⁻² kgmol/m3 for CO2, and 0.43 × 10⁻² kgmol/m3 for tar, respectively.
From the above data, for two moles of tar formation, 5.12 moles of H2, 7.82 moles of CH4, 3.96 moles of CO, 11.68 moles of CO2, are formed, respectively. These mole ratios are well compared with the coefficients of stoichiometric equation shown in Equation (5).
It can be noticed that this numerical analysis using Fluent reconstructs the decomposition of the volatile in a faithful manner according to the chemical reaction expressed by Equation (5).
5. Conclusions
A new pyrolysis system was developed being equipped with a pre-vacuum chamber, which was featured by a simple operation, low maintenance, and clean gas yield. Although the system is simple, pyrolysis processes undergone by large wood pieces in the pre-vacuum chamber are rather complicated.
Numerical analysis using ANSYS Fluent was hence carried out to understand the pyrolysis processes in the pre-vacuum chamber. An objective of this numerical analysis is not however to construct a complete theoretical model on entire wood pyrolysis processes, but to construct a numerical model including arbitrary manipulation components concerning volatile formation and chemical reaction kinetics so as to obtain numerical results as a function of time within acceptable deviation from the experimental results.
The numerical results can well explain the experimental data and provide the following conclusions:
1) The numerical analysis adopted two step reaction model, in which first reaction was formation of volatile gas and char from wood, and second reaction was decomposition of volatile gas into five species gases. This reaction model can be suitably applied to Fluent code.
2) The numerical analysis was merely carried out for the second reaction. Volume of volatile gas formed from wood was successfully adjusted so that the absolute pressure-time evolution calculated by Fluent agreed with the experimental results within the acceptable deviation.
3) Temperature drop observed in experiment was interpreted as fast decomposition with endothermic reaction.
4) Calculated gas yields well agreed with the stoichiometric equation, and almost all volatile gas was decomposed in the upper room of the pre-vacuum chamber. This was consistent with the experimental observation that no volatile gas was detected in gas yield by gas chromatography.
A further numerical work is necessary to understand the whole pyrolysis process of wood in the pre-vacuum chamber, because this numerical analysis was carried out only for the beginning period of the pyrolysis process, and another work is also necessary to construct a numerical model including volatile gas formation from large wood pieces and the reaction kinetics must be constructed on more theoretical basis as well as to confirm validity of the two-step primary reaction model adopted in the numerical analysis using Fluent code.
References
- 19th Conference of the parties in Warsaw Poland, United Nations Convection Framework on Climate Change. http://unfccc.int/meetings/warsaw_nov_ 2013/session/7767.php
- World Energy Outlook Database 2013, International Energy Agency. http://www.worldenergyoutlook.org/resources/
- Elliot, D.C. (2013) Objective of Task 34, IAE Bioenergy. http://www.ieabioenergy.com/task/pyrolysis-of-biomass/
- Homma, H., Homma, H., Yusrizal and Idris, M. (2013) Wood Pyrolysis in Pre-Vacuum Chamber. Journal of Sustainable Bioenery Systems, 3, 243-249. http://dx.doi.org/10.4236/jsbs.2013.34033
- Simmons, G.M. and Gentry, M. (1986) Particle Size Limitations Due to Heat Transfer in Determining Pyrolysis Kinetics of Biomass. Journal of Analytical and Applied Pyrolysis, 10, 117-127. http://dx.doi.org/10.1016/0165-2370(86)85011-2
- Saastamoined, J.J. (2006) Simplified Model for Aclcutation of Devolatilization in Fluidized Beds. Fuel, 85, 2385-2395.
- Babu, B.V. and Chaurasia, A.S. (2003) Modeling for Pyrolysis of Solid Particle: Kinetics and Heat Transfer Effects. Energy Conversion and Management, 44, 2251-2275. http://dx.doi.org/10.1016/S0196-8904(02)00252-2
- Papadikis, K., Gu, S. and Bridgwater, A.V. (2010) Computational Modelling of the Impact of Particle Size to the Heat Transfer Coefficient between Biomass Particles and a Fluidized Bed. Fuel Processing Technology, 91, 68-79. http://dx.doi.org/10.1016/j.fuproc.2009.08.016
- Anca-Couce, A. and Zobel, N. (2012) Numerical Analysis of a Biomass Pyrolysis Particle Model: Solution Method Optimized for the Coupling to Reactor Models. Fuel, 97, 80-88. http://dx.doi.org/10.1016/j.fuel.2012.02.033
- Wagenaar, B.M., Prins, W. and Swaaij, W.P.M. (1993) Flash Pyrolysis Kinetics of PINE Wood. Fuel Processing Technology, 36, 291-298. http://dx.doi.org/10.1016/0378-3820(93)90039-7
- Chan, W.R., Kelbon, M. and Krieger, B.B. (1985) Modelling and Experimental Verification of Physical and Chemical Processes during Pyrolysis of a Large Biomass Particle. Fuel, 64, 1505-1513.http://dx.doi.org/10.1016/0016-2361(85)90364-3
- Papadikis, K., Gu, S., Bridgwater, A.V. and Gerhauser, H. (2009) Application of CFD to Model Fast Pyrolysis of Biomass. Fuel Processing Technology, 90, 504-512. http://dx.doi.org/10.1016/j.fuproc.2009.01.010
- Papadikis, K., Gu, S. and Bridgwater, A.V. (2009) CFD Modelling of the Fast Pyrolysis of Biomass in Fluidised Bed Reactors, Part B: Heat, Momentum and Mass Transport in Bubbling Fluidised Beds. Chemical Engineering Science, 64, 1036-1045. http://dx.doi.org/10.1016/j.ces.2008.11.007
- Papadikis, K., Gu, S. and Bridgwater, A.V. (2010) A CFD Approach on the Effect of Particle Size on Char Entrainment Inn Bubbling Fluidised Bed Reactors. Biomass and Bioenery, 34, 21-29.http://dx.doi.org/10.1016/j.biombioe.2009.09.007
- Wang, Y. and Yan, L. (2008) CFD Studies on Biomass Thermochemical Conversion. International Journal of Molecular Sciences, 9, 1108-1130. http://dx.doi.org/10.3390/ijms9061108
- Sinha, S., Jhalani, A., Ravi, M.R. and Ray, A. (2000) Modelling of Pyrolysis in Wood and Sawdust: A Review. Journal of Solar Energy Society of India, 10, 41-62.
- Prakash, N. and Karunanithi, T. (2009) Advances in Modeling and Simulation of Biomass Pyrolysis. Asian Journal of Science Research, 2, 1-27.
- Di Blasi, C. (2008) Modelling Chemical and Physical Processes of Wood and Biomass Pyrolysis. Progress in Energy and Combustion Science, 34, 47-90. http://dx.doi.org/10.1016/j.pecs.2006.12.001
- Saliba, E.O.S., Rodriguez, M.M., Pilo-Veloso, D. and Morais, S.A.L. (2002) Chemical Characterization of the Lignins of Corn and Soybean Agriculture Residues. Arquivo Brasileiro de Modicina Veterinaria e Zootecnia, 54, 42-51.
- Alhasan, A.M., Kuang, D., Mohammad, A.B. and Sharma-Shivappa, R.T. (2010) Combined Effect of Nitric Acid and Sodium Hydroxide Pretreatment on Enzymatic Saccharification of Rubber Wood (Heavea brasiliensis). International Journal of Chemical Technology, 2, 12-20.
- Engel, P., Hein, L. and Spiess, A.C. (2012) Derivatization-Free Gel Permeation Chromatography Elucidates Enzymatic Hydrolysis. Biotechnology for Biofules, 5, 77.
- Reyes, P., Mendonca, R.T., Rodriguez, J., Fardim, P. and Vega, B. (2013) Characterization of the Hemicellulosic Fraction Obtained after Pre-Hydrolysis of Penus Radiate Wood Chips with Hot-Water at Different Initial pH. Journal of the Chilean Chemical Society, 58, 1614-1618.
- Guerra, A., Gaspar, A.R., Contreras, S., Lucia, L.A., Crestini, C. and Argyropoulos, D.S. (2007) On the Propensity of Lignin to Associate: A Size Exclusion Chromatography Study with Lignin Derivatives Isolated from Different Plant Species. Phytochemistry, 68, 2570-2583. http://dx.doi.org/10.1016/j.phytochem.2007.05.026
- Guerra, A., Filpponen, I., Lucia, L.A. and Saquing, C. (2006) Toward a Better Understanding of the Lignin Isolation Process from Wood. Journal of Agriculture and Food Chemistry, 54, 5939-5947. http://dx.doi.org/10.1021/jf060722v
- Jin, W., Singh, K. and Zondlo, J. (2013) Pyrolysis Kinetics of Physical Components of Wood and Wood Polymers Using Isoconversion Method. Agriculture, 3, 12-32. http://dx.doi.org/10.3390/agriculture3010012
- Hernelind, M. and Gevert, B. (2002) Hydrotreatment of Tar Formed in Gasification of Biomass. American Chemical Society, 47, 171-172.
- Lv, G. Wu, S. and Lou, R. (2010) Characteristics of Corn Stalk Hemicellulose Pyrolysis in a Tubular Reactor. BioResources, 5, 2051-2062.
- Lopez, F.A., Rodriguez, O., Urien, A., Lobato, B., Centeno, T.A. and Alguacil, F.J. (2013) Physico-Chemical Characteristics of the Products Derived from the Thermolysis of Waste Abies Alba Mill Wood. Journal of Environmental Protection, 4, 26-30.
- Milne, T.A., Evans, R.J. and Abatzoglou, N. (1998) Biomass Gasifier “Tars”: Their Nature, Formation, and Conversion. NREL/TP 570-25357, 1-68.
- Park, W.C. (2008) A Study of Pyrolysis of Charring Material and Its Application for Fire Safety and Biomass Utilization. Ph.D. Thesis, The University of Michigan, Ann Arbor, 90-106.
- Park, W.C., Atreya, A. and Baum, H.R. (2010) Experimental and Theoretical Investigation of Heat and Mass Transfer Processes during Wood Pyrolysis. Combustion and Flame, 157, 481-494.http://dx.doi.org/10.1016/j.combustflame.2009.10.006
- Haseli, Y., van Oijen, J.A. and de Goey, L.P.H. (2011) Modeling Biomass Particle Pyrolysis with Temperature-Dependent Heat of Reactions. Journal of Analytical and Applied Pyrolysis, 90, 140-154.http://dx.doi.org/10.1016/j.jaap.2010.11.006
NOTES

*Corresponding author.