American Journal of Analytical Chemistry
Vol.5 No.3(2014), Article ID:42926,8 pages DOI:10.4236/ajac.2014.53018
Simple and Rapid Spectrophotometric Determination of Titanium on Etched Aluminum Foils
1Electronic Materials Research Laboratory, Key Laboratory of the Ministry of Education & International Center of Dielectric Research, Xi’an Jiaotong University, Xi’an, China
2Zhaoqing Hua Feng Electronic Aluminum Foil Co., Ltd., Zhaoqing, China
Email: *ylxu@mail.xjtu.edu.cn
Copyright © 2014 Xianfeng Du et al. This is an open access article distributed under the Creative Commons Attribution License, which permits unrestricted use, distribution, and reproduction in any medium, provided the original work is properly cited. In accordance of the Creative Commons Attribution License all Copyrights © 2014 are reserved for SCIRP and the owner of the intellectual property Xianfeng Du et al. All Copyright © 2014 are guarded by law and by SCIRP as a guardian.
Received January 9, 2014; revised February 5, 2014; accepted February 10, 2014
KEYWORDS
Titanium Oxide; Spectrophotometry; Hydrogen Peroxide; Etched Aluminum Foil
ABSTRACT
Introduction of titanium oxides with high permittivity on etched aluminum foils’ surface has been successfully utilized to increase specific capacitance of anode foils for aluminum electrolytic capacitors. In order to quantify the concentration of titanium (IV) on the etched aluminum foil precisely, a simple and rapid spectrophotometric procedure has been developed. After optimizing a series of variables including absorbance wavelength, concentration of nitric acid, concentration of hydrogen peroxide, nitration time and developing time, analytical precision and accuracy were tested by using standard working solution containing known amount of titanium (IV). The results showed that Lambert-Beer’s law was obeyed in the range of 0.01 to 3.00 mmol·L−1. The relative standard deviation (RSD) ranged from 0.67% to 1.09% (n = 6), and the recovery was between 99.17% - 100.03%. Investigation on effect of Al3+ ion indicated that there was no interference in the absorbance of titanium (IV) at 410 nm. The proposed procedure was applied to real samples for the determination of titanium (IV), and the results were in a good agreement with the values certified by inductively coupled plasma-atomic emission spectrometry (ICP-AES).
1. Introduction
The rapid development in electronic science and technology has been resulting in the trend of electronic devices towards miniaturization, multi-functionalization and portability. As an essential component extensively used in electric circuit for filter, smoother and power supply, aluminum electrolytic capacitor is strongly required to scale down its size and light its weight. The key to meeting these requirements is to increase specific capacitance of the aluminum anode foils. The routine process adopted widely is to increase specific surface area of aluminum foil by etching. Recent researches show that it is another promising approach to boosting the specific capacitance further via introducing titanium oxides into dielectric layer of aluminum electrolytic capacitor after etching the foil [1-11]. It is proposed that the increase in specific capacitance directly depends on the concentration of titanium (Ti) (IV) in dielectric layer because titanium oxides have much higher permittivity than that of alumina. A more or less amount of Ti (IV) will result in the decline of specific capacitance. In order to determine the concentration of titanium (IV) on the etched aluminum foil precisely, therefore, it is essential to develop a simple and practical analysis of trace amounts of Ti to evaluate its dielectric role.
Various analytical techniques, including neutron activation analysis (NAA) [12], graphite furnace atomic absorption spectrometry (GFAAS) [13], inductively coupled plasma-atomic emission spectrometry (ICP-AES) [14], inductively coupled plasma-mass spectrometry (ICP-MS) [15], X-ray fluorescence (XRF) [16], catalytic adsorptive stripping voltammetry (CASV) [17] and
spectrophotometry [18-23], were used for the determination of Ti (IV) in different types of matrices. Although NAA, GFAAS, ICP-AES, ICP-MS and XRF can determine simultaneously major & trace elements and the combination is considered to have several advantages over the separate technique, spectrophotometry continues to offer the best alternative for routine analysis of Ti (IV) in the absence of these expensive instruments, due to its common availability, simple procedure, high accuracy and low cost effectiveness.
During the spectrophotometric determination of Ti (IV), a number of organic chromogenic reagents, such as o-carboxyphenylfluorone [19], ponceau S [18], diantipyrylmethane [20], resacetophenone p-hydroxybenzoylhydrazone [24], thiocyanate [25], 2,3-dihydroxynaphthalene [26], 3,5,7,2’,4’-penta hydroxy flavone [27], 5-(2’, 4’-dimethylphenylazo)-6-hydroxypyrimidine-2,4-dione [28], bromopyrogallol red [29] and o-chlorophenylfluorone [30], have been used to produce an intense color for absorbance measurement. Most of these reagents are expensive, harder-to-obtain and environmental-unfriendly. Compared with these organic reagents, hydrogen peroxide (H2O2) is a good alternative and widely applied in spectrophotometric determination of Ti (IV), owing to its nontoxicity, low-cost and extremely sensitivity [31-35]. Despite the already abundant literatures describing H2O2 procedure, there are relatively few reports, to the best of my knowledge, on determination of Ti (IV) on the surface of etched aluminum foils.
Therefore, the objectives of this work are to develop a simple and rapid ultrasonic-assisted digestion procedure suitable for Ti (IV) with analysis by spectrophotometry and to validate the applicability of this method as an alternative for the measurement of Ti (IV) on etched aluminum foil. The results showed that this method had been successfully applied in determination of Ti (IV) in real samples.
2. Experimental
2.1. Apparatus
A UV-3300S UV-Vis spectrophotometer (Shanghai Mapada Co. China) connected to a computer was used for all spectral measurements in the wavelength range of 350 - 550 nm using 1 cm matched stoppered quartz cells. The instrument was optimized daily before measurement and operated as recommended by the manufacturers. The optimized parameters included scan speed of 5 nm∙s−1, slit width of 2 nm, and Δλ = 1 nm for first-order derivative mode. A model JY-ULTIMA inductively coupled plasma-atomic emission spectrometry (ICP-AES) (JYHORIBA Co. France) was employed to determine concentration of Ti (IV) in real samples for the comparison with the result from our approach. The ultrasonic-assisted digestion was carried out in a KQ-300B ultrasonic cleaner (Kunshan Ultrasonic Instruments Co., Ltd., China). The water used in this work was prepared by MilliQ-Reference water system (Millipore Co. Bedford, MA).
2.2. Reagents and Solutions
All chemicals used were of analytical grade and purchased from Sinopharm chemical reagents Co. Ltd., China. All the solutions were made up by Milli-Q-Reference-purified water (ρ > 15 MΩ∙m). Stock solution of nitric acid (HNO3) with the concentration of 7.5 mol∙L−1 was prepared daily by dilution of 70% nitric acid with water. Stock solution of H2O2 containing 1.0 mol∙L−1 was made freshly right before use by dilution of 30% hydrogen peroxide with water. The standard stock solution of titanium with 20 mmol∙L−1 was prepared daily by dissolving 0.6903 g titanium (IV) n-butoxide in 5 mL of 7.5 mol∙L−1 HNO3 and diluting to 100 ml with water in a volumetric flask.
2.3. Procedure
The standard working titanium (IV) solutions with different concentration (0.01, 0.02, 0.10, 0.20, 1.00, 2.00, 2.50, 3.00, 3.60 mmol∙L−1) were prepared daily as fellows: First, the required amount of standard stock titanium (IV) solution was mixed with a certain volume of stock HNO3 solution and nitrified at 60˚C for some time. The resulting solution was then cooled down to room temperature followed by adding a given volume of stock H2O2 solution. After that, the above solution was diluted to 100 mL with water in a volumetric flask and developed at room temperature for some time. The samples containing Al3+ were made by adding aluminum nitrate (Al(NO3)3) into standard working titanium (IV) solution. Blank sample was prepared by repeating the above procedure without standard stock titanium (IV) solution. The absorbance between 350 - 550 nm was measured against the blank sample.
2.4. Preparation of Real Samples
Aluminum foils coated with titanium oxides were prepared as reference [2]. The only difference was titanium dioxide instead of barium titanate. The obtained aluminum foil with the geometric area of 4 cm2 was cut into pieces and then digested in stock HNO3 solution at 60˚C in ultrasonic cleaner until all aluminum was dissolved. The digested solution was cooled down to room temperature and added with stock solution of H2O2. Afterwards, the obtained solution was diluted to 25 mL with water in a volumetric flask and developed for some time. Then the spectrophotometric measurement given above was applied.
3. Results and Discussion
3.1. Optimization of Absorbance Wavelength
In order to study the optimal absorbance wavelength, a series of standard working solutions of titanium (IV) containing 0.02, 0.10, 0.20, 1.00, 2.00, 3.00 mmol∙L−1 Ti (IV), prepared in section 2.3, were measured for the absorbance spectra in the wavelength range of 350 - 550 nm, respectively. The obtained results were plotted in Figure 1. The maximum absorbance wavelength of each spectrum was also shown in Figure 2. From Figure 2, it was clear that the maximum absorbance of most samples occurred at 410 nm which was consistent with the reports of El-Sheikh [23] and Bassan [36]. The linear regression coefficients (r2) of the calibration graphs gained at 410 nm was 0.9999. Furthermore, there was hardly any absorbance at 410 nm in spectra of nitric acid or hydrogen peroxide (see Figure 3). Therefore, 410 nm could be used as optimal absorbance wavelength.
3.2. Effect of Concentration of Nitric Acid
The concentration of nitric acid is a very important factor for digestion of real samples containing titanium (IV) on the surface of etched aluminum foils in the present work. Therefore, the effect of concentration of nitric acid on the absorbance of standard working solution of titanium (IV) was investigated in the range of 0.047 - 3.75 mol∙L−1. Varying the concentration of nitric acid gave the results depicted in Figure 4. The absorbance at 410 nm was observed to be maximum and almost constant in the range of 1.125 to 3.75 mol∙L−1. Consider that aluminum would consume nitric acid during digestion via chemical reaction with HNO3, the concentration of 3.75 mol∙L−1 was recommended for the determination of Ti (IV).
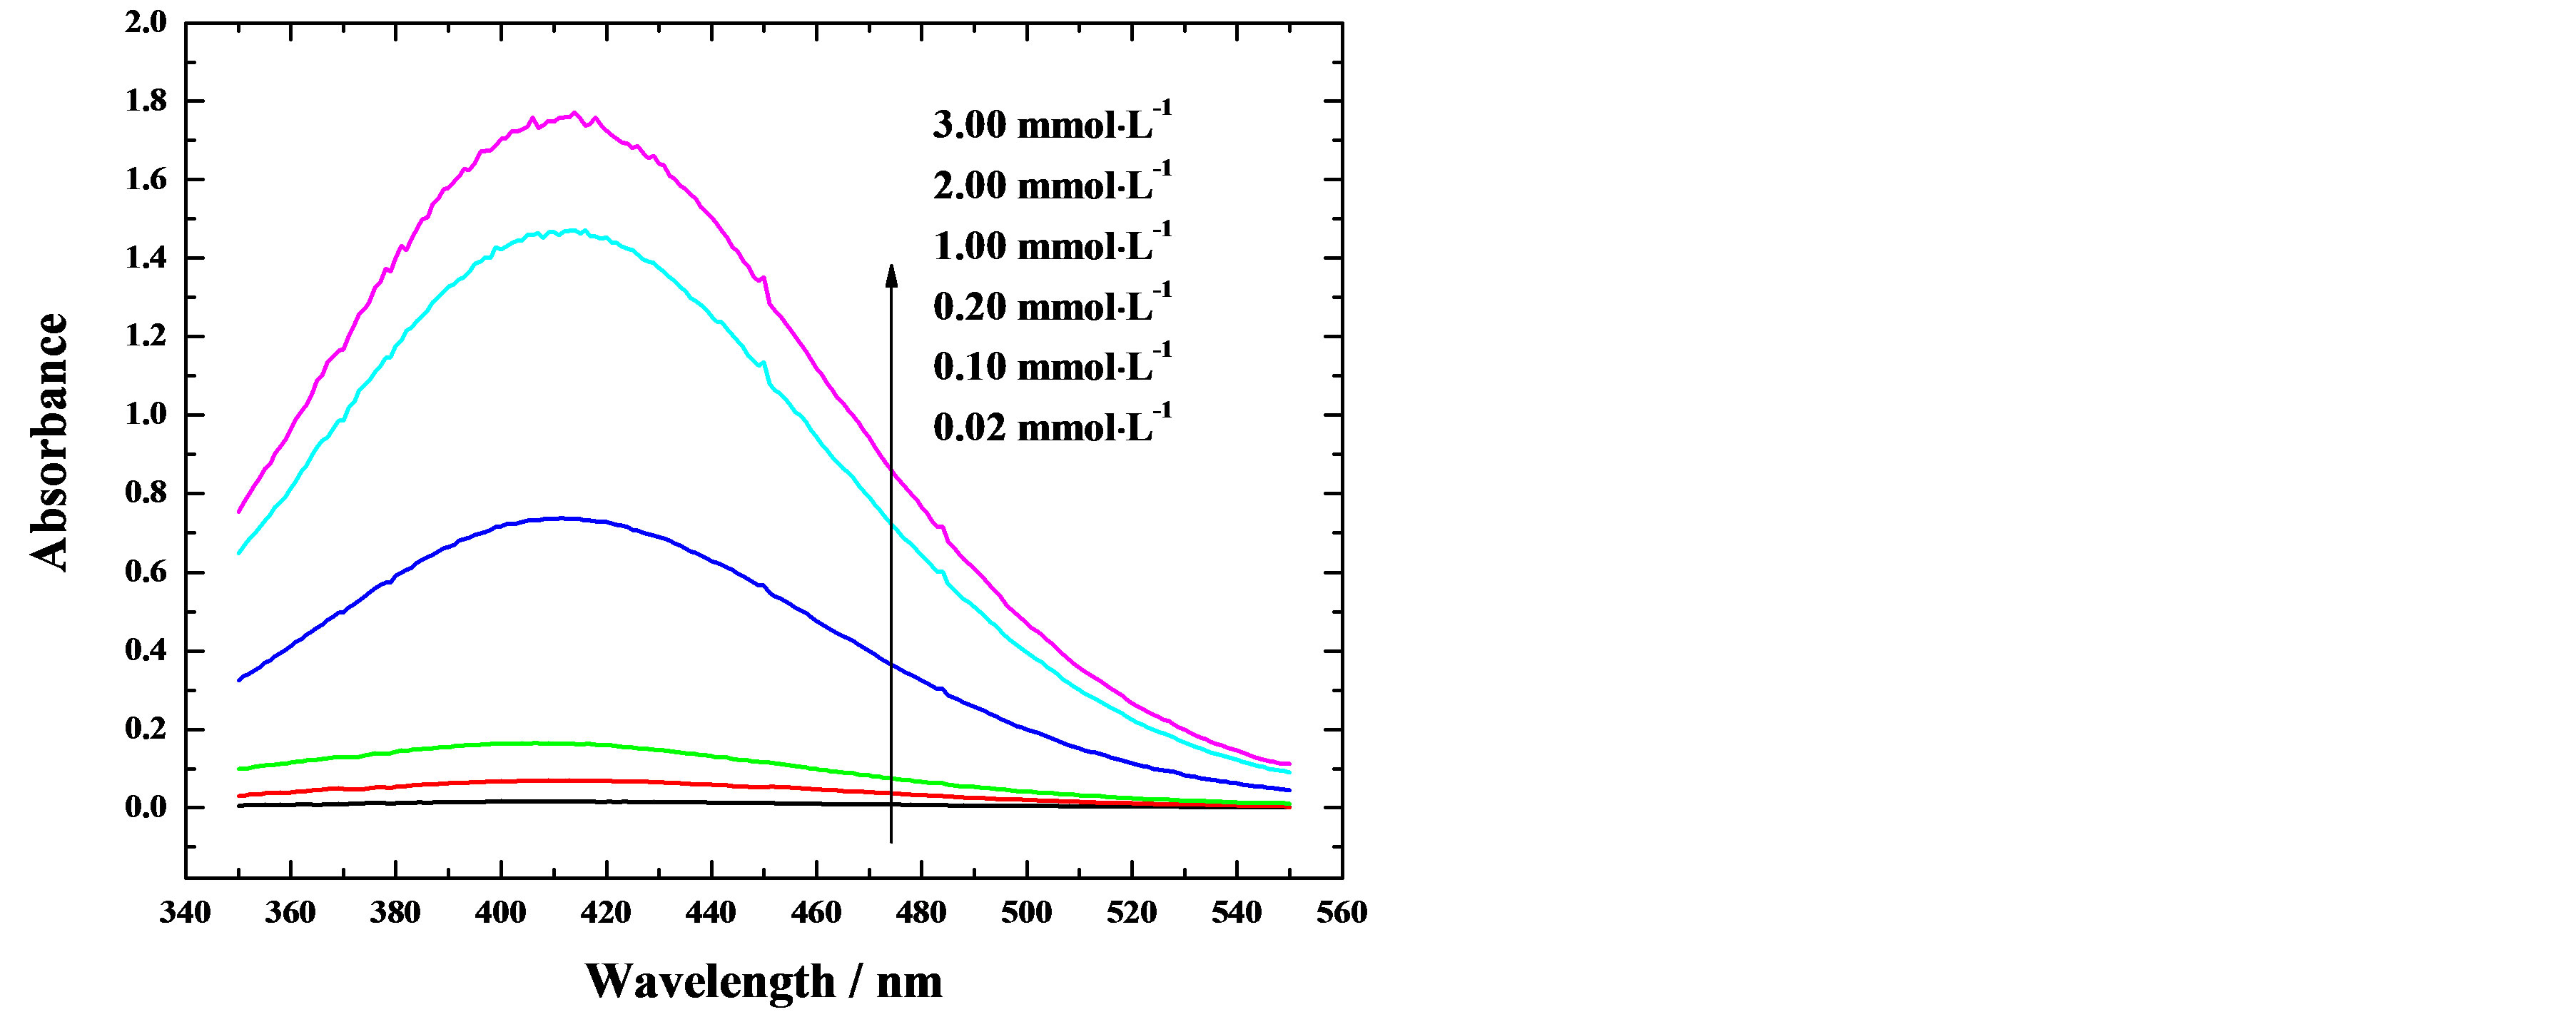
Figure 1. Effect of concentration of Ti (IV) on absorbance spectra: concentration increased from bottom (0.02 mmol∙ L−1) to top (3.00 mmol∙L−1) (each solution containing 3.75 mol∙L−1 HNO3, 200 mmol∙L−1 H2O2, nitrified for 20 min, developed for 10 min).
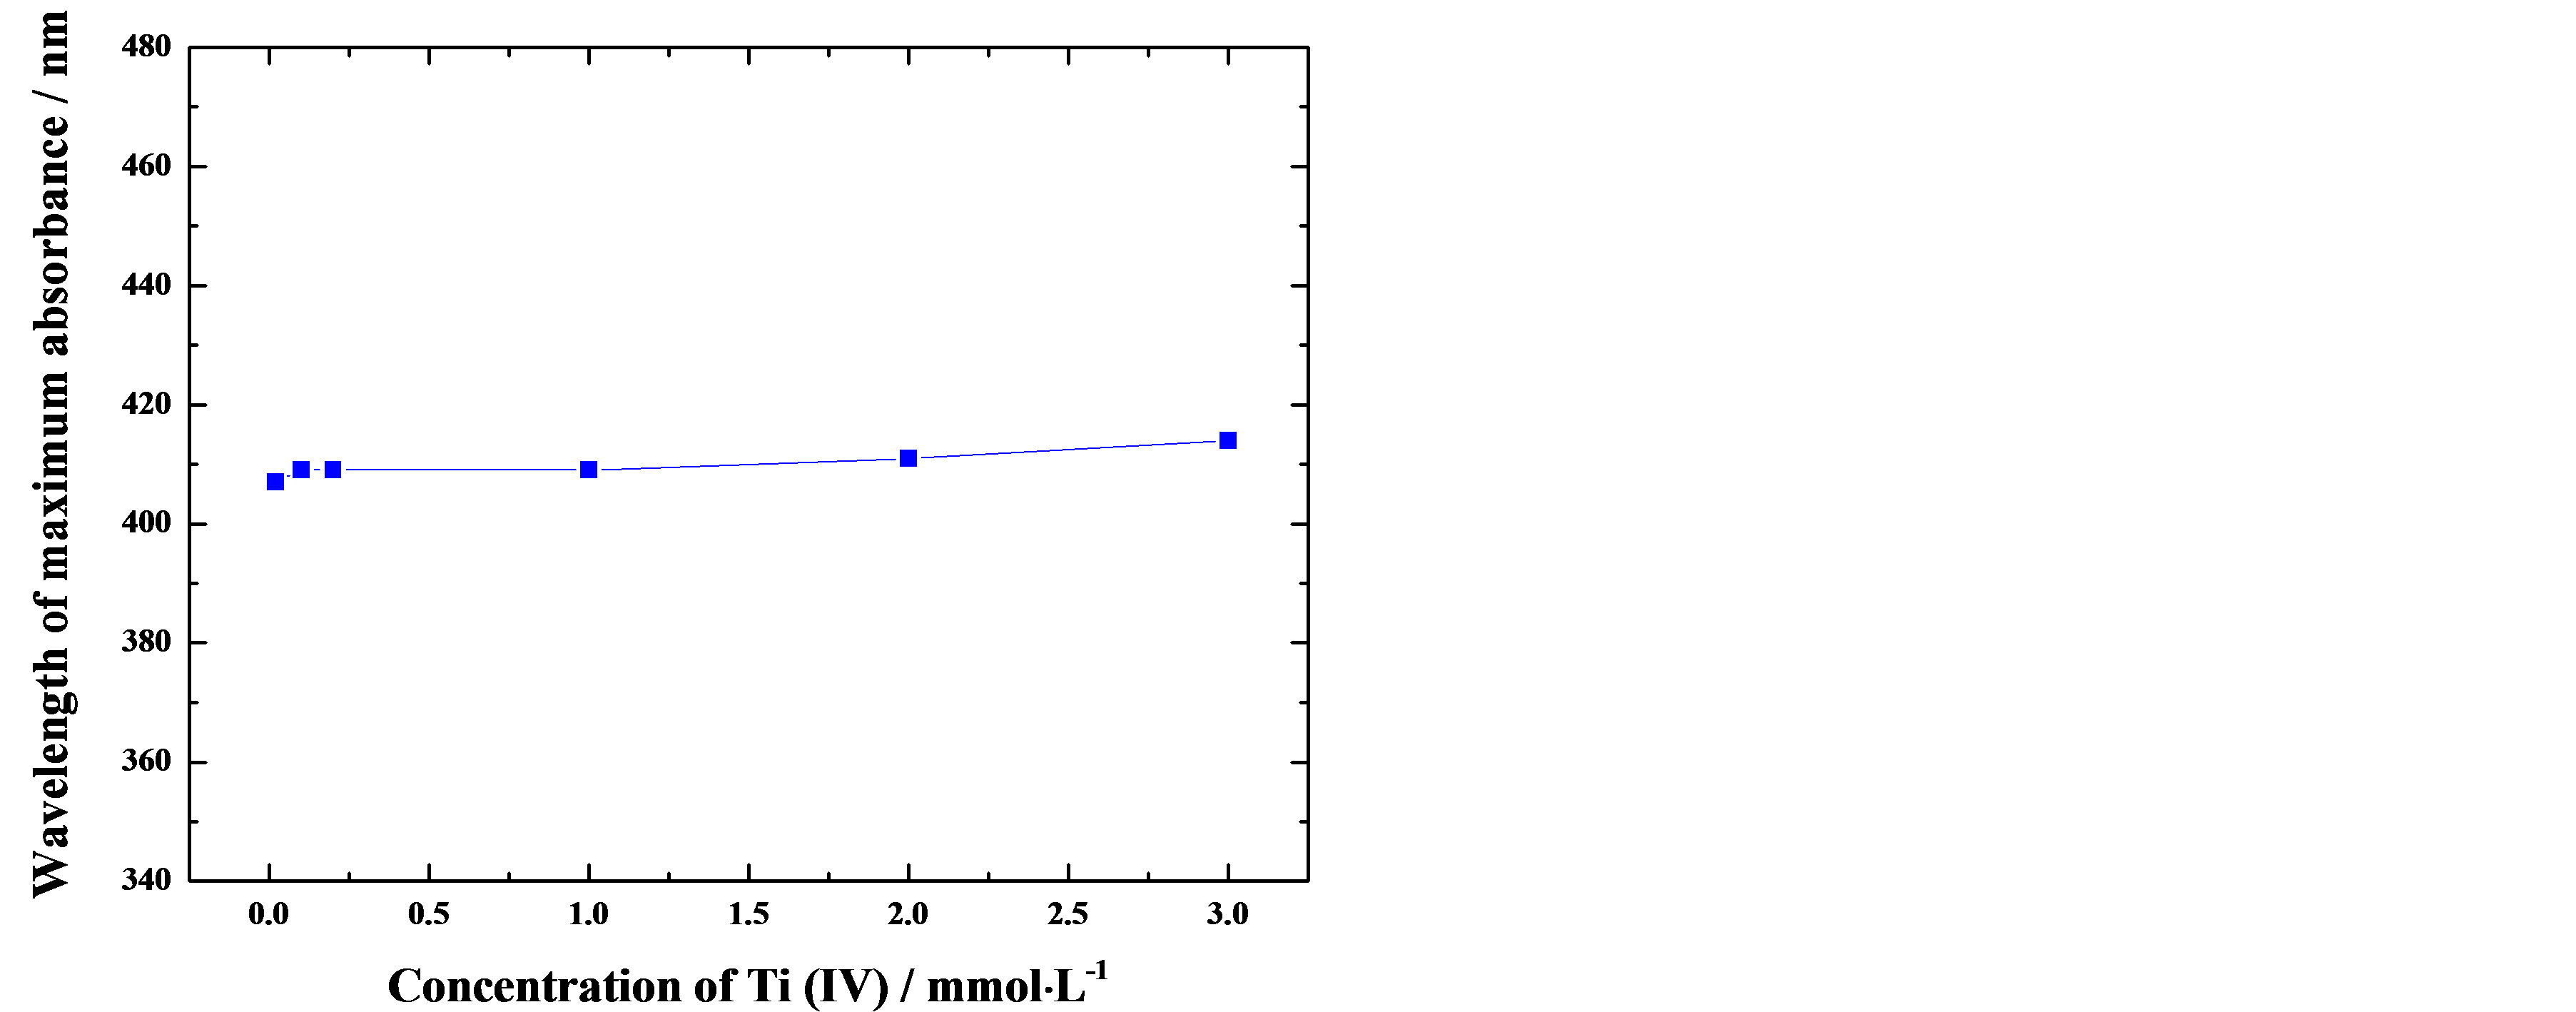
Figure 2. Effect of concentration of Ti (IV) on the wavelength of maximum absorbance (each solution containing 3.75 mol∙L−1 HNO3, 200 mmol∙L−1 H2O2, nitrified for 20 min, developed for 10 min).
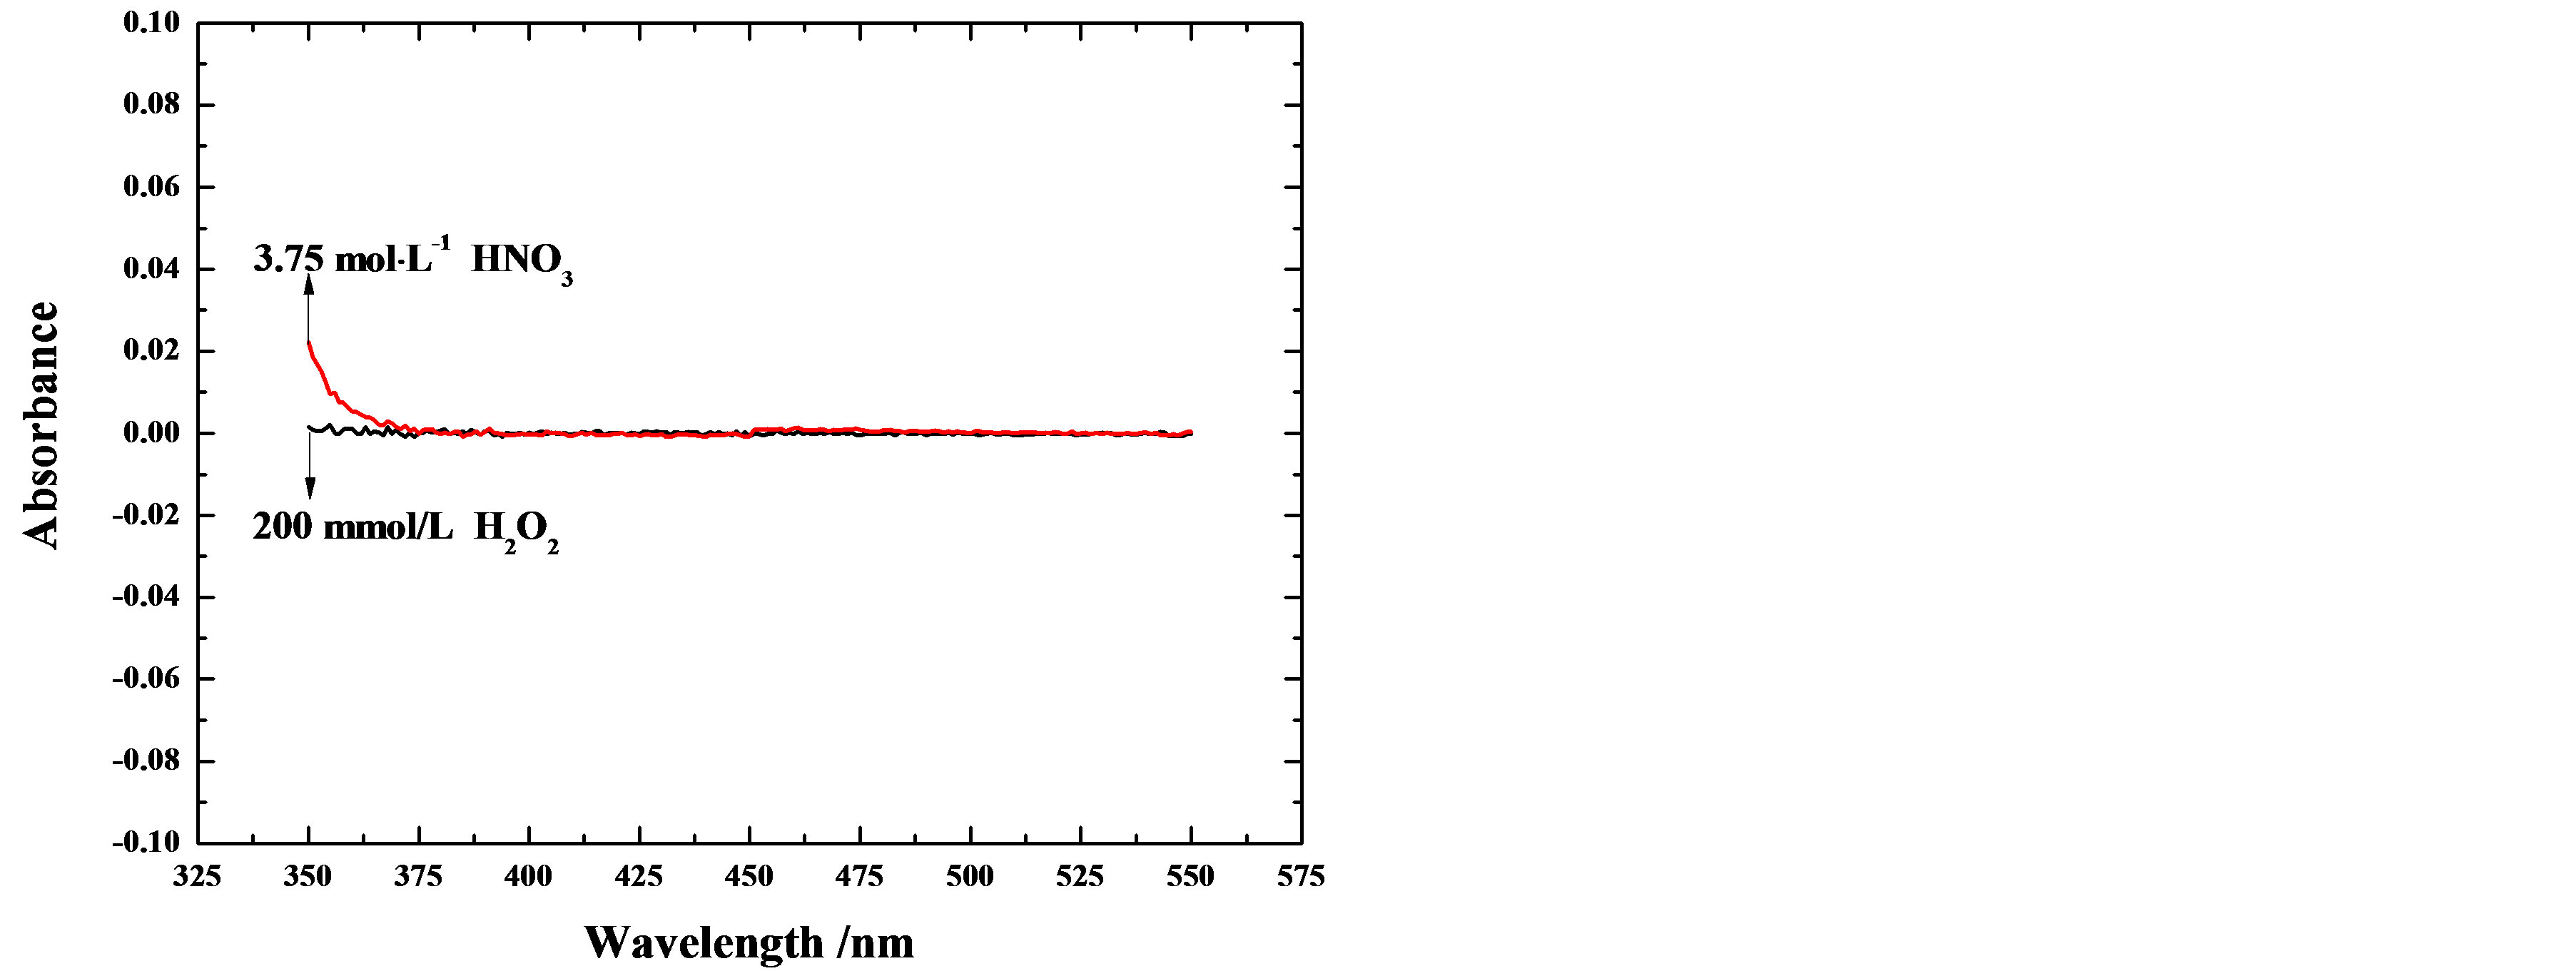
Figure 3. Absorbance spectra of 3.75 mol∙L−1 HNO3 and 200 mmol∙L−1 H2O2.

Figure 4. Effect of concentration of nitric acid on the absorbance at 410 nm (each solution containing 2.5 mmol∙L−1 Ti (IV), 200 mmol∙L−1 H2O2, nitrified for 20 min, developed for 10 min).
3.3. Effect of Concentration of Hydrogen Peroxide
Chromogenic reagent of hydrogen peroxide was used to produce an intense color for absorbance measurement here. Hence, it was necessary to study the effect of concentration of H2O2 on the absorbance of each standard working solution. Varying amount of stock solution of hydrogen peroxide was added to standard working solution with a fixed Ti (IV) concentration of 2.5 mmol∙L−1 and the absorbance was measured according to the standard procedure. The results were given in Figure 5.
The effect of concentration of H2O2 was found to be ignorable when the concentration of H2O2 exceeded 25 mmol∙L−1. It was noticed that these colored species were stable and their absorbance remained constant at least 24 h at room temperature. Thus, in the light of these results, for all subsequent works, H2O2 concentration 200 mmol∙L−1 was adopted as optimum for the determination of Ti (IV).
3.4. Effect of Nitration Time
A series of 2.5 mmol∙L−1 standard working Ti (IV) solutions containing 3.75 mol∙L−1 HNO3 were used to test the effect of nitration time varied between 10 and 45 min on the absorbance at 410 nm. The obtained results were graphed in Figure 6. It was clear that the maximum absorbance was gained when nitration time reached 20 min. Shorter time gave lower absorbance while longer time did not improve obviously the absorbance. Consequently, 20 min was selected as nitration time for the subsequent experiments.
3.5. Effect of Developing Time
In order to react fully with Ti (IV) and form more colored complexes that were the base of quantitative determination of Ti (IV), the standard working solution usually developed for some time after adding hydrogen peroxide. The effects of developing time on the absorbance at 410 nm were studied. Figure 7 showed absorbance changes with developing time. It was shown that the absorbance at 410 nm reached maximum after developing 5 min, then it changed little. Therefore, to make sure H2O2 thoroughly reacted with Ti (IV), under optimized conditions, 10 min was adopted for all further work.
3.6. Effect of Al3+ Ion
The problematic effects from foreign ions at high levels were known as “matrix effect” in the spectrophotometric determination of Ti (IV) [37,38]. Therefore, in consideration of real sample containing abundant Al3+, the effect of Al3+ ion on the spectrophotometric determination of Ti
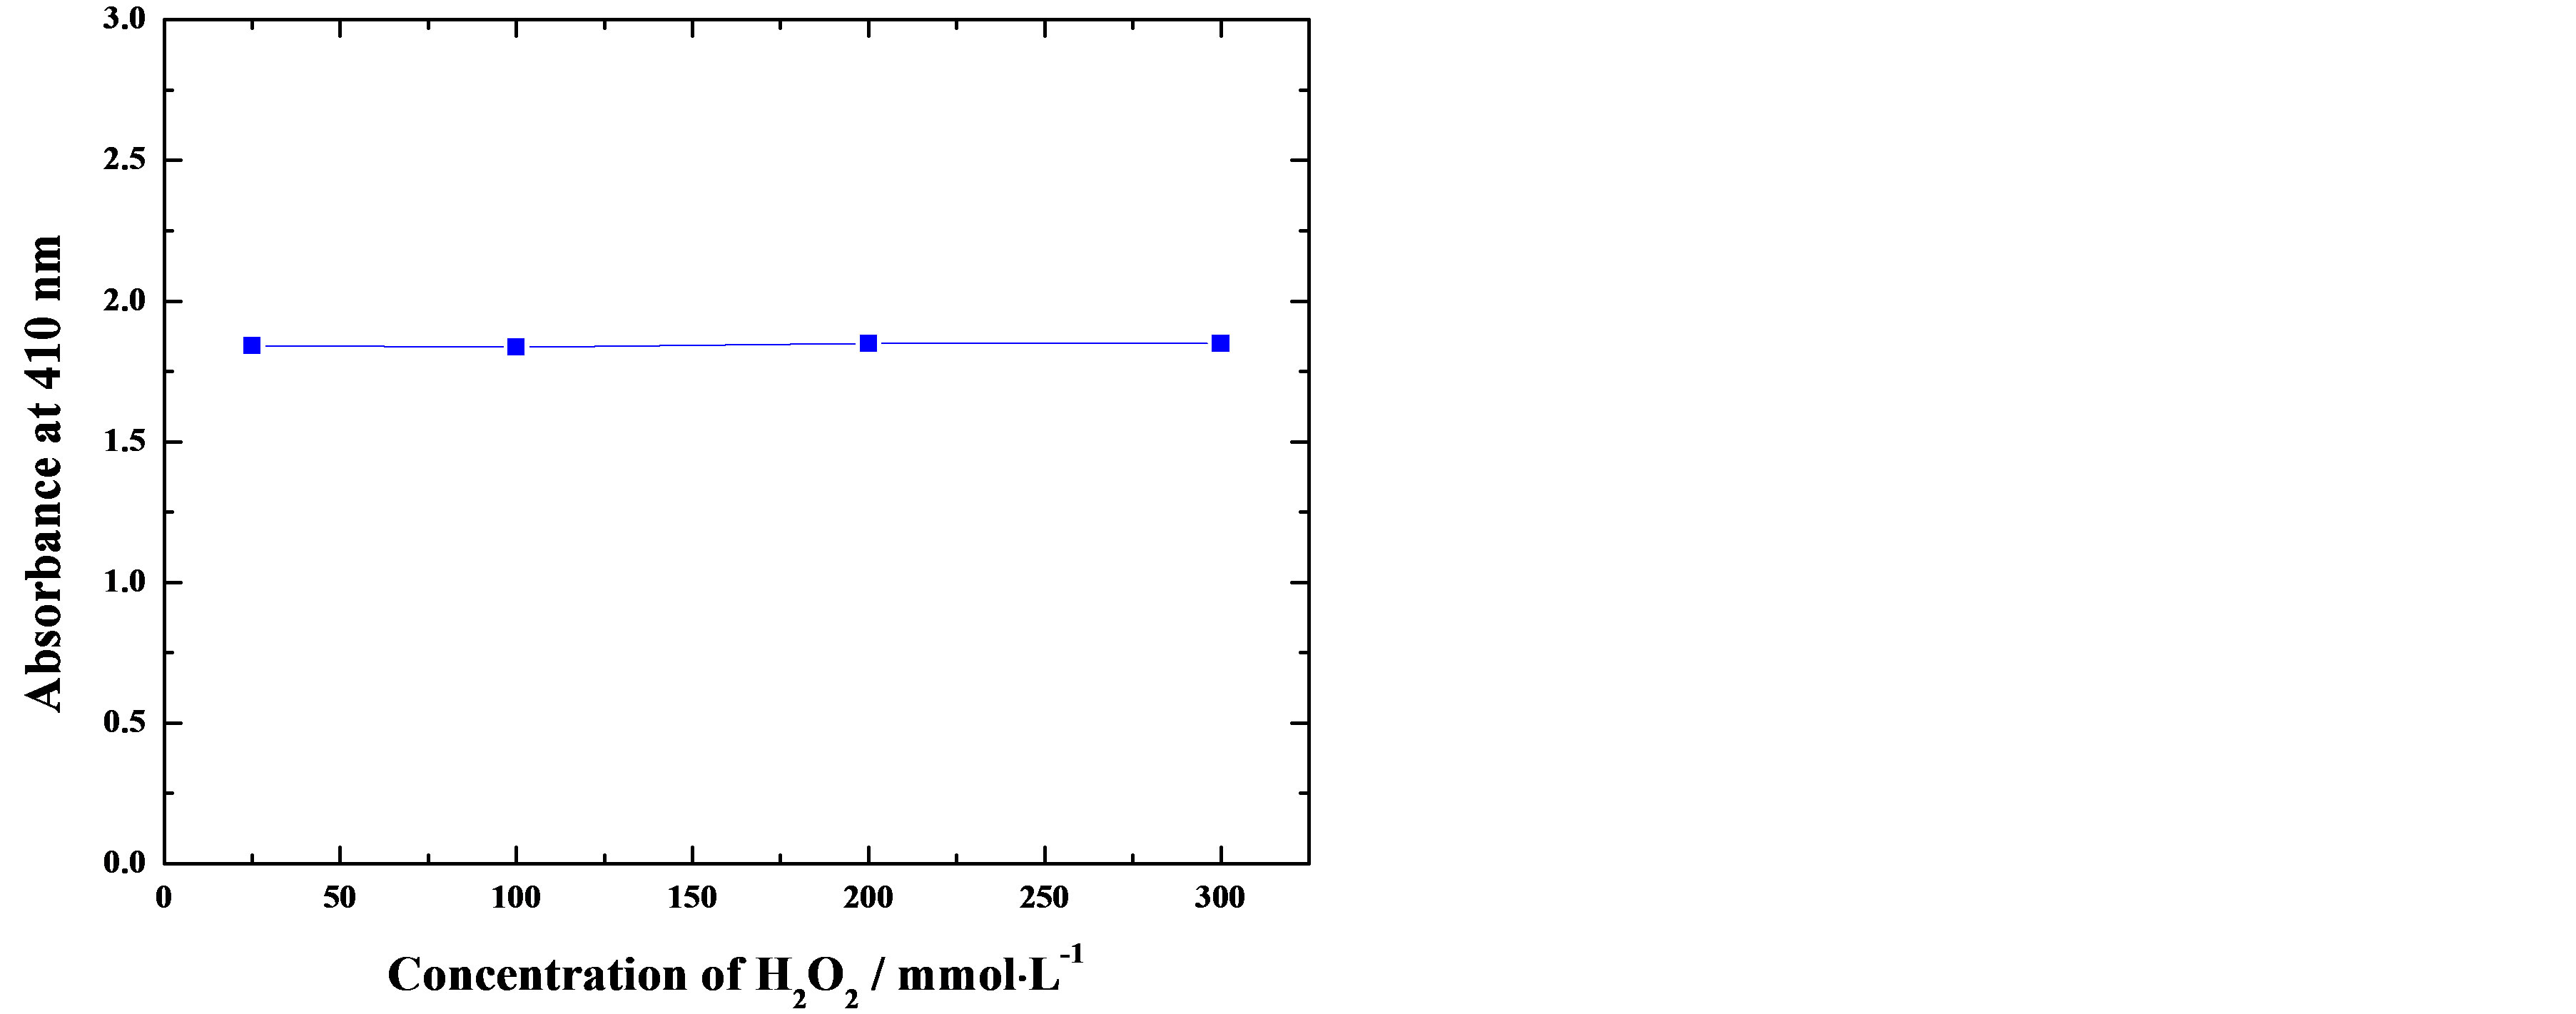
Figure 5. Effect of concentration of hydrogen peroxide on the absorbance at 410 nm (each solution containing 2.5 mmol∙L−1 Ti (IV), 3.75 mol∙L−1 HNO3, nitrified for 20 min, developed for 10 min).
Figure 6. Effect of nitration time on the absorbance at 410 nm (each solution containing 2.5 mmol∙L−1 Ti (IV), 3.75 mol∙L−1 HNO3, 200 mmol∙L−1 H2O2, developed for 10 min).
Figure 7. Effect of developing time on the absorbance at 410 nm (each solution containing 2.5 mmol∙L−1 Ti (IV), 3.75 mol∙L−1 HNO3, 200 mmol∙L−1 H2O2, nitrified for 20 min).
(IV) was studied and the results were shown in Figure 8. It was observed that even 300 mmol∙L−1 Al3+ did not interfere in the absorbance of Ti (IV) at 410 nm, which was in accord with the results of Varghese [24], Mondal [26], and Aydin [39].
3.7. Linearity and Limit of Detection
Under the optimum conditions described above, Lambert-Beer’s law was obeyed in the range of 0.01 to 3.00 mmol∙L−1. The calibration curve was linear within this range as shown in Figure 9. The inset showed the results of calculation using least square method. The calibration curve had a slop of 0.74935 (±0.00316) and a y-intercept of −0.00371 (±0.00486). The correlation coefficient r2 was 0.99996.
Figure 8. Effect of concentration of Al3+ on the absorbance at 410 nm (each solution containing 2.5 mmol∙L−1 Ti (IV), 3.75 mol∙L−1 HNO3, 200 mmol∙L−1 H2O2, nitrified for 20 min, and developed for 10 min).
Figure 9. Relationships between concentration of Ti (IV) and the absorbance at 410 nm (each solution containing 3.75 mol∙L−1 HNO3, 200 mmol∙L−1 H2O2, nitrified for 20 min, and developed for 10 min).
The limit of detection, defined as CL= 3 SB/m [25,40], where CL, SB, and m are the limit of detection, standard deviation of the blank (n = 15), and the slope of the calibration curve, respectively, was 0.002814 mmol∙L−1.
3.8. Analytical Precision and Accuracy
The precision and accuracy of the determination of Ti (IV) were verified by analyzing samples containing different concentration of titanium under optimized conditions. Each determination was carried out 6 times. The results were presented in Table 1, in which it was evident that the analytical performance was very well. The relative standard deviation ranged from 0.67% to 1.09% (n = 6) and the recovery was in the range of 99.17% - 100.03%, which indicated that the proposed method could be effectively used to quantitatively determine titanium.
3.9. Analysis of Real Samples
The validation and applicability of the present procedure was confirmed by determination of titanium (IV) in real samples. Analytical results of these samples were listed in Table 2. The results found were in good agreement with the values certified by ICP-AES.
4. Conclusion
A simple, fast and economic procedure for spectropho-
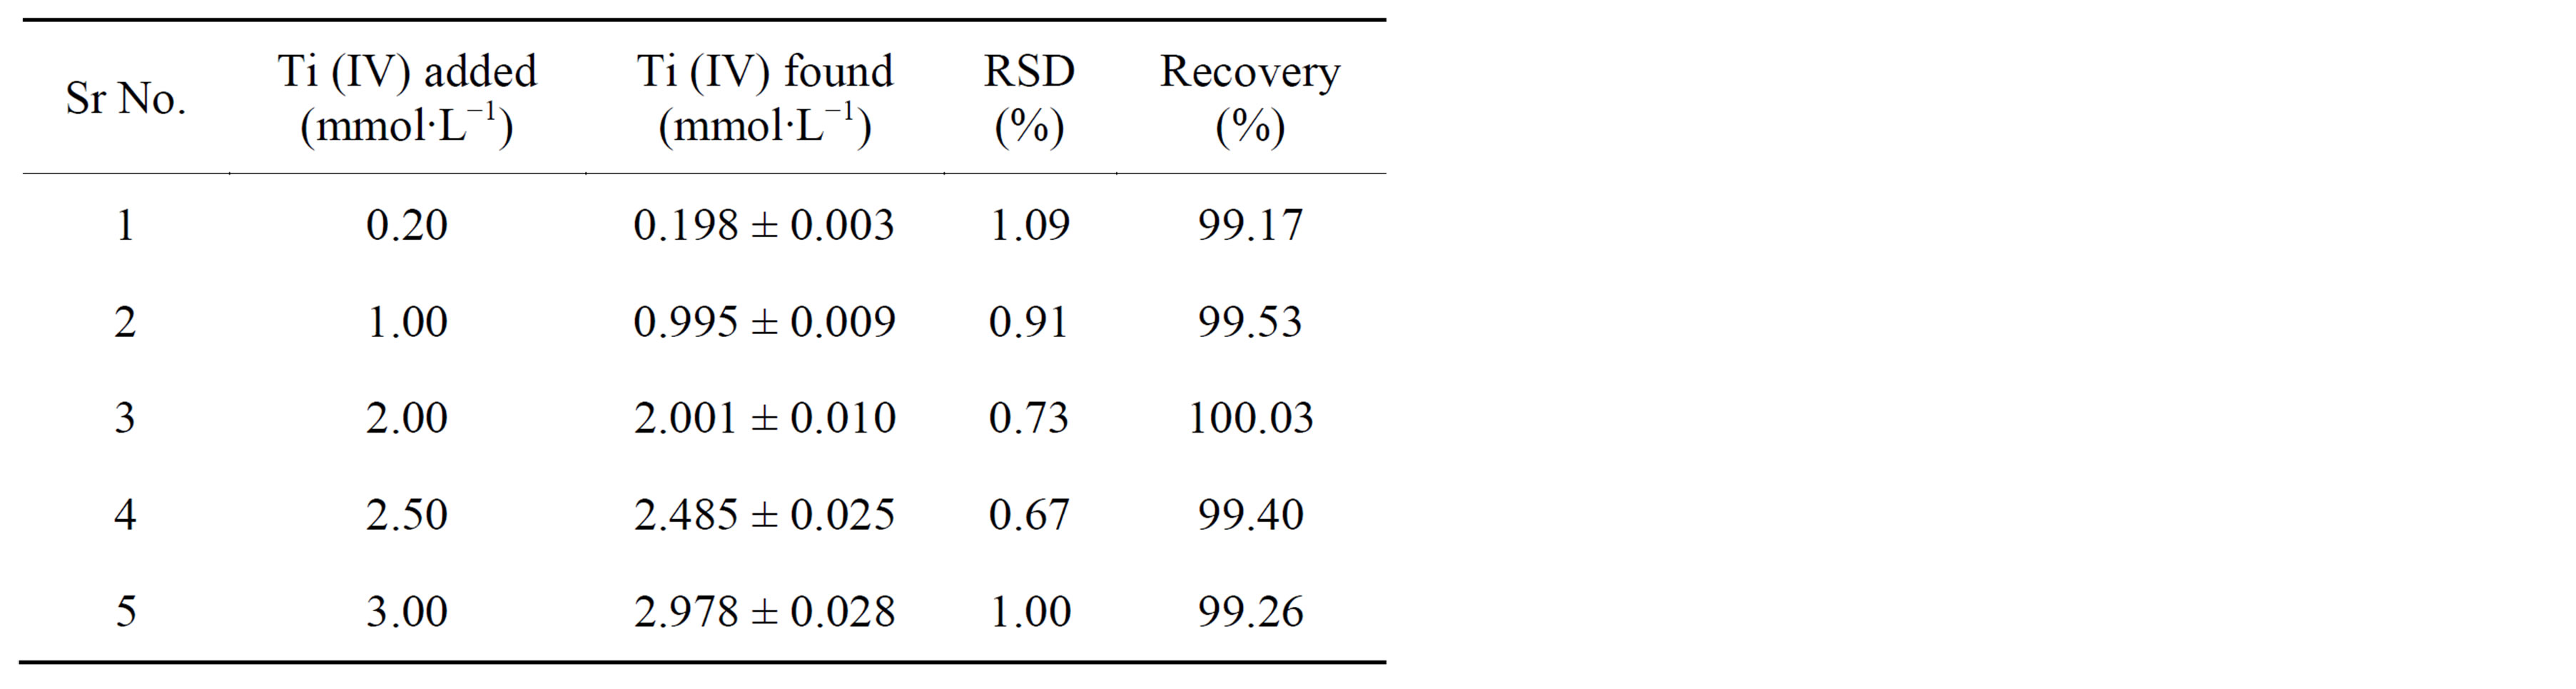
Table 1. Precision and accuracy of Ti (IV) determination using standard working solution (n = 5) (each solution containing 3.75 mol∙L−1 HNO3, 200 mmol∙L−1 H2O2, nitrified for 20 min, and developed for 10 min).
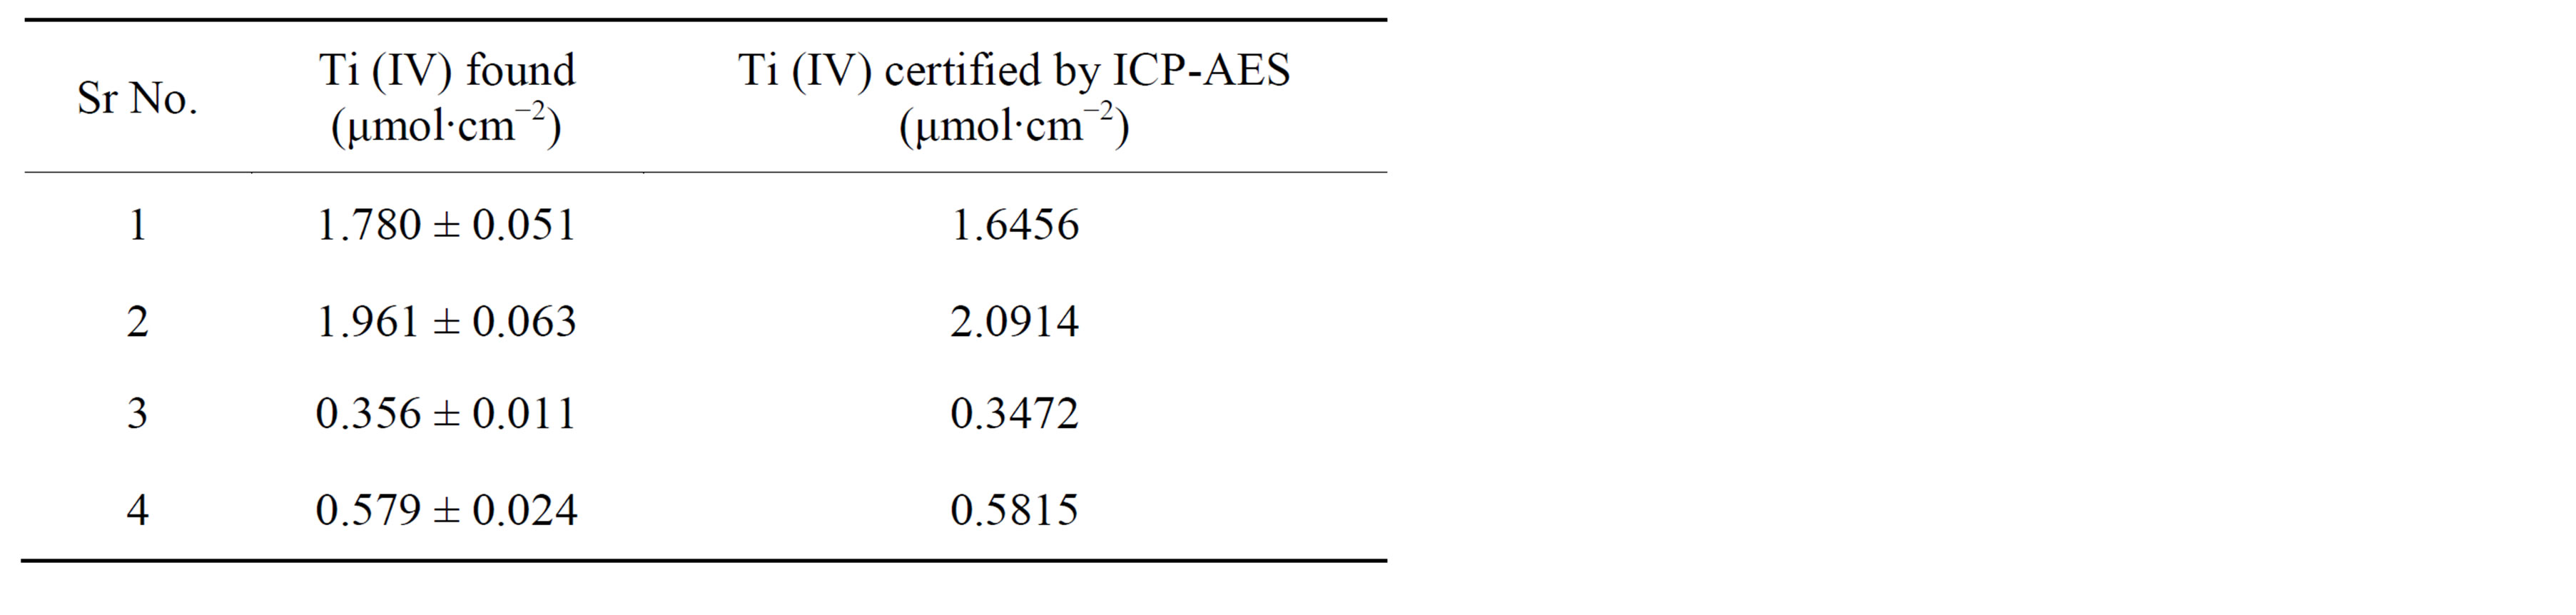
Table 2. Analysis of Ti (IV) in real samples (n = 4) (each digested solution containing 3.75 mol∙L−1 HNO3, 200 mmol∙ L−1 H2O2, nitrified for 20 min, and developed for 10 min).
tometric determination of Ti (IV) has been established in the present work. The proposed procedure offers the advantages of high recovery (>99%) and low RSD (<1.1%) in such a short time without extraction by organic solvent, preconcentration, preseparation or ashing. Aluminum ion coming from matrix does not interfere with the determination of Ti (IV) in real samples, and the observed concentration of Ti (IV) is in keeping with the value certified by ICP-AES. The present method can be used as an alternative method for the determination of Ti (IV) on the surface of etched aluminum foils.
Acknowledgements
The authors highly appreciate Xi’an Maxsun Kores New Materials Co., LTD. for ICP-AES experimental assistance. The authors are grateful to the National Natural Science Foundation of China (Granted No. 50902109), the Natural Science Foundation of Shaanxi Province (Granted No. 2010JQ6002), and the Fundamental Research Funds for the Central Universities (Granted No. XJJ2012076) for the financial supports.
REFERENCES
- Y. L. Xu, “Al2O3-(Ba0.5Sr0.5)TiO3 Composite Oxide Films on Etched Aluminum Foil by Sol-Gel Coating and Anodizing,” Ceramics International, Vol. 30, No. 7, 2004, pp. 1741-1743. http://dx.doi.org/10.1016/j.ceramint.2003.12.137
- X. F. Du and Y. L. Xu, “Formation of Al2O3-BaTiO3 Composite Thin Film to Increase the Specific Capacitance of Aluminum Electrolytic Capacitor,” Thin Solid Films, Vol. 516, No. 23, 2008, pp. 8436-8440. http://dx.doi.org/10.1016/j.tsf.2008.04.077
- X. F. Du and Y. L. Xu, “Formation of Al2O3-Bi4Ti3O12 Nanocomposite Oxide Films on Low-Voltage Etched Aluminum Foil by Sol-Gel Processing,” Surface & Coatings Technology, Vol. 202, No. 10, 2008 pp. 1923-1927. http://dx.doi.org/10.1016/j.surfcoat.2007.08.020
- X. F. Du and Y. L. Xu, “Preparation and Electrical Properties of an Anodized Al2O3-BaTiO3 Composite Film,” Journal of the American Ceramic Society, Vol. 91, No. 7, 2008, pp. 2360-2363. http://dx.doi.org/10.1111/j.1551-2916.2007.02104.x
- K. Kamada, M. Tokutomi, N. Enomoto and J. Hojo, “Incorporation of Oxide Nanoparticles into Barrier-Type Alumina Film via Anodic Oxidation Combined with Electrophoretic Deposition,” Journal of Materials Chemistry, Vol. 15, No. 33, 2005 pp. 3388-3394. http://dx.doi.org/10.1039/b504364f
- L. Sun, J. F. Bu, W. X. Guo, Y. Y. Wang, M. Y. Wang and C. J. Lin, “Electrophoresis Deposition of TiO2 Nanoparticles on Etched Aluminum Foil for Enhanced Specific Capacitance,” Electrochemical and Solid-State Letters, Vol. 15, No. 1, 2012, pp. E1-E3. http://dx.doi.org/10.1149/2.013201esl
- Z. S. Feng, J. J. Chen, C. Zhang, N. Zhao and Z. Liang, “Formation of Al2O3-TiO2 Composite Oxide Films on Aluminum Foil by Cathodic Electrodeposition and Anodizing,” Ceramics International, Vol. 38, No. 3, 2012, pp. 2501-2505. http://dx.doi.org/10.1016/j.ceramint.2011.11.019
- J. F. Bu, L. Sun, Q. Wu, M. Y. Wang and C. J. Lin, “Al2O3-TiO2 Composite Oxide Films on Etched Aluminum Foil Fabricated by Electrodeposition and Anodization,” Science China-Chemistry, Serial B, Vol. 54, No. 10, 2011, pp. 1558-1564. http://dx.doi.org/10.1007/s11426-011-4377-9
- L. Yao, J. H. Liu, M. Yu, S. M. Li and H. Wu, “Formation and Capacitance Properties of Ti-Al Composite Oxide Film on Aluminum,” Transactions of Nonferrous Metals Society of China, Vol. 20, No. 5, 2010, pp. 825- 830. http://dx.doi.org/10.1016/S1003-6326(09)60221-1
- J. H. Jang, T. Y. Kim, C. H. Lee, J. Zhang, E. M. Park, C. Park and S. J. Suh, “Preparation and Characterization of (Ba0.8Sr0.2)TiO3-Al2O3 Composite Oxide for Thin Film Capacitor,” Japanese Journal of Applied Physics, Vol. 50, No. 7, 2011, pp. 071502. http://dx.doi.org/10.1143/JJAP.50.071502
- J. J. Chen, Z. S. Feng and B. C. Yang, “Al2O3-TiO2 Composite Oxide Films on Etched Aluminum Foil by Hydrolysis Precipitation and Anodizing,” Journal of Materials Science, Vol. 41, No. 2, 2006, pp. 569-571. http://dx.doi.org/10.1007/s10853-005-2507-5
- N. Lavi and Z. B. Alfassi, “Determination of Trace Amounts of Cadmium, Cobalt, Chromium, Iron, Molybdenum, Nickel, Selenium, Titanium, vanadium, and Zinc in Blood and Milk by Neutron-Activation Analysis,” Analyst, Vol. 115, No. 6, 1990, pp. 817-822. http://dx.doi.org/10.1039/an9901500817
- L. Zhang, D. Ishi, K. Shitou, Y. Morita and A. Isozaki, “Simultaneous Multi-Element Analysis of Total As, Se and Sb on Titanium Dioxide by Slurry Sampling-Graphite Furnace Atomic Absorption Spectrometry,” Talanta, Vol. 68, No. 2, 2005, pp. 336-342. http://dx.doi.org/10.1016/j.talanta.2005.08.072
- S. Hirata, Y. Umezaki and M. Ikeda, “Determination of Chromium(III), Titanium, Vanadium, Iron(III), and Aluminum by Inductively Coupled Plasma Atomic EmissionSpectrometry with an Online Preconcentrating Ion-Exchange Column,” Analytical Chemistry, Vol. 58, No. 13, 1986, pp. 2602-2606. http://dx.doi.org/10.1021/ac00126a005
- A. P. Packer, D. Lariviere, C. Li, M. Chen, A. Fawcett, K. Nielsen, K. Mattson, A. Chatt, C. Scriver and L. S. Erhardt, “Validation of an Inductively Coupled Plasma Mass Spectrometry (ICP-MS) Method for the Determination of Cerium, Strontium, and Titanium in Ceramic Materials Used in Radiological Dispersal Devices (RDDs),” Analytica Chimica Acta, Vol. 588, No. 2, 2007, pp. 166- 172. http://dx.doi.org/10.1016/j.aca.2007.02.024
- F. L. Melquiades, D. D. Ferreira, C. R. Appoloni, F. Lopes, A. G. Lonni, F. M. Oliveira and J. C. Duarte, “Titanium Dioxide Determination in Sunscreen by Energy Dispersive X-Ray Fluorescence Methodology,” Analytica Chimica Acta, Vol. 613, No. 2, 2008, pp. 135-143. http://dx.doi.org/10.1016/j.aca.2008.02.058
- M. Gawrys and J. Golimowski, “Sensitive and Very Selective Determination of Titanium by Adsorptive-Catalytic Stripping Voltammetry with Methylthymol Blue, Xylenol Orange and Calcein,” Analytica Chimica Acta, Vol. 427, No. 1, 2001, pp. 55-61. http://dx.doi.org/10.1016/S0003-2670(00)01183-1
- G. M. Mastoi, M. Y. Khuhawar, K. Abbasi, M. Akhtar, S. Naz, H. Khan, A. Mallah and Z. Memon, “Development of New Spectrophotometric Determination of Titanium in Homeopathic Pharmacy Using Ponceau S as a Reagent,” African Journal of Pharmacy and Pharmacology, Vol. 5, No. 8, 2011, pp. 1179-1181.
- M. Hoshino, S. Kamino, S. Mitani, M. Asano, T. Yamaguchi and Y. Fujita, “Spectrophotometric Determination of Titanium with O-Carboxyphenylfluorone in Cationic Micellar Media, and Its Equilibrium and Kinetic Studies,” Talanta, Vol. 85, No. 5, 2011, pp. 2339-2343. http://dx.doi.org/10.1016/j.talanta.2011.07.072
- F. Y. Zheng, S. X. Li, L. X. Lin and L. Q. Cheng, “Simple and Rapid Spectrophotometric Determination of Trace Titanium (IV) Enriched by Nanometer Size Zirconium Dioxide in Natural Water,” Journal Hazardous Materials, Vol. 172, No. 2-3, 2009, pp. 618-622. http://dx.doi.org/10.1016/j.jhazmat.2009.07.042
- Q. Z. Zhai, “A Novel Catalytic Kinetic Spectrophotometric Method for Determination of Titanium,” Chemia Analityczna (Warsaw), Vol. 54, No. 1, 2009, pp. 89-97.
- F. S. Kika and D. G. Themelis, “Selective Stopped-Flow Sequential Injection Method for the Spectrophotometric Determination of Titanium in Dental Implant and Natural Moroccan Phosphate Rock,” Talanta, Vol. 71, No. 3, 2007, pp. 1405-1410. http://dx.doi.org/10.1016/j.talanta.2006.07.018
- A. H. El-Sheikh and J. A. Sweileh, “A Rapid and Simple Microwave-Assisted Digestion Procedure for Spectrophotometric Determination of Titanium Dioxide Photocatalyst on Activated Carbon,” Talanta, Vol. 71, No. 5, 2007, pp. 867-1872.
- A. Varghese, A. M. A. Khadar and B. Kalluraya, “Simultaneous Determination of Titanium and Molybdenum in Steel Samples Using Derivative Spectrophotometry in Neutral Micellar Medium,” Spectrochimimica Acta, Part A, Vol. 64, No. 2, 2006, pp. 383-390. http://dx.doi.org/10.1016/j.saa.2005.07.034
- V. Vojkovic, V. A. Zivcic and V. Druskovic, “Spectrophotometric Determination of Titanium (IV) by Extraction of Its Thiocyanate Complex with Cationic Surfactants,” Spectroscopy Letters, Vol. 37, No. 4, 2004, pp. 401-420. http://dx.doi.org/10.1081/SL-120039590
- R. K. Mondal and P. K. Tarafder, “Extractive Spectrophotometric Determination of Titanium in Silicate Rocks, Soils and Columbite-Tantalite Minerals,” Microchimica Acta, Vol. 148, No. 3-4, 2004, pp. 327-333. http://dx.doi.org/10.1007/s00604-004-0272-9
- A. Safavi, M. Mirzaee and H. Abodollahi, “Simultaneous Spectrophotometric Determination of Iron, Titanium, and Aluminum by Partial Least-Squares Calibration Method in Micellar Medium,” Analytical Letters, Vol. 36, No. 3, 2003, pp. 699-712. http://dx.doi.org/10.1081/AL-120018258
- A. S. Amin, “Spectrophotometric Method for the Determination of Titanium in Soil, Geo-Chemical, Silicates Rock and Paint Samples,” Quimica Analitica (Barcelona), Vol. 20, No. 4, 2002, pp. 217-222.
- X. R. Huang, W. J. Zhang, S. F. Song and L. Z. Wang, “Kinetic Spectrophotometric Determination of Titanium(IV) at Trace Level with Bromopyrogallol Red in Ionic/NonIonic Surfactant Mixed Micellar Media,” Journal of the Indian Chemical Society, Vol. 79, No. 1, 2002, pp. 65-67.
- H. W. Gao, W. G. Liu and Q. Liu, “Dual-Wavelength Spectrophotometric Determination of Properties of Titanium Complex Solution with O-Chlorophenylfluorone,” Asian Journal of Chemistry, Vol. 12, No. 4, 2000, pp. 1107-1112.
- S. Kus, Z. Marczenko and N. Obaski, “Determination of Titanium with Hydrogen-Peroxide in Steels Using Derivative Spectrophotometry,” Chemica Analityczna (Warsaw), Vol. 37, No. 5, 1992, pp. 569-578.
- I. G. Lukianets, M. A. Artemova and L. Y. Kolodyazhnaya, “Direct Complexometric Determination of Titanium in the Presence of Hydrogen-Peroxide,” Industrial Laboratory, Vol. 56, No. 9, 1990, pp. 1055-1057.
- M. Munoz, J. Alonso, J. Bartroli and M. Valiente, “Automated Spectrophotometric Determination of Titanium (IV) in Water and Brines by Flow-Injection Based on Its Reaction with Hydrogen-Peroxide,” Analyst, Vol. 115, No. 3, 1990, pp. 315-318. http://dx.doi.org/10.1039/an9901500315
- Y. Danzaki and J. Kimura, “Spectrophotometric Determination of Titanium with Hydrogen-Peroxide in the Presence of Fluoride-Ion,” Bunseki Kagaku, Vol. 32, No. 2, 1982, pp. T17-T21. http://dx.doi.org/10.2116/bunsekikagaku.31.2_T17
- M. Otomo, “The Spectrophotometric Determination of Titanium with Hydrogen Peroxide and Xylenol Orange,” Bulletin of the Chemical Society of Japan, Vol. 36, No. 10, 1963, pp. 1341-1346. http://dx.doi.org/10.1246/bcsj.36.1341
- M. K. T. Bassan, P. K. Sharma and R. K. Singhal, “Low Cost and Rapid Analytical Technique for Determination of Niobium and Titanium in Zirconium Alloy,” Analytical Methods, Vol. 2, 2010, pp. 1559-1564. http://dx.doi.org/10.1039/c0ay00238k
- S. M. Talebi and M. Malekiha, “Simultaneous Determination of Trace Heavy Metals in Ambient Aerosols by Inductively Coupled Plasma Atomic Emission Spectrometry after Pre-Concentration with Sodium Diethyldithiocarbamate,” Journal Environment Science Engineering, Vol. 50, No. 3, 2008, pp. 197-202.
- F. Marahel, M. Ghaedi, A. Shokrollahi, M. Montazerozohori and S. Davoodi, “Sodium Dodecyl Sulfate Coated Poly (vinyl) Chloride: An Alternative Support for Solid Phase Extraction of Some Transition and Heavy Metals,” Chemosphere, Vol. 74, No. 4, 2009, pp. 583-589. http://dx.doi.org/10.1016/j.chemosphere.2008.09.034
- F. A. Aydin and M. Soylak, “Separation, Preconcentration and Inductively Coupled Plasma-Mass Spectrometric (ICP-MS) Determination of Thorium (IV), Titanium (IV), Iron (III), Lead (II) and Chromium (III) on 2-Nitroso-1- naphthol Impregnated MCI GEL CHP20P Resin,” Journal of Hazardous Materials, Vol. 173, No. 1-3, 2010, pp. 669-674. http://dx.doi.org/10.1016/j.jhazmat.2009.08.137
- T. Madrakian, A. Afkhami and A. Esmaeili, “Spectrophotometric Determination of Bismuth in Water Samples after Preconcentration of Its Thiourea-Bromide Ternary Complex on Activated Carbon,” Talanta, Vol. 60, No. 4, 2003, pp. 831-838. http://dx.doi.org/10.1016/S0039-9140(03)00135-8
NOTES
*Corresponding author.