American Journal of Analytical Chemistry
Vol.5 No.1(2014), Article ID:41853,7 pages DOI:10.4236/ajac.2014.51001
Complexing Properties of Acid Alizarin Violet with Copper, Cobalt and Nickel in Micellar Media Containing SDS, CTAB and TX-100
1Department of Biology, Chemistry and Environmental Sciences, American University of Sharjah, Sharjah, United Arab Emirates
2Department of Chemistry and Chemical Technology, Faculty of Science & Technology, Al-Quds University, East Jerusalem, Palestine
Email: *fjumean@aus.edu, magdy.eldakiky@undp.org, amanassra@yahoo.com, Manalayyad67@hotmail.com, mabulhaj@yahoo.com, mkhamis@aus.edu
Received November 22, 2013; revised December 25, 2013; accepted January 2, 2014
ABSTRACT
The interaction of the dye acid alizarin violet (AVN) with three transition metals was followed spectrophotometrically in water and in micellar solutions of the cationic cetyltrimethylammonium bromide (CTAB), the anionic sodium dodecyl sulfate (SDS) and the nonionic triton X-100 (TX-100). The stoichiometric ratios for the complexes of AVN with each metal ion were determined by the mole ratio and the continuous variation methods. In water, the metal to dye ratios in the complexes were 1:2, 1:3 and 1:1 for Cu2+, Co2+ and Ni2+, respectively. For Ni2+ the ratio changed to 1:3 in micellar CTAB. All other ratios were unchanged in the three micellar solutions. The formation constant (βn) of the complex in water was 1.00 × 10¹⁰ for Cu2+, 4.66 × 10¹⁴ for Co2+ and 9.03 × 10⁴ for Ni2+. βn decreased in micellar TX-100: for Cu2+ to 6.88 × 10⁸, for Co2+ to 1.56 × 10¹⁴ and for Ni2+ to 8.65 × 10⁴. By contrast, micellar CTAB increased βn for Cu2+ and Ni2+. For Cu2+, the increase was to 5.19 × 10¹⁰, but for Ni2+ a large jump was observed, to 1.16 × 10¹⁵. For Co2+, βn dropped to 2.16 × 10¹⁴ in CTAB. Micellar SDS decreased βn for Cu2+ and Co2+ complexes to 5.38 × 10⁹ and 1.76 × 10¹⁴, respectively, but increased that of the Ni2+ complex to 4.40 × 10⁵. These observations were explained in terms of structural properties.
Keywords:Complexation; AVN; Micellization
1. Introduction
Chromogenic ligands have been used in quantitative determinations of heavy metals by spectrophotometric methods [1-]">3]. Recent research revealed that surfactants improved the reliability and accuracy of these methods [4-]">6]. Two spectrometric methods, mole ratio and continuous variation [2,7,]">8], have been widely used to study the composition of complexes. The former works well for weakly dissociated complexes and the latter is most useful when the dissociation constant is very large. For a moderately dissociated complex, considerable curvature results from the incompleteness of the reaction around the stoichiometric point. In such cases, intersection of one straight line through the points at low mole fractions with another line at high values gives the correct stoichiometry [2].
In industry, metallization of dyes is carried out during the mordanting process in order to fix the dye to the substrate [9]. The introduction of metal to the azo group may cause a significant bathochromic shift due to the extended conjugation associated with metal chelation to the main chromophore [10]. Acid alizarin violet (AVN), [4-hydroxy-3-(2-hydroxy-1-naphthylazo) benzene sulphonic acid] (Scheme 1), was found to give good mordanting
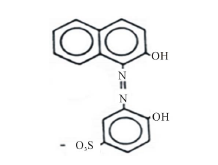
Scheme 1. Acid alizarin violet.
results [11]. Azo dyes can exist in two tautomeric forms: azo and hydrazo [12]. The change from the azo to the hydrazo tautomer is usually accompanied by a large red shift of the absorption band [12]. Absorption spectra in water and other polar solvent indicate that the hydrazo form is dominant. In less polar media, azo and hydrazo forms are both significant as evidenced by absorption maxima of metal complexes being somewhat close to those of the hydrazo forms of the reagent giving the highest contrast. The coordination behavior of azo dyes containing hydroxyl, amino or carboxyl groups in one or more of the ortho positions with metal ions shows a decrease in the stability of the metal compounds with increased acidity of the dye [1]">3].
The effect of surfactants on the absorption spectra and solubilization of azo dyes has been investigated [4,14-1]">6]. For o,o'dihydroxyazo dyes, spectral changes have been explained on the basis of selective solubilization, hydrophobic interactions and concentration effects on the micellar pseudo-phase. Several mechanisms have been proposed to explain the enhancement of solubility of organic compounds in general, and azo-dyes in particular in surfactants of organic compounds in general, and azo-dyes in particular [4,14-1]">6]. Models of interactions were also suggested and observed changes have been attributed to incorporation of the dye into micelles [4,17].
This work attempts to shed light on the nature of complex formation between AVN and Cu2+, Ni2+, and Co2+ ions, in water as well as in micellar media.
2. Materials and Methods
2.1. Surfactants and Reagents
AVN was obtained from Aldrich as the sodium salt (C16H11O2N2SO3Na) and purified by recrystallization from ethanol. TX-100 (p-octyl-phenol (oxyethene)n, n = 9.5), SDS (sodium dodecyl sulfate) and CTAB (cetyltrimethylammonium bromide) were obtained from Sigma and used without further purification. Phosphoric, acetic and boric acids, and metal salts (NiCl2, CuSO4∙5H2O, and CoSO4) were of analytical grade.
2.2. Instrumentation
Absorption measurements were performed using a λ-5 Perkin-Elmer UV visible spectrophotometer equipped with a thermostated cell compartment. The temperature inside the cell was controlled by a Julabo U3 circulating thermostat. pH measurements were made using a Jenway 3310 pH meter fitted with a combination glass electrode and having a tolerance of 0.01 pH units.
2.3. Solutions
0.200 M TX-100 and 0.200 M CTAB stock solutions were prepared by dissolving 55.0 g and 36.4 g of these surfactants, respectively, in water followed by heating to 50.0˚C for 2 minutes in order to obtain a homogeneous solution. 0.200 M SDS stock solutions were prepared by dissolving 29.9 g SDS (sodium salt) in water. 0.040 M universal buffer was prepared by mixing calculated amounts of 19.6 M H3PO4, 17.5 M acetic acid and H3BO3. These solutions were in the pH range 2.0 - 12.0. pH was controlled by gradual addition of either 0.200 M HCl or NaOH The ionic strength was adjusted by adding NaCl or KCl.
2.4. Measurements
The stoichiometry of dye-metal complexes was determined using the mole ratio and the continuous variation methods. Blanks were of the same solution composition but with the metal ion absent. In the mole ratio method, dye-metal solutions were buffered at pH = 7.5. The ratio (moles of dye/moles of metal) was varied in the range 0.20 - 10 such that the amount of metal was kept constant but that of the dye varied. For each solution, absorbance at λmax was plotted against the mole ratio (moles of dye/moles of metal). The procedure was repeated with 1.00 mM CTAB, 1.00 mM TX-100 and 4.00 mM SDS. In the continuou s variation method, the total number of moles of dye and metal was kept constant, but each solution contained different mole fractions of dye and metal. All solutions were buffered at pH 7.50. Absorbance of each complex at an optimal wavelength was plotted against the mole fraction of dye and used to determine the stoichiometric composition of the complex ion. Measurements were performed in triplicates.
For equilibrium constant measurements, two sets of solutions were prepared. The first, used to obtain calibration curves, contained AVN in excess 0.270 mM and the concentration of the metal ion, which was limiting, was varied in the range 8.00 - 40.0 µM. The absorbance of the complex was recorded at a wavelength at which the most significant change was observed. Calibration curves were obtained by plotting absorbance of each solution at that wavelength vs. the concentration of metal ion (equal to that of the complex). In the second set, the metal ion concentration varied in the range 0.120 - 0.400 µM, whereas that of the dye was fixed at 0.680 µM. Constant ionic strength was maintained by addition of 1.07 M NaCl. The pH of all solutions was maintained at 7.50. All solutions were thermostated at 25.0˚C. The same procedure was used in the presence of micellar surfactants: 1.00 mM for both CTAB and TX-100 and 4.00 mM for SDS. Measurements were performed in triplicates.
3. Results and Discussion
3.1. Stoichiometry of Complexes
3.1.1. Cu2+-AVN
Figure 1 summarizes the results of the mole ratio method for Cu2+-AVN in water and in the presence of SDS, CTAB and TX-100. Figure 1 reveals that Cu2+ forms a 1:2 (metal/ligand) complex with AVN.
For AVN, represented by H3In, the sulphonate proton is highly acidic. The second and third dissociations may be represented by

and

At 25.0˚C and I = 0.100 M, pK2 and pK3 are 7.00 and 12.8, respectively [18]. Thus at pH = 7.50 the dye is mostly in the H2In− and HIn2− forms. It is believed that the hydroxyl group of naphthol may assist only partially in the coordination with metal ion [18 ] . For AVN, the oxide ion on the benzene ring and the nitrogen atom of the azo group are most probably involved in the coordination [9,12,19,]">20]. From a steric point of view, it is probable that the nitrogen atom involved in the coordination is the one that is farthest from the oxide ion, so that a six membered ring is formed. It has been suggested that azo dyes with o-hydroxyl azo groups react with Cu2+ so that the β-nitrogen atom bonds to Cu2+ with its sp2 lone pair to give a six membered ring [21 ] . The Cu2+ complex with AVN and with the similar benzene azo-β-naphthol may thus consist of two molecules of azo dyes centrosym-metrically disposed about the central copper ion, with the two oxygen and β-nitrogen atoms of the azo group forming a square. The molecul e as a whole is not planar, with the azo group lying out of the plane of the β-naphthol residue and the benzene ring [22, ]"> ] ">23] (Scheme 2).
Similar studies in the presence of micellar concentrations of CTAB, TX-100 and SDS reveal identical stoichiometry (Figure 1). For CTAB, the dye molecules are incorporated in CTAB micelles, with their negative (hydroxyl) groups near the Štern layer [18]. Since the dye chelating sites are concentrated at the micelle surface, the metal ion bonds readily to two dye molecules in the vicinity of this layer. For TX-100, a nonionic surfactant, the dye chelating centers are more likely located at the polarizable Štern layer but its hydrophobic portion is incorporated in the micelle core. The arrangement of sur-
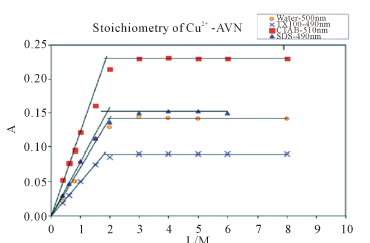
Figure 1. Absorbance vs. mole ratio plot (ligand/metal) for the complex Cu2+-AVN in water, 1.00 mM CTAB, 1.00 mM TX-100 and 4.00 mM SDS. pH = 7.50, T = 25.0˚C, µ = 0.100 M.
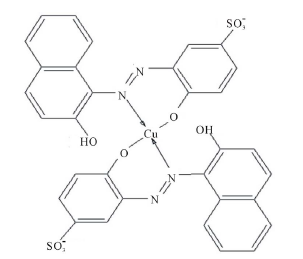
Scheme 2. Square planar structure of Cu2+-AVN.
factant micelles serves to guide dye molecules towards the metal ion. The deep penetration of dye molecules in TX-100 micelles can be also explained on the basis of the ability of metal ions to be closer to the Štern layer, where negative portions of the dye molecules are present. Thus the complexation geometry is not affected on moving from water to micellar media. For SDS, an anionic surfactant, the negative polar head groups are oriented outside its micellar core, thereby preventing dye molecules from substantially approaching it. This allows the dye retain its aqueous media properties.
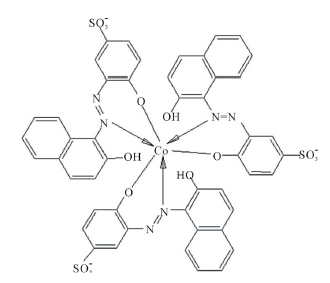
3.1.2. Co2+-AVN
Figure 2 summarizes the results of the mole ratio method for Co2+-AVN, in water and in the presence of CTAB, SDS and TX-100. The plots show that the metal: dye ratio is 1:3 in water and that this ratio is not affected by micellar surfactants. It is noteworthy that 1:3 ratio was shown to exist for other azo dyes [22, ]"> ] ">23 ] . In these complexes, the nitrogen atom of the azo dye, side by side with the oxide atom, is involved in complexation (Scheme 3).
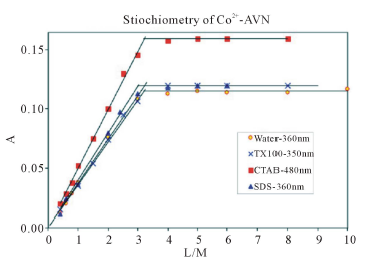
Figure 2. Absorbance vs. mole ratio plot (ligand/metal) for the complex Co2+-AVN in water, 1.00 mM CTAB, 1.00 mM TX-100 and 4.00 mM SDS. pH = 7.50, T = 25.0˚C, µ = 0.100 M.
The results with Cu2+ and Co2+ indicate that surfactants do not affect t he stoichiometric composition for AVN complexes with these ions. Thus neither CTAB, a cationic surfactant, nor TX-100, a nonionic surfactant, affect the stoichiometry of complexes containing more than one dye molecule. It is evident that 1:2 or 1:3 complexes in water are geometrically stable, and thus micellar media do not exert significant chelating influence.
3.1.3. Ni2+-AVN
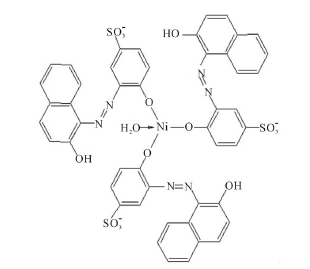
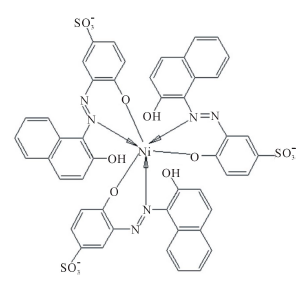
The mole ratio method gives 1:1 metal to dye ratio for Ni2+ and AVN in aqueous media (Figure 3). This ratio is not affected by micellar concentrations of either TX-100 or SDS. However, in the presence of CTAB, this ratio changes from 1:1 to 1:3.
Ni2+ reacts with o,o'-dyhydroxy azo dyes in 1:1 ratio and in a square planar geometry with the dye exclusively in the azo form [9 ]. In this case, only one additional H2O molecule is needed to complete coordination (Scheme 4).
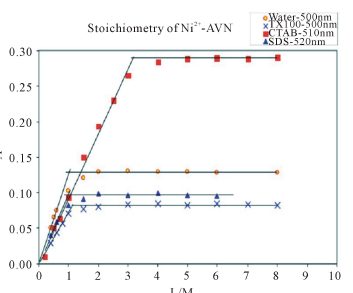
Figure 3. Absorbance vs. mole ratio (ligand/metal) plot for the complex Ni2+-AVN in water and in presence of 1.00 mM CTAB, 1.00 mM TX-100 and 4.00 mM SDS. pH = 7.50, T = 25.0˚C, µ = 0.100 M.
In the presence of CTAB, the dye molecules are redistributed in such a way that, in the vicinity of the Stern layer, their negative sides are close to the positive heads of CTAB. In this configuration, CTAB may act as a solid support, promoting bond formation between the metal ion and three, instead of just one, dye molecules. It would thus appear that whereas Ni2+ is generally unable to chelate three dye molecules in aqueous media, CTAB micellar media offer a suitable solid support and catalyst carrier for dye molecules, thereby allowing some metal ions to chelate more dye molecules. Octahedral geometry may be the preferred one in the presence of CTAB, where two sites in the dye molecule are involved (O−,N) and a coordination number of six is obtained with Ni2+ (Scheme 5). TX-100 does not provide the same positive support as CTAB because dye molecules are deeply penetrated inside micelles, thus a shielding effect is ex-
pected which keeps the ionic sites of the dye away from metal ions. SDS, with its negative head groups, retains the same aqueous environment for the dye, thereby preserving the 1:1 ratio. Table 1 summarizes the stoichiometric coefficients for the complexes studied in this work.
3.2. Effect of CTAB, TX-100 and SDS on the Formation Constants of Complexes
The formation of a coordinate complex between a metal (M) and a ligand (L) can be represented by M + nL ↔ MLn, where nth overall formation constant βn is given by [MLn]/([M]∙[L]n). As βn is concentration dependent, activity coefficients are held constant by maintain solutions at constant ionic strength. [MLn], [M] and [L] represent the equilibrium concentrations of complex, metal ion and ligand. Calibration curves are used to determine the complex concentration after equilibrium is established. Calibration curves were obtained by using excess AVN (6.80 × 10⁻⁶ mole) with known amounts of metal ions (2.0 × 10⁻⁷ to 1.0 × 10⁻⁶ mole). In this case it is assumed that all metal ions are complexed so that complex concentration would be identical to that of the metal ion used. Calibration curves are obtained by plotting absorbance vs. moles of metal (or moles of complex). In order to obtain βn, dye and metal ions are mixed with concentration ratios close to the stoichiometric ratio. Absorbance of these solutions is then compared with that in the calibration curve. Thus the number of moles of complex can be calculated from the calibration curve, and the unreacted metal and dye can be estimated from the initial values.
Two sets of dye-metal solutions are needed:
1) Calibration set in which the dye is in excess (6.80 × 10⁻⁶ mole) and the metal ion is limiting (2.00 × 10⁻⁷ to 1.00 × 10⁻⁶ mole). In this case moles of metal ions used are assumed to be equal to moles of complex formed.
2) Equilibrium set in which metal ions and dye are used in nearly stoichiometric concentrations. Moles of

Table 1 . Stoichiometry of the complexes of AVN with Cu2+, Co2+, Ni2+ as obtained by the mole ratio and the mole fraction methods, in aqueous and micellar media at pH = 7.50, T = 25.0˚C, µ = 0.100 M.
dye were held constant at 1.70 × 10⁻⁶ and moles of metal ions varied in the range 3.00 × 10⁻⁷ - 1.00 × 10⁻⁶.
3.2.1. Formation constant of Cu2+-AVN
The formation constant of Cu2+-AVN was measured in water and in the presence of each surfactant. The 1:2 metal to dye ratio yields the expression βn = [complex]/ ([metal ] ∙[dye ] 2), applicable in water and in the presence of surfactants, as it was shown that surfactant addition was not accompanied by a change in stoichiometric composition of the complex. Table 2 shows that addition of CTAB and SDS increases, whereas TX-100 lowers, βn. The lowering of pK2’ of the dye by CTAB [18] is expected to promote complex formation. By contrast, since TX-100 increases pK2’ of the dye [18 ], it should also lower the complex formation constant. As the oxide ion on the benzene ring is included in the coordination with metal ions [22, ] ">]">23], the complexation process may be retarded. SDS role is more open to speculation. This is because SDS gives a slight decrease in ionization constant of dye [18] but gives a higher βn than water. Micelles of CTAB as a solid support and catalyst carrier of dye molecules may enhance the stability of the complex, TX-100 micelles may have a negative effect due to shielding of dye molecules.
3.2.2. Formation Constant of Co2+-AVN
βn was calculated for Co2+-AVN in water and in the presence of surfactants. The 1:3 metal to dye ratio gives βn = [complex]/([Co2+]∙[AVN]3). The equation is valid in water as well as in and the presence of surfactants, because surfactant addition does not alter the complex stoichiometry. βn was calculated for the complexes in water and in the presence of micellar surfactant concentrations
Table 2 . Formation constants (βn) for complexes of 1.2 × 10⁻⁵ M Cu2+, Co2+ and Ni2+ with AVN in water and in 1.00 mM CTAB, 1.00 mM TX-100 and 4.00 mM SDS. [AVN] = 0.680 µM. T = 25.0oC, µ = 0.100 M, pH = 7.50.
(Table 2). Addition of either TX-100 or SDS lowered βn. SDS also gave values of βn that are also lower than those with no surfactant. For Co2+, the absence of surfactant is better than their presence. Low values of βn in case of SDS, TX-100 and CTAB can be explained on the assumption that the complex with three dye molecules is very stable in aqueous medium, while in presence of CTAB and TX-100, the ionic part of dye molecules may be partially shielded by micelles because of the penetration of dye molecules inside the micelle.
3.2.3. Formation Constant of Ni2+-AVN
βn was calculated for Ni2+-AVN in water and in the presence of the three surfactants (Table 2). The metal to dye ratio changed from 1:1 in water to 1:3 in CTAB. Thus βn is given by [complex]/([Ni2+ ]∙[AVN]3) in the presence of CTAB and by [complex]/([Ni2+]∙[AVN]) in water. It is apparent that βn undergoes a large increase with CTAB addition whereas TX-100 slightly lowers it. For Ni2+, βn follows the sequence: CTAB >> SDS > no surfactant ≥ TX-100.
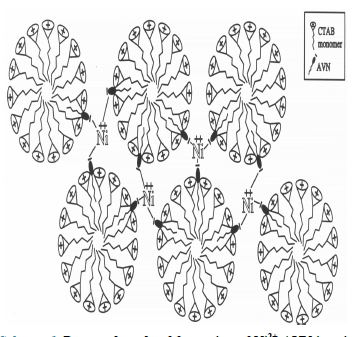
The effect of CTAB on the stoichiometry of Ni2+- AVN relates to its effect on βn. Since CTAB micelles provide solid support for AVN and alter the complex stoichiometry from 1:1 to 1:3, it appears that these micelles substantially and selectively increase the ability of Ni2+ to coordinate to AVN chelating sites. As a result, the complex stability is increased. The mode of complexation for Ni2+ with AVN in the presence of CTAB is shown in Scheme 6, which demonstrates that, a single Ni2+ ion is confined between three micelles in order to attain 1:3 ratio.
4. Conclusion
The addition of CTAB, SDS or TX-100 had no effect on Cu2+-AVN and Co2+-AVN stoichiometry. However, CTAB raised the metal to dye ratio for Ni2+-AVN from 1:1 to 1:3. This was explained on the supposition that CTAB acts as a catalyst carrier and forms solid support for AVN, thereby enabling Ni2+ to bind to three AVN
molecules, rather than just to one. CTAB attracts AVN towards its micelle core, thereby enhancing complexation with metal ions. TX-100 decreases βn for all three complexes but CTAB raises that of Cu2+-AVN, and SDS results in slight lowering. For Co2+-AVN, the drop in βn accompanying CTAB addition is presumably due to the large size of the complex, which contains three dye molecules. In this case, micelles may retard complexation and lower the formation constant. For Ni2+-AVN, CTAB caused a large jump in βn, indicating a highly stable complex structure. However, SDS resulted in only a small increase in βn, which can be attributed to the 1:1 ratio in this complex.
Acknowledgements
To Al-Quds University and American University of Sharjah for supporting this work.
- [2] R. Soomro, M. Ahmed, N. Memon and H. Khan, “A Simple and Selective Spectrophotometric Method for the Determination of Trace Gold in Real, Environmental, Biological, Geological and Soil Samples Using Bis(Salicylaldehyde) Orthophenylenediamine,” Journal of Analytical Chemistry Insights, Vol. 3, 2008, pp. 75-90.
- [3] C. Sabel, J. Neureuther and S. Siemann, “A Spectrophotometric Method for the Determination of Zinc, Copper, and Cobalt Ions in Metalloproteins Using Zincon,” Analytical Biochemistry, Vol. 397, No. 2, 2010, pp. 218-226. http://dx.doi.org/10.1016/j.ab.2009.10.037
- [4] H. Pouretedal, P. Sononi, M. Keshavarz and A. Semnani, “Simultaneous Determination of Cobalt and Iron Using First Derivative Spectrophotometric and H-Point Standard Addition Methods in Micellar Media,” Chemistry, Vol. 18, No. 3, 2009, pp. 23-35.
- [5] M. Dakiky and I. Nemacova, “Aggregation of o,o'-Dihydroxy Azo Dyes III. Effect of Cationic, Anionic and NonIonic Surfactants on the Electronic Spectra of 2-Hydroxy- 5-nitro-phenylazo-4-[3-methyl-1-(4''-sulfophenyl)-5-pyrazolone]” Dyes and Pigments, Vol. 44, No. 3, 2000, pp. 181- 193. http://dx.doi.org/10.1016/S0143-7208(99)00086-8
- [6] T. H. Con, I. Nemacova, I. Nemec and V. Suk, “A Spectrophotometric Study of the Reaction of Tin with Bromopyrogallol Red in the Presence of Cetylpyridinium Bromide,” Analytica Chimica Acta, Vol. 115, 1980, pp. 279-284. http://dx.doi.org/10.1016/S0003-2670(01)93166-6
- [7] H. Goa and N. Hu, “Langmuir Aggregation of Bordeaux R on a Cationic Surfactant and Its Application to Sensitive Quantitative Determination of Copper,” Journal of Solution Chemistry, Vol. 31, No. 2, 2002, pp. 165-174. http://dx.doi.org/10.1023/A:1015205220864
- [8] L. Meites and H. C. Thomas, “Advanced Analytical Chemistry,” McGraw Hill, New York, 1958.
- [9] R. Price, “The Chemistry of Metal Complex Dye Stuffs,” In: K. Venkatarman, Ed., The Chemistry of Synthetic Dyes, Academic Press, Cambridge, Vol. 3, 1970, pp. 308-359.
- [10] M. S. Masoud, A. M. G. Nassar, A. S. Abdelhameed and M. M. Dakiky, “Models in Chemistry,” Acta Chimica Hungaricae, Vol. 129, No. 5, 1992, pp. 631-640.
- [11] E. R. Trotman, “Dyeing and Chemical Technology of Textile Fibers,” 6th Edition, Charles Griffin Glasgow, 1984.
- [12] M. Dakiky, “Hydroxy Azo Dyes and Their Interaction with Surfactants,” Ph.D. Thesis, Charles University, Prague, 1992.
- [13] A. T. Pilipenko and L. I. Savransky, “Selectivity and Sensitivity of Metal Determination by Co-Ordination Compounds,” Talanta, Vol. 34, No. 1, 1987, pp. 77-86. http://dx.doi.org/10.1016/0039-9140(87)80011-5
- [14] F. A. Snavely and W. C. Fernelius, “Stabilities of Metal Derivatives of o-Substituted Azo Dyes,” Science Vol. 117, No. 3027, 1953, pp. 15-16. http://dx.doi.org/10.1126/science.117.3027.15
- [15] L. Krpejsova, L. Cermakova and J. Podlahova, “A Study of the Interaction of Triton X-100 with Methyl-Orange: Comparison with the Effects of Cyclodextrin” Tenside Surfactants Detergents, Vol. 28, No. 5, 1991, pp. 366- 369.
- [16] M. Dakiky, H. Dweik, K. Kanaan, I. Kayali, M. Khamis, A. Manasra, S. Najdi and I. Odeh, “Physico-Chemical Investigation of Buffer-Indicator Interactions in the Presence of Surfactants, Effect of Triton X-100 on the Thermodynamic Parameters of Ionization of Methyl Orange,” Journal of Al-Azhar Univesity, Vol. 1, No. 1, 1999, pp. 23-31.
- [17] M. Dakiky, M. Khamis, A. Manasra and K. Takrouri, “Effect of Surfactants on the Thermodynamic Properties of Methyl Orange Dye in Buffered Solutions,” Coloration Technology, Vol. 118, No. 4, 2002, pp. 191-197. http://dx.doi.org/10.1111/j.1478-4408.2002.tb00099.x
- [18] P. K. Dutta and S. N. Bhat, “Interaction of Phenazinium Dyes and Methyl Orange with Micelles of Various Charge Types,” Colloids and Surfaces A: Physicochemical and Engineering Aspects, Vol. 106, No. 2-3, 1996, pp. 127-134. http://dx.doi.org/10.1016/0927-7757(95)03374-2
- [19] M. Dakiky, A. Manassra, M. Abdul Kareem, F. Jumean and M. Khamis, “Acid Alizarin Violet Interactions with Surfactants: Ionization and Thermodynamic Parameters in Buffered Cationic, Anionic and Nonionic Surfactant Solutions,” Dyes and Pigments, Vol. 63, No. 1, 2004, pp. 101-113. http://dx.doi.org/10.1016/j.dyepig.2003.12.014
- [20] J. Fabian and H. H. Hartmann, “Light Absorption of Organic Colorants,” Springer-Verlag, Berlin, 1980. http://dx.doi.org/10.1007/978-3-642-67587-4
- [21] O. Abollino and C. Sarzanini, “Trace Metal Preconcentration with Sulphonated Azo-Dyes and ICP/AES Determination,” Spectrochimica Acta, Vol. 49A, No. 9, 1993, pp. 1411-1421.
- [22] P. F. Gordon and P. Gregory, “Organic Chemistry in Colour,” Springer, Berlin, 1983.
- [23] R. Price, “The Chemistry of Metal Complex Dyestuffs,” In: K. Venkatarman, Ed., The Chemistry of Synthetic Dyes, Academic Press, Cambridge, 1970, p. 303.
- [24] S. Wang and S. Shen, “Synthesis, Spectroscopic and Thermal Properties of a Series of Azo Metal Chelate Dyes,” Dyes and Pigments Vol. 44, No. 3, 2000, pp. 195-198. http://dx.doi.org/10.1016/S0143-7208(99)00087-X
NOTES
*Corresponding author.