American Journal of Analytical Chemistry
Vol.4 No.4(2013), Article ID:30433,7 pages DOI:10.4236/ajac.2013.44021
Using of In-Situ Mercury Film Sensor Hyphenated with Affinity Voltammetry for High Throughput Drug-Protein Binding Studies
1Chemistry Department, Faculty of Science, Assiut University, Assiut, Egypt
2Chemistry Department, Faculty of Science, King Abdulaziz University, Jeddah, Saudi Arabia
Email: *deiaabdelhady@yahoo.com
Copyright © 2013 Ahmed K. Youssef, Deia Abd El-Hady. This is an open access article distributed under the Creative Commons Attribution License, which permits unrestricted use, distribution, and reproduction in any medium, provided the original work is properly cited.
Received February 9, 2013; revised March 25, 2013; accepted April 15, 2013
Keywords: Sensor; Affinity Voltammetry; Fenoprofen; Bovine Serum Albumin; Binding Constant
ABSTRACT
A new simple and reliable in-situ mercury film sensor coupled with affinity differential pulse stripping voltammetry (ADSPV) or affinity cyclic voltammetry (ACV) was investigated. The interaction of fenoprofen with bovine serum albumin (BSA) onto the proposed electrochemical sensor was studied. The nature of the electrochemical process of fenoprofen by cyclic voltammetry was depicted. Reproducibility of the proposed method was checked giving a precision of 0.073 standard deviation. The limit of detection and limit of quantification were 7.0 and 22.0 nmol/L, respectively. Fenoprofen was interacted with BSA by 1:1 stoichiometry to form electroinactive supramolecular complex. The binding constant was precisely estimated by non-linear regression analysis based on the shifting of analyte peak potentials. The proposed experiments and data analysis could be used to investigate the drug-protein binding constant within a short analysis time compared to other chromatographic techniques.
1. Introduction
Fenoprofen is a nonsteroidal antiinflammatory drug that is effective for treating the fever, pain, and swelling caused by inflammation. Fenoprofen was approved by the Food and Drug Administration (FDA) in March 1976. Fenoprofen blocks the enzymes that make prostaglandins (cyclooxygenases), resulting in lower concentrations of prostaglandins. As a consequence, inflammation, swelling, pain and fever are reduced. It is a propionic acid derivative (Figure 1) which shows very low aqueous solubility and freely soluble in alcohols [1]. The difficulty of fenoprofen solubility in aqueous media leads to limit the study of its interaction with protein under the physiological conditions. Cyclodextrins (CDs) are well-known that possess hydrophobic cavities leading to improve the solubility of drugs, and stabilizing or solubilizing agents [2]. The
![]()
Figure 1. The structural formula of fenoprofen.
hydroxypropyl derivatives of cyclodextrin are very often used in pharmacy due to their better complexation ability than that of natural cyclodextrin and they increase the solubility and bioavailability more than natural cyclodextrin [3]. Therefore, in the present work, hydroxypropylbeta-cyclodextrin (HPβCD) was used to enhance the solubility power of fenoprofen in aqueous media and open the door to study its interaction with protein.
Interaction of drugs with protein has recently aroused great interest to understand their bioavailability and has considered one of the essential steps of drug discovery [4]. A drug’s efficiency may be affected by the degree to which it binds to proteins within blood plasma. The less bound a drug is, the more efficiently it can traverse cell membranes or diffuse. Notably, it is the unbound fraction which exhibits pharmacologic effects. It is also the fraction that may be metabolized and/or excreted. The bound portion may act as a reservoir or a depot from which the drug is slowly released as the unbound form in order to maintain equilibrium [4]. Many methods have been proposed for the study of the binding reaction with protein such as chromatography [5], electrophoresis [6], spectrophotometry [7], fluorometry [8] and light scattering techniques [9]. Compared with these methods, affinity voltammetry is rapid, simple, low-cost and practical with low detection limit and a wide dynamic range. Because the electrochemical reaction occurs on the electrode/solution interface, it is especially suitable for a small amount of sample. Affinity Voltammetry is a useful technique for the study of the interaction of small molecule with biomolecules, and used to investigate the binding reaction of protein with drugs [10].
Only one paper was dealt with the calculation of fenoprofen-protein binding constants by separation approaches [1]. Voltammetry can be considered as a convenient alternative technique. The choice of electrochemical sensor is a crucial point that should have a favorable electrochemical behavior of the analyte of interest, friendly environment and a reproducible surface area with low background current. In-situ plated mercury film sensor [11] is the best one that could achieve a large surface area with low volume ratio, high plating efficiency, high sensitivity and good selectivity due to the fast diffusion of analyte through the film.
In the present study, a new simple, sensitive and reliable ADPSV method for the determination of fenoprofen in aqueous media at in-situ mercury film sensor was investigated. The precise binding constant of fenoprofen with BSA was calculated by coupling ACV or ADSPV with non linear regression analysis based on the changes of electrochemical responses of analyte onto in-situ mercury film sensor.
2. Experimental
2.1. Instrument
All voltammetric investigations were performed in a 10.0 mL glass voltammetric cell using commercial available electrode stand (Metrohm, Switzerland). The electrode was connected via IME-663 module (Netherlands). Potentials were controlled using a 3-electrode configuration comprising a rotating glassy carbon disc working electrode (3 mm diameter, Metrohm), a Ag/AgCl (3.00 M KCl) reference electrode and a platinum wire counter electrode. Turbidity was obtained by using turbidity and chlorine benchtop meter, LaMotte LTC-3000we, 0 - 4000 NTU & 0 - 10.0 µg/mL. The pH’s were measured using the Fischer Scientific pH meter model 810 equipped with a combined glass electrode, which was calibrated regularly with buffer solutions (pH = 4.0 and 7.0) at 22˚C ± 2˚C.
2.2. Chemicals and Reagents
Highly purified L-fenoprofen was produced by Western pharmaceutical industries, Egypt. A fresh solution of fenoprofen was prepared daily in 10.0 mL of 0.25 mM hydroxypropyl-β-cyclodextrine (HPβCD) and was diluted as required for quantitative analysis. Bovine serum albumin (BSA, 99%, Sigma) was used as received without further purification. The 1.0 g/L stock solution of BSA was prepared by dissolving it directly in twice distilled water and was stored at 4.0˚C. The working solutions were obtained by diluting the stock solution with phosphate buffer. A physiological concentration of 67.0 mmol/L phosphate buffer solution was used to control the pH of the solutions tested. It was prepared by mixing definite weights of Na2HPO4 (Sigma) and NaH2PO4 (sigma) at each desired pH value. Stock solution of mercuric ion (10−2 mol/L) was prepared by dissolving the required weight of basic nitrate (May & Baker Ltd., Dagenham, UK) in twice distilled water. All other reagents were of analytical reagents grade.
2.3. Procedure
2.3.1. Fabrication of In-Situ Mercury Film Sensor
The glassy carbon electrode (GCE) was polished at the beginning of the experiments with 0.05 µm aluminum oxide (particle size = 0.10 µm, Metrohm, Switzerland) and was rinsed thoroughly with water to obtain a clean and renewed the electrode surface. The electrode was connected to the potentiostat and placed in the buffer solution; the potential was cycled 50X between −0.8 to +0.8 V using cyclic voltammetry at a scanning rate of 0.1 V/s. The electrochemical pretreatment was repeated daily, the polishing only when damage of the electrode surface was suspected. The in-situ mercury film sensor was prepared by pippeting 10.0 mL of the phosphate buffer at physiological pH into the cell followed by the simultaneous depositing of 30.0 µmol/L mercury (II) and fenoprofenHPβCD complex on GCE. Oxygen was removed by purging 5.0 min with nitrogen and then deposition was carried out for 60.0 s at −0.5 V, whilst the electrode was rotated at 700.0 rpm. Subsequently after 10.0 s equilibrium time the stripping step was cathodically performed from −0.5 to −1.35 V using a pulse height 50.0 mV. Each scan was preceded by an electrochemical cleaning step to remove the previous film by applying constant potential at 0.5 V for 30.0 s. All measurements were performed under ambient conditions.
2.3.2. Voltammetric Study of Fenoprofen-BSA Interaction
Into a 10.00 mL volumetric cell, 0.5 mL of 100.0 mmol/L fenoprofen dissolved in HPβCD and an appropriate amount of BSA were added. The mixture was diluted with 67.0 mmol/L phosphate buffer, pH = 7.4 and mixed homogeneously by rotation for 5.0 s. Subsequently, the differential or cyclic voltammetric curves were recorded to show the electrochemical changes of the reaction system. As well, such interaction was studied by titration of different fenoprofen concentrations in the presence of fixed concentration of BSA.
3. Results and Discussion
3.1. Method Development
Fenoprofen is freely soluble in alcohol and slightly soluble in water causing a limitation to study its interaction with biomolecules such as protein. Macromolecules such as cyclodextrines could use to solve this limitation. In the present work, HPβCD was used to enhance the solubility of fenoprofen due to its high solubility in aqueous medium and low cost. The optimization of HPβCD amount was simply achieved by turbidimetry. An amount of fenoprofen (0.05 mmol/L) was added to 67.0 mmol/L phosphate buffer solution (pH = 7.4) containing varied concentrations of HPβCD in the range of 0.01 - 1.0 mmol/L. The suspensions were shaken under ambient conditions. Consequently, the solubility was followed by measuring the turbidity value indicating that the solubility of fenoprofen increased linearly with increasing concentrations of HPβCD. Solubility of fenoprofen was enhanced from 2.7% with 0.01 mmol/L HPβCD to 100.00% with 0.3 mmol/L HPβCD which was used as an optimal solvent for further experiments. This could be due to the possibility of information of inclusion complex between hydrophobic cavity of HPβCD and fenoprofen as well as a hydrogen bonding between carboxylate group and hydroxyl group on the outer hydrophilic shell of HPβCD (ACA). This concentration of solubilizer is sufficient low to dissolve completely fenoprofen without making any electrochemical interference to the main peak of analyte. Therefore, this inclusion complex could be used for the indirect determination of fenoprofen in aqueous media.
The effect of in-situ mercury film sensor on the determination of fenoprofen was tested by varying the concentration of mercuric ion from 0.3 to 30.0 µmol/L in the presence of 1.0 µmol/L fenoprofen. The effect of thickness of proposed mercury film on the sensitivity and reproducibility of the drug was studied. It was found that the excess mercuric ion concentration (30.0 µmol/L) gave the best thickness of 42.0 nm. Other instrumental parameters were optimized as indicated in the experimental section.
Under the foregoing optimal parameters, the preconcentration of fenoprofen at the proposed sensor was tested. A large response after 60.0 s accumulation time for an essay concentration of 0.02 µmol/L fenoprofen was obtained greater than the direct response (t = 0 s) as indicated in Figure 2. The peak current was increased three fold after 60.0 s accumulation and then saturated after 120.0 s. This indicated that sub-micro concentrations of fenoprofen could be determined using differential pulse stripping voltammetry (DPSV) hyphenated with in-
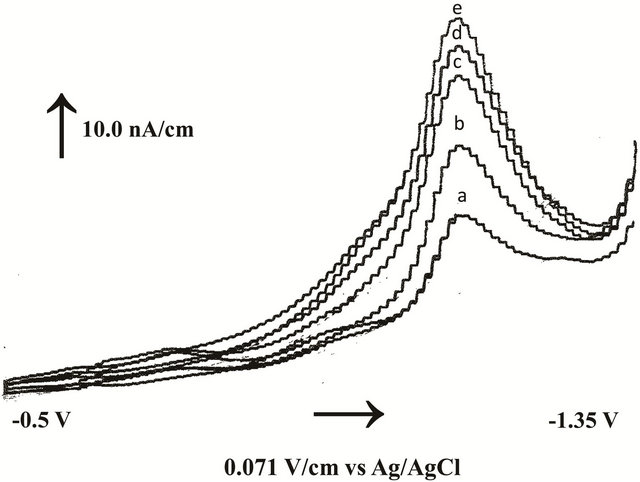
Figure 2. Effect of accumulation time on differential pulse voltammograms of 0.02 µmol/L fenoprofen under physiological conditions: a) 15, b) 30, c) 60, d) 120, and e) 180 s.
situ mercury film sensor. Therefore, the proposed sensor could be applied for high throughput analysis of pharmaceuticals within few minutes.
3.2. Voltammetric Behavior of Fenoprofen at In-Situ Mercury Film Sensor
Voltammetric studies were devoted to study the redox behavior of fenoprofen under complete aqueous conditions in the pH range (2.0 - 12.0) at in-situ mercury film sensor. Strong acidic media (below pH = 2.0) were avoided due to the easy hydrolysis of cyclodextrins that yield a series of mixture of oligosaccharides ranging from an opened ring down to glucose. Cyclic voltammetry of 5.0 µmol/L fenoprofen was scanned from −0.5 to −1.35 V with 100.0 mV/s scanning rate at pH = 2.0. Broad cathodic and anodic peaks were appeared in the first scan and the current sharply decreased with repetitive scans. This could be due to the protonation of fenoprofen in strong acidic medium leading to its good solubility. With increasing pH values, the peak current decreased gradually up to pH = 4.0 with the formation of precipitate. This is due to the weak solubility of fenoprofen after its conversion from protonated form to neutral form. Therefore, we modified the solubility of fenoprofen to be in 0.3 mM HPβCD. The nature of the electrochemical process in the presence of HPβCD as solubiliser was carried out by applying CV at different pH values. In order to increase the adsorbed amount of fenoprofen, an accumulation time of 60.0 s was applied. Fenoprofen molecules exhibited quasi-reversible peaks and then peaks disappeared completely in strong alkaline media. The sensitivity of reductive peak is higher than oxidative peak. All peak potentials were slightly shifted by increasing pH values. The effect of scan rate (10.0 - 200.0 mV/s) was tested (Figure 3). It was observed that the peak currents increased linearly with increasing scan rate (ʋ) giving a slope value
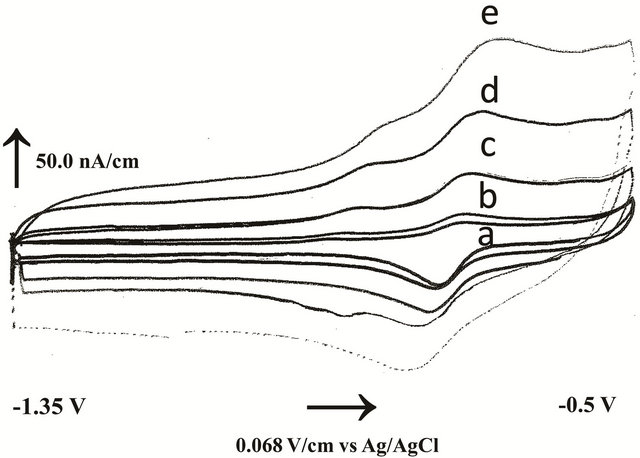
Figure 3. Effect of scan rate on cyclic voltammograms of 5.0 µmol/L fenoprofen after 30 s preconcentration at pH = 7.4: a) 10, b) 20, c) 50, d) 100 and e) 200 mV/s.
ranged between 0.96 to 0.98 µAsmV−1 that tended to unity and the correlation coefficient was varied between 0.998 and 0.999. This behavior indicated the possibility for a charge transfer controlled electrochemical process. The effect of pH on the cathodic peak current of fenoprofen (5.0 µmol/L) was also studied using differential pulse cathodic voltammetry. The study indicated the best sensitivity of fenoprofen was achieved at pH = 7.4 in the presence of 67.0 mmol/L phosphate buffer. Therefore, further experiments were studied under the physiological conditions.
3.3. Method Validation
Well-defined reduction peak was obtained by increasing fenoprofen concentrations in the presence of 67.0 mmol/L phosphate buffer, pH = 7.4. It was found that peak currents increased linearly with increasing their concentrations from 0.02 to 8.0 µmol/L. The linearity equation was found to be: Conc. (nmol/L) = 0.002 Current (µA) + 0.073 with correlation coefficient (r2) = 0.998 and standard deviation (SD) = 0.005. Reproducibility was checked by twenty one measurements within three consecutive days of 2.0 µmol/L fenoprofen under optimal conditions; the standard deviation of 0.073 was obtained. The limit of detection (LOD) was calculated by using the equation LOD = 3.3 SD/a [8] where SD is the standard deviation of control test (e.g. 3.0 µmol//L) and a is the slope of the calibration plot. It was found that 7.0 nmol/L was easily achieved. The limit of quantification (LOQ) considered as the lowest concentration of drug providing a signalto-noise ratio of approximately 10 and found to be 22.0 nmol/L.
The accuracy of the proposed method was determined by applying the optimized analytical approaches with three spiking replicates at three concentration levels covering the linearity range. The obtained mean recoveries of data collected by replicating the procedure within three consecutive days were ranged from 98.3% to 104.2%.
The selectivity was checked by adding the possible interfering ions or organic compounds, which are of great significance in biological matrices up to 200-fold of fenoprofen concentration. The effect of inorganic cations and anions like Na+, K+, Fe3+, Zn2+, Ca2+,  , Cl−,
  and
and  were studied. The presence of cations and anions had no influence on the peak of the investigated compounds. Gelatin and other surfactants like SDS, triton X-100 and CTAB, which can affect on the drug determination had no influence till their concentrations exceed 100-fold fenoprofen. Therefore, the proposed method could be used for the simple, rapid and precise determination of fenoprofen in aqueous media.
3.4. Affinity Voltammetry of Fenoprofen-BSA
After appropriate experimental conditions were established, several practical considerations were investigated. The most effective parameters were the protein’s solubility in the supporting electrolyte, the electrochemical response of protein and the saturation of the drug-protein complex. For the protein’s solubility in phosphate buffer under physiological conditions, there was no problem when working with BSA below the solubility limit of the protein (100.0 µmol/L). The electrochemical response of protein was a second practical item that affects the affinity experiments. It was tested by scanning the cyclic voltammetry of 30.0 µmol/L BSA under optimal conditions. It was found that BSA had a quasi-irreversible electrochemical behavior with potentials far from the potential of drug.
The interaction of BSA macromolecule with fenoprofen was studied by adding several BSA concentrations to definite concentration of the drug and running voltammograms in the cathodic potentials under the optimal conditions as described in the experimental section. Some typical voltammograms obtained with the studied system at different protein concentrations were shown in Figure 4. This figure shows the differential pulse stripping voltammograms of fenoprofen in the absence of BSA (peak II, a) and in the presence of several BSA concentrations ranged from 20.0 - 70.0 µmol/L (peak II, b → h) under optimal physiological conditions. In our experiments, fenoprofen had a reductive peak (II) shifted to more negative potentials by the addition of BSA with greatly decreasing in the current. Peak (I) is due to the reductive peak of BSA. Comparison between peak currents measured without preconcentration (not shown) and peak currents measured after 60.0 s preconcentration time indicated that the affinity complex between fenoprofen and BSA was strongly adsorbed onto in-situ mercury film sensor.
There may be three different explanations for the de-
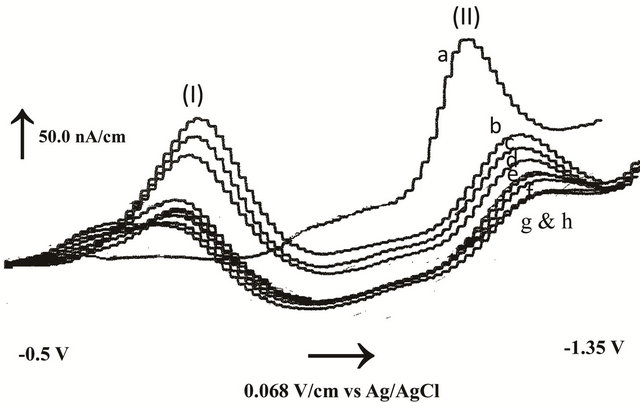
Figure 4. Differential pulse stripping voltammograms after 60 s accumulation time of 0.5 µmol/L fenoprofen (peak II, a) and after the addition of BSA (peak I): b) 10, c) 20, d) 30, e) 40, f) 50, g) 60 and h) 80 µmol/L.
crease of the reductive peak currents after the reaction of fenoprofen with BSA [12]: (1) the competitive adsorption between the fenoprofen and BSA; (2) the formation of an electrochemically active compound and changes of the electrochemical parameters; (3) the formation of electro-inactive complex without the changes of the electrochemical parameters. The shifting in the potential of fenoprofen to more negative values by the addition of BSA could be an evidence for the exclusion of the presence of competitive adsorption on the electrode surface. As well, Li and coworkers [13] have studied the interaction of many electro-active small molecules with biomolecules such as albumin indicating that in lower concentration of protein and shorter accumulation times, the coverage of the electrode surface is only about 10% of the total electrode area, so the competitive adsorption hardly exists. Therefore, the fenoprofen affinity interaction with BSA formed an electro-inactive complex, which could not be reduced on the sensor. In the presence of BSA, the equilibrium concentration of free fenoprofen in solution decreased, which resulted in the decrease of the peak current. This also proved by calculating the formal potential [11] for fenoprofen in the absence of BSA (E˚) and in the presence of BSA (E˚’) using cyclic voltammograms of both at 100.0 mV/s. It was found that the difference between E˚ and E˚’ values are low postulating that the interaction between fenoprofen and BSA is hydrophobic interaction and other weak responses, such as ionic, Van der waals and hydrogen bonding to form an electro-inactive supramolecular complex. Under physiological conditions (i.e. pH = 7.4), amino acid residues in the BSA (isoelectric point pI = 4.7) molecular chains are negatively charged and the fenoprofen species (pKa = 4.5) are negatively charged. So, the possibility of fenoprofen interacting with BSA by electrostatic attraction is excluded.
The stoichiometry of fenoprofen-BSA supramolecular complex was achieved by using molar ratio method. In such experiments, different concentrations of drug were added to a constant concentration of protein. Results of molar ratio graph investigated that fenoprofen interacts with BSA by 1:1 stoichiometry to form supramolecular complex.
3.5. Calculations of Fenoprofen-BSA Binding Constant
As higher concentrations of protein were used, the extent of drug—protein binding increased and a shift in potential was observed. These shifts in potential and their relation to binding affinity made such studies useful in the determination of drug—protein binding constant by affinity voltammetry. The analysis of data for the calculation of binding constants was achieved by using four mathematical plotting models [4]: nonlinear regression, xreciprocal, y-reciprocal and double reciprocal. All these plotting methods have different statistical treatment of data points, which are shown in Table 1. The equations in such table were modified to be suitable with the principles of voltammetry by replacing the mobility ratios with peak potentials. The binding constant of fenoprofenBSA was calculated by the nonlinear regression method using both ACV and ADPSV as cited in Table 2. It was found that the calculated binding constant was 2.8 × 10⁴ L/mol by non-weighted data analysis and 2.9 × 10⁴ L/mol by weighted data analysis using ACV. There was no large difference between weighted and non-weighted data analysis which also is very close to the values obtained using ADSPV. These results were very close to the data analysis by other plotting methods (x-reciprocal, y-reciprocal and double-reciprocal). This could be attrib uted to the sufficient difference in the peak potentials
Table 1. Plotting forms of binding constants (K).
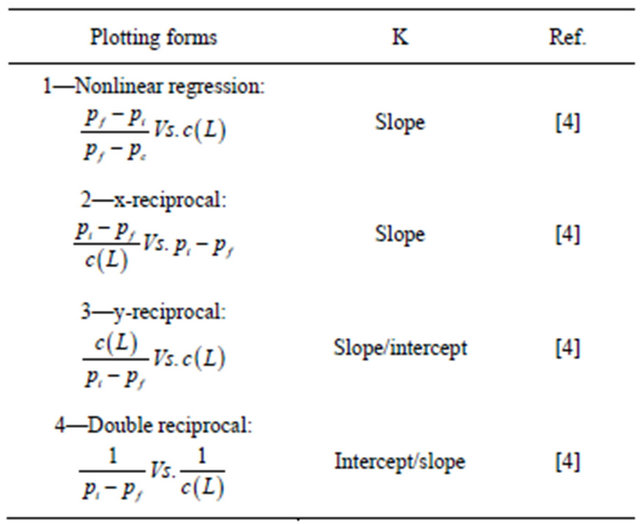
Pf is the peak potential of drug in the absence of protein; Pi is the peak potential of drug at a definite protein concentration; Pc is the peak potential of drug at the saturated protein concentration; c(L) is the micro-molar concentration of protein.
Table 2. Binding constant of fenoprofen-BSA system.
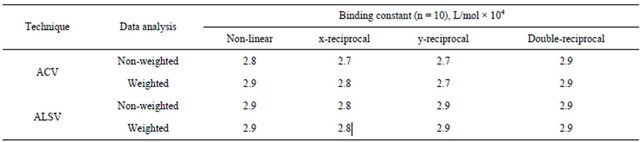
between free fenoprofen and free BSA. It is well observed from the data cited in Table 2 that the non-weighted data is slightly far from weighted data obtained by x-reciprocal, y-reciprocal and double-reciprocal analysis. This could be due to the sometimes observed ill-conditioning of linear regression methods that means their high sensitivity to random error. This lack of fit is possibly due to the numerical effect of extinction followed by division by very small numbers during the course of some of the calculations may play a role. Generally, nonlinear regression should provide the most reliable data for the estimation of binding constants than linear regressions following algebraic manipulation. The high precise and ease of affinity cyclic voltammetry (ACV) and/or affinity differential pulse stripping voltammetry (ADPV) combined with non-linear regression plotting method makes the estimation of binding constants a simple and rapid.
4. Conclusion
A new simple and reliable analytical method as an application of electrochemical in-situ mercury film sensor was used for the determination of binding constants between fenoprofen and BSA. The current paper demonstrated how affinity cyclic voltammetry (ACV) and/or affinity differential pulse voltammetry (ADPV) combined with the non-linear regression method on the proposed electrochemical sensor can be successfully used for the high throughput of drug-protein binding constants.
REFERENCES
- H. Wang, H. Zou and Y. Zhang, “Multi-Site Binding of Fenoprofen to Human Serum Albumin Studied by a Combined Technique of Microdialysis with High Performance Liquid Chromatography,” Biomedical Chromatography, Vol. 12, No. 1, 1998, pp. 4-7. doi.org/10.1002/(SICI)1099-0801(199801/02)12:1<4::AID-BMC707>3.0.CO;2-K
- A.-E. Radi and S. Eissa, “Voltammetric and Spectrophotometric Study on the Complexation of Glibenclamide with β-Cyclodextrin,” Journal of Inclusion Phenomena and Macrocyclic Chemistry, Vol. 68, No. 3-4, 2010, pp. 417. doi.org/10.1007/s10847-010-9801-9
- J. Taraszewska and M. Koźbiał, “Complexation of Ketoconazole by Native and Modified Cyclodextrins,” Journal of Inclusion Phenomena and Macrocyclic Chemistry, Vol. 53, No. 3-4, 2005, pp. 155-161. doi.org/10.1007/s10847-005-2020-0
- D. Abd El-Hady, S. Kuhne, N. Abo El-Maali and H. Wätzig, “Precision in Affinity Capillary Electrophoresis for Drug-Protein Binding Studies,” Journal of Pharmaceutical and Biomedical Analysis, Vol. 52, No. 2, 2010, pp. 232-241. doi.org/10.1016/j.jpba.2009.12.022
- A. Wikstroem and J. Deinum, “Probing the Interaction of Coagulation Factors with Phospholipid Vesicle Surfaces by Surface Plasma Resonance,” Analytical Biochemistry, Vol. 362, No. 1, 2007, pp. 98-107. doi.org/10.1016/j.ab.2006.12.009
- D. Abd El-Hady and H. M. Albishri, “Hyphenated Affinity Capillary Electrophoresis with a High-Sensitivity Cell for the Simultaneous Binding Study of Retinol and Retinoic Acid in Nanomolars with Serum Albumins,” Journal of Chromatogrography B, Vol. 911, No. 1, 2012, pp. 180- 185. doi.org/10.1016/j.jchromb.2012.11.007
- H. W. Gao and W. Q. Xu, “Langmuir Aggregation of Evans Blue on Cetyltrimethylammonium Bromide and on Proteins and Its Application,” Analytica Chimica Acta, Vol. 458, No. 2, 2002, pp. 417-424. doi.org/10.1016/S0003-2670(02)00059-4
- H.-X. Bai, X.-H. Liu, F. Yang and X.-R. Yang, “Interactions of Human Serum Albumin with Phenothiazine Drugs: Insights from Fluorescence Spectroscopic Studies,” Journal of the Chinese Chemical Society, Vol. 56, No. 4, 2009, pp. 696-702.
- Q. E. Cao, Z. T. Ding, R. B. Fang and X. Zhao, “Sensitive and Rapid Method for the Determination of Protein by the Resonance Rayleigh Light-Scattering Technique with Pyrogallol Red,” Analyst, Vol. 126, No. 8, 2001, pp. 1444-1448. doi.org/10.1039/b101827m
- D. Abd El-Hady and A. K. Youssef, “Adsorptive and Affinity Linear Sweep Voltammetry for the Determination of Singulair in Tablets and Its Interaction with Human Serum Albumin,” Journal of Analytical Chemistry, 2013, in press.
- D. Abd El-Hady, M. Abd El-Hamid, M. M. Sliem, V. Andrisano and N. Abo El-Maali, “Adriblastina-ssDNA Interaction with Statistical Analysis,” Talanta, Vol. 66, No. 5, 2005, pp. 1207-1218. doi.org/10.1016/j.talanta.2005.01.025
- W. Sun, K. Jiao, X. Wang and L. Lu, “Electrochemical Studies of the Reaction between Albumin and Amaranth and Its Analytical Application,” Journal of Electroanalytical Chemistry, Vol. 578, No. 1, 2005, pp. 37-43. doi.org/10.1016/j.jelechem.2004.11.042
- F. Qu, Z. W. Zhu and N. Q. Li, “Electrochemical Studies of the Hemin-DNA Interaction,” Electroanalysis, Vol. 12, No. 11, 2000, pp. 831-835. doi.org/10.1002/1521-4109(200007)12
NOTES
*Corresponding author.