American Journal of Analytical Chemistry
Vol.4 No.2(2013), Article ID:27795,14 pages DOI:10.4236/ajac.2013.42009
Development and Validation of LC-MS/MS Method for the Quantification of Chiral Separated R-Bicalutamide in Human Plasma
1Alkem Research Center, Navi Mumbai, India
2Chebrolu Hanumaiah Institute of Pharmaceutical Sciences, Guntur, India
3Vignan Pharmacy College, Guntur, India
4GVK Biosciences, Hyderabad, India
Email: *ntr.nadella@gmail.com
Received November 28, 2012; revised December 30, 2012; accepted January 6, 2013
Keywords: LC-MS/MS; R-Bicalutamide; Topiramate; Validation; Human Plasma
ABSTRACT
A simple, rapid, specific and precise liquid chromatography—tandem mass spectrophotometric (LC-MS/MS) method was developed and validated for the quantification of chiral separated R-bicalutamide from S-bicalutamide, in human plasma. Topiramate (TPM) was used as internal standard, added to plasma sample prior to extraction using t-butyl methyl ether (TBME). Chromatographic separation was achieved on CHIRALPAK AD-RH column (150 mm × 4.6 mm, 5 μm) with acteonitrile: 0.1% formic acid Buffer (50:50 v/v) as an isocratic mobile phase with a flow rate of 1.0 mL∙min−1. Quantitation was performed by transition of 429.0 → 255.0 (m/z) for R-bicalutamide and 338.1 → 77.8 (m/z) for topiramate. The lower limit of quantitation was 20 ng∙mL−1 with a 100 μL plasma sample. The concentrations of eight working standards showed linearity between 20 to 3200 ng∙mL−1 (r2 ≥ 0.9990). Chromatographic separation was achieved within 6 min, compared to the 15 min of previous methods. The average extraction recoveries of 3 quality control concentrations were 98.56% for R-bicalutamide and 92.42% for topiramate. The coefficient of variation was ≤15% for intraand inter-batch assays. Therefore a rapid, specific and sensitive LC-MS/MS method for the quantification of R-bicalutamide in human plasma was developed and validated can be used in the bioequivalence study of this drug.
1. Introduction
Bicalutamide, N-[4-cyano-3(trifluoromethyl) phenyl]-3- [(4-fluorophenyl sulfonyl)]-2-hydroxy-2-methyl propanamide, is an oral, nonsteroidal, anti-androgen agent used for the treatment of prostate cancer. Bicalutamide treatment prevents the activation of the androgen receptor, which inhibits the growth of prostate cancer cells in patients with early, non-metastatic, or advanced prostate cancer [1,2]. Te structure of bicalutamide is sown in the Figure 1. Bicalutamide is a racemate that shows antiandrogenic activity in the R-enantiomer form, but little or no antiandrogenic activity in the S-enantiomer form. Literature survey described several methods for the determination of bicalutamide enantiomers in pharmaceuticals by liquid chromatography with ultraviolet detection (LC-UV) [3-6]. In addition, a previous exploratory study described bicalutamide levels in human plasma with liquid chromatography and tandem mass spectrometry (LC-MS-MS). The use of liquid chromatography with mass spectrometry (LC-MS/MS) is now generally accepted as preferred technique for the determination of small molecules, metabolites and enantiomers in biological samples, since this technique is highly selective and sensitive. In the present work a new LC-MS/MS method for the chiral separation and quantification of R-bicalutamide in human plasma with a short time of analysis (6 min) was developed using topiramate (Figure 2) as internal standard and validated. The proposed method is suitable for comparing the pharmacokinetic profiles of different for-
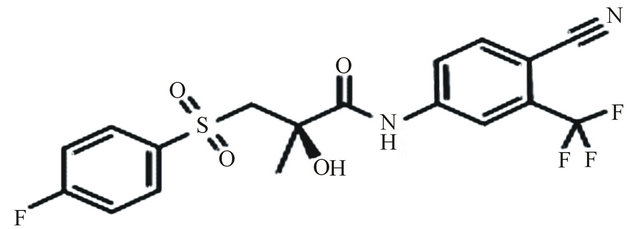
Figure 1. Bicalutamide.
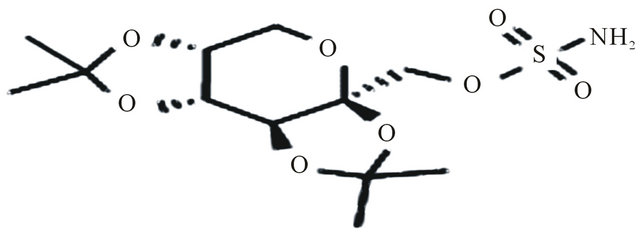
Figure 2. Topiramate.
mulations of bicalutamide.
2. Materials and Methods
2.1. Chemicals and Reagents
R-Bicalutamide, S-Bicalutamide and topiramate (assigned purity 99.9%) were procured from Symed Labs Ltd. Acetonitrile (HPLC grade) was purchased from Merck Millipore India Ltd. Milli-Q water from Millipore water system (Billerica, USA) was used throughout the experiments. Analytical grade formic acid and TertiaryButyl methyl ether (TBME) were obtained from Sigma Aldrich (Bangalore, India). Blank plasma was purchased from Kaveri blood bank (Hyderabad, India).
2.2. Equipment
The following equipments were used: vortex mixer CM- 101 plus (Remi Laboratory Instruments, Mumbai); analytical balance Mettler Toledo® model XS 205 (Greifensee, Switzerland); refrigerated centrifuge 5702 R (Eppendorf India Limited, Chennai); Analysis was carried on Agilent (Santa Clara, CA, USA) 1200 series HPLC coupled with triple quadrupole mass spectrometer (MS/ MS) API 3200 (Applied Biosystems/AB Sciex).
2.3. Chromatographic and Mass Spectrometry Conditions
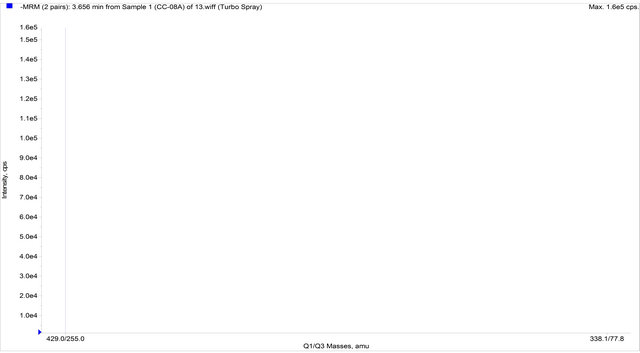
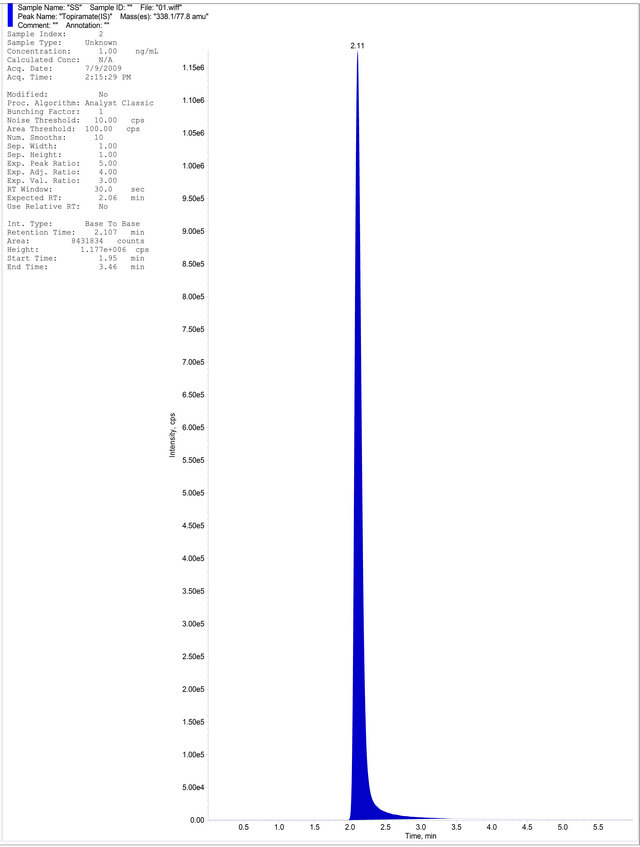
Samples were separated on a CHIRALPAK AD-RH column (150 × 4.6 mm, 5 μm) Daicel Chiral Technologies (India) Pvt. Ltd.). The column temperature was set at 40˚C. The mobile phase was acetonitrile: 0.1% formic acid in water (50:50 v/v) as an isocratic mobile phase with a flow rate of 1.0 mL∙min−1 and total run time was 6 min. Analysis was performed in negative electro spray ionization mode. The MS/MS detection was conducted by multiple reaction monitoring at a transition of 429.0 → 255.0 (m/z) for R-bicalutamide and 338.1 → 77.8 (m/z) for the IS (Figures 3 (a) and (b)). For both R-bicalutamide and the IS, the source-dependent parameters were as follows: Gas 1 (nebulizer gas): 40psig; Gas 2 (heater gas): 50 psig; ion spray voltage: 4500 V; turbo heater temperature: 400˚C; interface heater: On; entrance potential: 10V; collision activation dissociation gas: 6 psig. The optimized values for compound-dependent parameters were set as follows: declustering potential, collision energy, and cell exit potential were set to: 75, 22, and 10 V for R-bicalutamide and 90, 30, and 10 V for the IS respectively. Quadrupoles 1 and 3 were maintained at unit mass resolution and the dwell time was set at 200 ms.
2.4. Standard and Quality Control (QC) Sample Preparation
R-bicalutamide, S-bicalutamide and the IS stock solutions were prepared in acteonitrile to a final concentration of 1 mg∙mL−1. The appropriate dilutions with acetonitrile: Water (50:50 v/v) were prepared to produce 8 working standards of 64, 52, 38, 26, 18, 8, 0.8 and 0.4 μg∙mL−1 of R-bicalutamide, 25 μg∙mL−1 S-bicalutamide sample prepared for adding to aqueous standard sample to find out the separation of R-bicalutamide and S-bicalutamide, 5 μg∙mL−1 sample of IS. Calibration standards ranging from 20 to 3200 ng∙mL−1 were prepared by spiking 50 μL of the working standards into 1 mL of blank plasma. The QC samples were prepared with a different Bicalutamide Stock solution and diluted in blank plasma. The QC Bicalutamide concentrations included 20 ng mL-1 for lower limit of quantitation (LLOQ QC), 60 ng∙mL−1 for low quality control (LQC), 840 ng∙mL−1 for Middle quality control (MQC), 2400 ng∙mL−1 for High quality control (HQC), and 4800 ng∙mL−1 for Dilution Integrity quality control (DIQC). All spiked plasma samples were stored at −70˚C.
2.5. Sample Preparation
Aliquots of frozen plasma samples (100 mL) were thawed at room temperature and thoroughly vortexes prior to extraction. The calibration curve consists of a blank sample (matrix sample processed without IS), a zero sample (matrix sample processed with IS), and eight nonzero samples covering the expected range, including LLOQ. To each calibration sample and quality control sample, 20 μL of IS dilution (5 μg∙mL−1) was added followed by 1.5 mL of Tertiary-butyl methyl ether (TBME) was added as an extraction solvent in a centrifuge tube. They were vortex well, and centrifuged at 4000 rpm for 5 min at 5˚C. The supernatant organic layer was transferred to a polyethylene tube and evaporated in nitrogen evaporator at 40˚C for 15 min. Then the residue was reconstituted with 500 µL of mobile phase and vortex for 1 min from this 5 μL was injected into LC-MS/MS.
2.6. Data Collection and Integration
The data were gathered and processed with Analyst version 1.5 data collection and integration software on a Microsoft windows compatible computer.
2.7. Bioanalytical Method Validation
ICH guidelines and USFDA guidelines were followed for
 (a)
(a)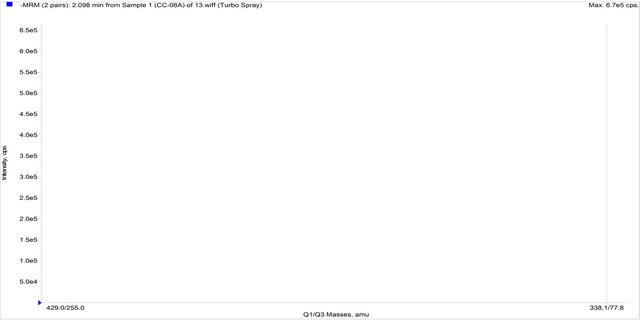 (b)
(b)
Figure 3. (a) MRM spectra of bicalutamide; (b) MRM spectra of topiramate.
method validation [7,8]. Assay performance was evaluated through determination of specificity, linearity, precision, accuracy, recovery and stabilities. Specificity was investigated by analysing six drug-free volunteer plasma samples for the interference of endogenous compounds. The standard curve was obtained through analysis of calibration plot of peak area ratio (analyte to IS) versus the corresponding drug concentrations. Linearity of the standard curve was evaluated using least-squares linear regression analysis with weighting of 1/x2. Intraand inter-day precisions were determined by repeated analysis of quality control plasma samples on the same day and on different days. Six replicates of each of the three quality control standards and the lowest calibrator were analysed in a batch to establish the method’s precision (% relative standard deviation was calculated). Recovery was evaluated by comparing the observed concentration with the true value of spiked controls. The recoveries of R-Bicalutamide and topiramate were determined by comparing the response of quality control plasma samples with the response of identical standards prepared in the mobile phase which did not undergo sample pre-treatment. The recovery was evaluated at all the three quality control concentration levels. Stability of R-Bicalutamide in plasma samples stored at −70˚C, in plasma samples after freeze-thaw cycles and in pre-treated plasma samples(short term) was evaluated. Stability of R-Bicalutamide and topiramate were also evaluated in respective stock solution and in mobile phase in the processed samples. Higher and lower quality control standards were used for evaluating the stability of spiked plasma samples.
3. Result and Discussion
The main aim of this work was to develop a rapid, precise, selective and sensitive LC-MS/MS method for the quantification of chiral separated R-bicalutamide from S-bicalutamide, in human plasma. Topiramate was used as internal standard. Chromatographic separation was achieved on Chiralpak AD-RH column with acteonitrile: 0.1% formic acid in water (50:50 v/v) as an isocratic mobile phase with a flow rate of 1.0 mL∙min−1. Quantitation was performed by transition of 429.0 → 255.0 (m/z) for R-bicalutamide and 338.1 → 77.8 (m/z) for topiramate.
3.1. Chromatography
Representative chromatograms of Aqueous Standard, drug free blank plasma, blank plasma with topiramate and LLOQ QC sample are given in Figures 4 (a)-(d) respectively.
3.2. Selectivity and Sensitivity
Six different lots of plasma were harvested under controlled conditions, extracted and analyzed using the developed method. No interferences were observed at the retention times of R-Bicalutamide and topiramate. Samples were compared with those obtained from an extract of a previously spiked plasma sample at LLOQ containing R-Bicalutamide and topiramate. Representative chromatograms of the blank human plasma and blank human plasma spiked with R-Bicalutamide and topiramate are given in Figures 4 (b) and (d) respectively. The effect of potentially interfering drugs (PID) (caffeine, nimesulide, paracetamol, ibuprofen and aspirin) on R-Bicalutamide analysis was performed by spiking PIDs at their approximately Cmax concentration in the MQC sample in triplicate. Samples were prepared by spiking 25 μL of each interfering drug in the MQC containing R-Bicalutamide. Similarly blank samples also prepared by taking 100 μL of blank plasma and 25 μL of potentially interfering drug. The samples were quantified against calibration curve. The back calculated concentrations of MQC sample spiked with PID were found to be within +15% of the actual concentration of the MQC sample. Hence the above mentioned PIDs have no effect on the R-Bicalutamide analysis. The lowest limit of quantification for R-Bicalutamide was set at the concentration of the LLOQ QC 20.000 ng∙mL−1. The precision and accuracy for RBicalutamide at this concentration was found to be 5.21% and 98.82% respectively.
3.3. Goodness of Fit
The data of four precision and accuracy batches was subjected to goodness of fit analysis after taking the back calculated concentrations of calibration standards meeting the acceptance criteria by using 1/x and 1/x2 weighing. After performing the goodness of fit, 1/x2 was found to be the best fit for regression.
3.4. Linearity
Linear calibration curves were plotted by using the partial least square method in which least square regression of quantities versus peak area ratio R-bicalutamide to IS with a weighting factor (1/x2) was utilized. R-bicalutamide was linear in the range of 20 to 3200 ng∙mL−1 with a coefficient of determination greater than 0.99 (Table 1).
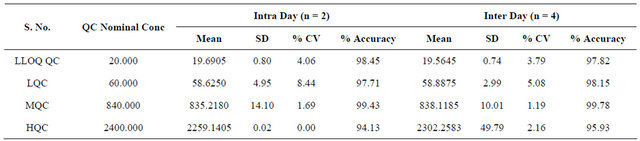
3.5. Precision and Accuracy
The precision of the assay was measured by the percent coefficient of variation over the concentration range of LLOQC, LQC, MQC and HQC samples respectively during the course of validation. The intraday and interday precisions were less than 10.00% for each QC level of R-bicalutamide. The accuracy, determined for QC samples, was within 10.00% for each QC level. The results obtained are given in Table 2.
3.6. Recovery
Prepared 6 sets of recovery comparison samples by spiking 5 μL dilution of quality control samples (LQC, MQC, HQC) of R-bicalutamide, 20 μL of topiramate and 457 μL of mobile phase, representing 100% extraction and injected. The recovery comparison samples of R-bicalutamide were compared against extracted samples of LQC, MQC and HQC. The mean overall recovery of R-bicalutamide was 98.56% with precision of 3.43%. The mean recovery of internal standard was 92.42%.
Table 1. Results of linearity.
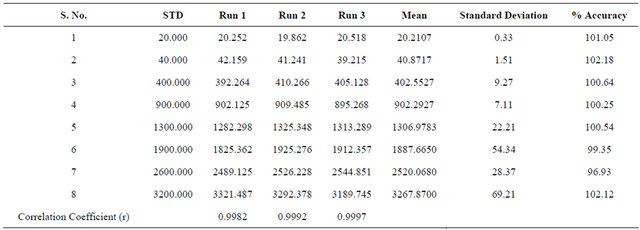
Table 2. Accuracy and precision of the determination.
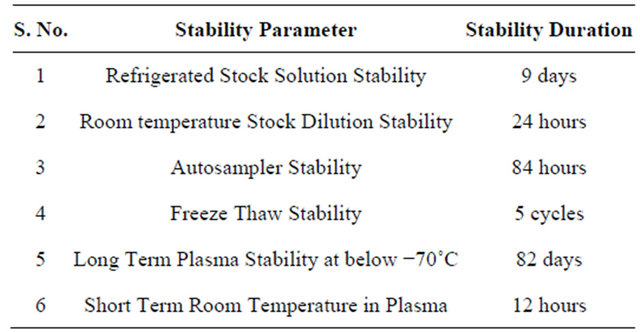
3.7. Stabilities
3.7.1. Refrigerated Stock Solution Stability
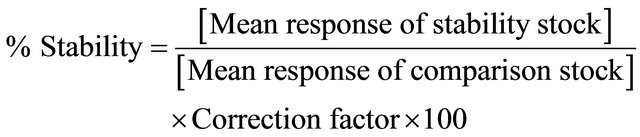
Refrigerated stock solution stability was carried out for 9 days by making six injections of stability standard stock solution and the fresh standard (comparison stock) stock solution of R-bicalutamide and topiramate. The response of stability sample was corrected by multiplying with correction factor. The % change for R-bicalutamide was 4.62 and % stability was 95.38%. The refrigerated stability of topiramate was carried out for 9 days and the % change was 2.35% and % stability was 102.35%.
3.7.2. Correction Factor Was Calculated as Follows
Correction factor = [Corrected concentration of comparison (fresh) standard stock solution]/[Corrected concentration of stability standard stock solution].
Note: Corrected concentration: Concentration corrected using potency, actual amount weighed and molecular weight of the compound.
3.7.3. Room Temperature Stock Dilution Stability
Room temperature stock dilution stability of R-bicalutamide and topiramate was carried out for 24 hours by injecting each six replicates of stock dilutions of stability standard stock solution and the fresh standard (comparison stock) stock solution. The response of stability sample was corrected by multiplying with correction factor. The standard stock solution % stability for R-bicalutamide was 97.82%, and for topiramate was 99.24%.
3.7.4. Stability Studies
Six sets of QC samples at LQC and HQC were processed and placed in the auto sampler. These samples were injected after a period of around 84 hours and were quantified against freshly spiked calibration curves standards. The samples were found to be stable over a period of 84 hours. The percentage nominal at around 84 hours ranged from 97.39% (HQC) to 101.54% (LQC) and precision ranged from 1.84% (LQC) to 3.82% (HQC) respectively.
The stability in human plasma was determined for five freeze-thaw cycles. Six injections of LQC and HQC were analyzed after undergoing five freeze thaw cycles. The freeze-thaw quality control samples were quantified against the freshly spiked calibration curve standards. The percent nominal ranged from 99.52% (HQC) to 102.42% (LQC) and precision ranged from 2.29% (HQC) to 3.96% (LQC) respectively.
The stability of R-bicalutamide for the storage of plasma samples below −70˚C was studied for 82 days by
 (a)
(a)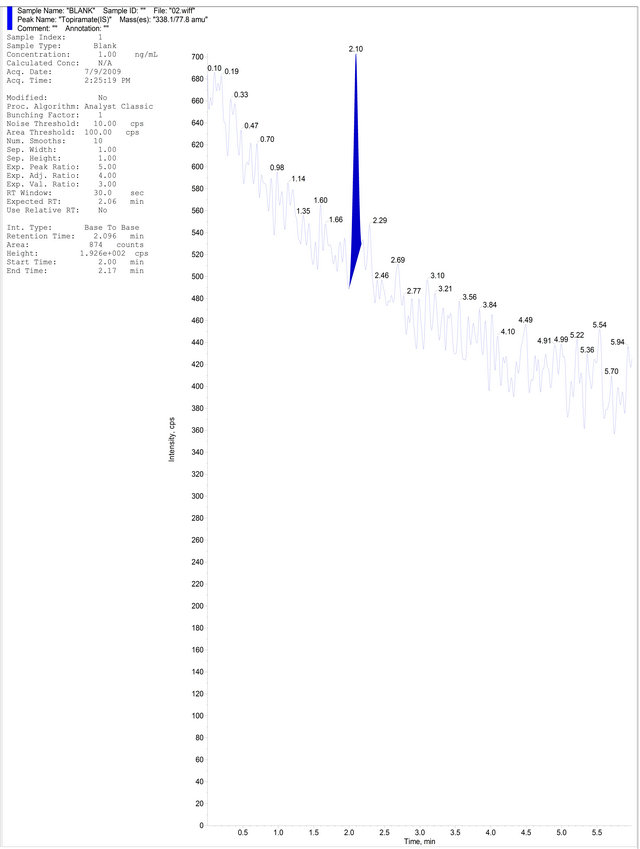 (b)
(b)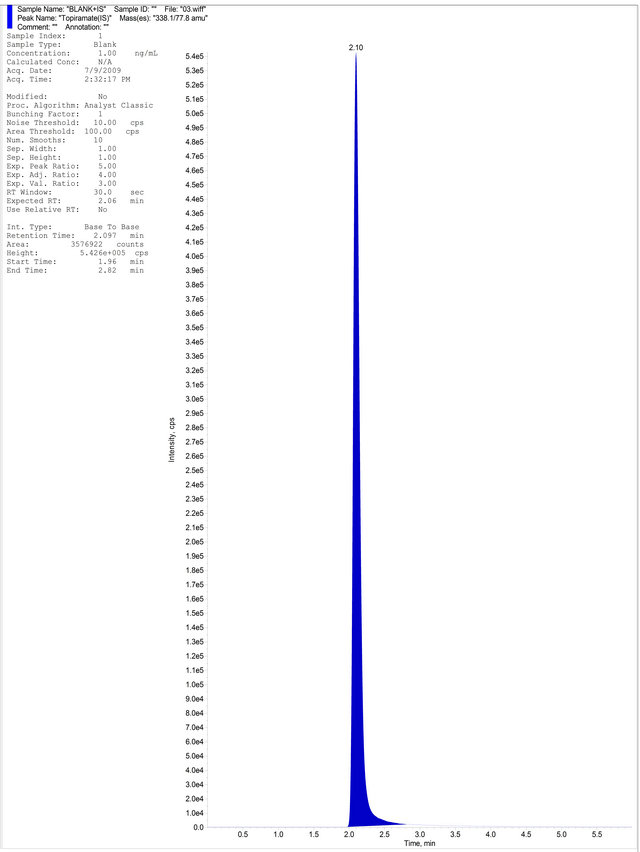 (c)
(c)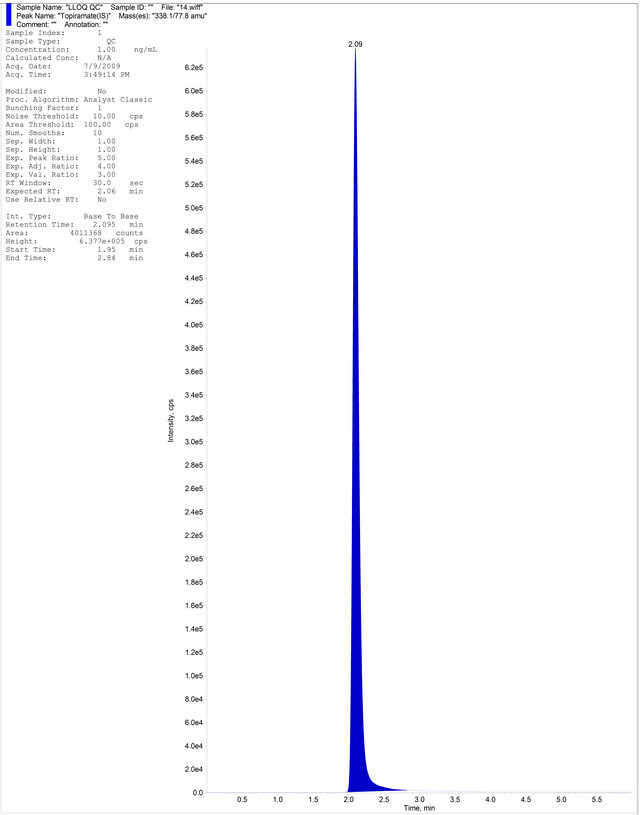 (d)
(d)
Figure 4. (a) Aqueous Standard with Separated R-Bicalutamide and S-Bicalutamide with IS; (b) Drug free blank plasma; (c) Blank Plasma with IS; (d) LLOQ Sample with IS.
quantifying six sets each of LQC and HQC against the freshly spiked standards. The % nominal ranged from 98.28% (LQC) to 101.78% (HQC) and the precision ranged from 1.43% (HQC) to 3.52% (LQC) respectively.
Short-term room temperature stability in plasma was determined around 12 hours, using six sets each of LQC and HQC. The quality control samples were quantified against the freshly spiked calibration curve standards. R-bicalutamide was found to be stable around 12 hours. The % nominal ranged from 98.72% (HQC) to 100.48% (LQC) and the precision ranged from 1.75% (HQC) to 3.26% (LQC) respectively.
All the above stability studies results were summarized in Table 3.
3.8. Application: Pharmacokinetic Study
The proposed validated bioanalytical method was successfully applied to determine R-bicalutamide concentration in plasma samples for pharmacokinetic study in healthy male volunteer, who were administered orally a tablet containing 50 mg bicalutamide in a fasted state. Venous blood samples collected into heparinized tubes and blood samples were centrifuged (4000 rpm for 10 min). Plasma was separated and stored at −70˚C until assay. The maximum plasma concentration was 915.250 ng∙mL−1 which occurred at about 30 hours post dosing.
4. Conclusion
The objective of this work was to develop a simple, cost effective rugged and a high throughput method for estimation of R-bicalutamide in human plasma. The method consists of a simple sample pretreatment by liquid-liquid
Table 3. Summarized results of stability studies.
extraction to give consistent and reproducible recoveries of R-bicalutamide. The run time is 6 minutes suggests high throughput of the proposed method. This was considerably less compared to the reported procedure [3], which helps high throughput sample analysis.
REFERENCES
- B. J. Furr, “The Development of Casodex (Bicalutamide): Preclinical Studies,” European Urology, Vol. 29, Suppl. l 2, 1996, pp. 83-95.
- S. Lee, Y. J. Chung, B. H. Kim, J. H. Shim and S. H. Yoon, “Comparative Pharmacokinetic Evaluation of Two Formulations of Bicalutamide 50-mg Tablets: An OpenLabel, Randomized-Sequence, Single-Dose, Two-Period Crossover Study in Healthy Korean Male Volunteers,” Clinical Therapeutics, Vol. 31, No. 12, 2009, pp. 3000- 3008. doi:10.1016/j.clinthera.2009.12.004
- R. NageswaraRao, A. NarasaRaju and D. Nagaraju, “An Improved and Validated LC Method for Resolution of Bicalutamide Enantiomers Using Amylase Tris-(3,5-Imethylphenylcarbamate) as a Chiral Stationary Phase,” Journal of Pharmaceutical and Biomedical Analysis, Vol. 42, No. 3, 2006, pp. 347-353. doi:10.1016/j.jpba.2006.04.014
- D. McKillop, G. W. Boyle, I. D. Cockshott, D. C. Jones, P. J. Phillips, et al. “Metabolism and Enantioselective Pharmacokinetics of Casodex in Man,” Xenobiotica, Vol. 23, No. 11, 1993, pp. 1241-1253. doi:10.3109/00498259309059435
- F. Boccardo, A. Rubagotti, G. Conti, D. Potenzoni, A. Manganelli and D. Del Monaco, “Exploratory Study of Drug Plasma Levels during Bicalutamide 150 mg Therapy Co-Administered with Tamoxifen or Anastrozole for Prophylaxis of Gynecomastia and Breast Pain in Men with Prostate Cancer,” Cancer Chemotherapy and Pharmacology, Vol. 56, No. 4, 2005, pp. 415-420. doi:10.1007/s00280-005-1016-1
- US Food and Drug Administration, “Guidance for Industry. Bioavailability and Bioequivalence Studies for Orally Administered Drug Products-General Considerations,” 2009. www.fda.gov/downloads/Drugs/.../Guidances/ucm070124
- “ICH Text on Validation of Analytical Procedures, Q2A (R1),” International Conference on Harmonization, IFPMA, Geneva, 1994.
- Anonymous, “Guide for Industry, Bioanalytical Method Validation,” US Department of Health and Human Services, Food and Drug Administration (FDA), Silver Spring, 2001.
NOTES
*Corresponding author.