Journal of Geoscience and Environment Protection
Vol.06 No.07(2018), Article ID:85818,14 pages
10.4236/gep.2018.67001
Risk Assessment and Simulation on Storm Flood of the 100-Year Return Period in Hunhe River Basin
Mingyan Liu1,2, Fenghua Sun1*, Yiling Hou2, Xiaoyu Zhou2, Chunyu Zhao2, Xue Yi2
1Institute of Atmospheric Environment, China Meteorological Administration, Shenyang, China
2Regional Climate Center of Shenyang, Shenyang, China

Copyright © 2018 by authors and Scientific Research Publishing Inc.
This work is licensed under the Creative Commons Attribution International License (CC BY 4.0).
http://creativecommons.org/licenses/by/4.0/


Received: January 18, 2018; Accepted: July 2, 2018; Published: July 5, 2018
ABSTRACT
Based on the meteorological and geographic information data, with statistical method and the FloodArea model, the extreme daily rainfall of the 100-year return period in Hunhe River basin was established, through the simulation of rainstorm and flood disaster, characteristics of flood depth in warning spot Cangshi village in the upstream of the river were analysed, and possible effect on community economy was also evaluated. Results showed that, the precipitation of 100-year return period occurred, the flood depth has been below 1.0 meter in the most areas of Hunhe River basin, the depth was between 1.0 meter and 2.5 meters in the part areas of Hunhe River basin, and the flood depth has been exceed 2.5 meters in a small part of Hunhe River basin. After the beginning of precipitation, the flood was concentrated in the upper reaches of the river. With the accumulation of precipitation and the passage of time, the flood pools into midstream and downstream. Precipitation lasted for 24 hours, the warning spot was flooded in the beginning of precipitation. With the accumulation of precipitation, water level of the river increases gradually. The depth of warning spot has passed 1.0 meter at the 07 time of the whole process, and the maximum value of flood depth at warning spot was 1.083 meters that occurred at the 19 time. The flood depth of warning spot decreased gradually after the precipitation stopping, and the depth has been below 0.2 meters, the flood of upstream ended. Up to the end of the upstream flood process, in the whole river, about one million five hundred and sixty thousand people were affected by flooding, and thirty-eight billion and two hundred million RMB of gross domestic product were lost, in addition, dry land and paddy field were affected greatly, but woodland and grassland were less affected.
Keywords:
FloodArea, Flood Simulation, Return Period, Risk Assessment, Hunhe River Basin

1. Introduction
The Hunhe River is a tributary of the left bank of the Liao River and is one of the major rivers in Liaoning Province [1] . Its geographical location is 112˚20'E - 125˚15'E, 41˚00'N - 42˚15'N, river length is 415.4 km. It covers an area of 11,481 km2 and originates from 11 counties and cities in Shenyang, Fushun, Liaoyang and Anshan [2] . The Hunhe River Basin is a temperate continental monsoon climate zone. Affected by the southeast monsoon, heavy rainstorms in the basin occur in July-August, especially in the period from late July to early August. At the same time, the inter-annual changes in precipitation are large, and a heavy rain process can last for about 3 days [3] . The Hun River is a flood-prone river, with 10 major floods occurring in the past 100 years and the largest flood recorded since 1995 in the Hunhe River Basin.
Heavy rains and their induced floods, mudslides, landslides and other derivative disasters pose a great threat to the transportation of workers and peasants and people’s lives and property [4] . Under the urgent need of sustainable economic development, it is necessary to fully understand and appropriately assess the storm floods and its harm. Shen Cheng et al. [5] introduced the disaster model to make a comprehensive assessment of 253 heavy rainstorms and floods in Jiangsu Province from 2004 to 2013, and provided the criteria for the classification of disaster levels. Rong Yan-shu et al. [6] discussed the temporal and spatial variation of extreme precipitation in the Huaihe River Basin, and gave the spatial distribution of extreme precipitation at different time scales based on the generalized extremum theory. Through comparative analysis and real-time test, Lu Yanyu et al. [7] discussed the similarities and differences between statistical methods and hydrological models in flood-critical rainfall analysis of small and medium river basins, and provided reference for carrying out risk early-warning services. Zhang Zhengtao et al. [8] used different types of distribution functions to fit the maximum daily precipitation in the Huaihe River Basin, and discussed the risk changes of rainstorm and flood disasters in the Huaihe River basin under different recurrence periods. In recent years, with the development of GIS technology, the FloodArea hydrodynamic submergence model combined with GIS has been widely used in the storm flood risk assessment. The FloodArea hydrodynamic model can simulate the flooding of floods with different recurrence periods and obtain raster data with attributes such as submerged area and submerged depth [9] . The simulation results can provide technical support for the study of storm flood risk rainfall and evaluation of flood inundation disaster [10] . Xie et al. [11] used FloodArea model to simulate flood and flood caused by a typical heavy rainfall process in the Datong River Basin. Civilization Chapter et al. [10] based on the data from the field investigation, aiming at the flood inundation basin without hydrologic data and long-sequence precipitation data in Fujian Province, flood risk rainfall calculation was carried out using FloodArea inundation model.
In view of the above, it can be seen that many of the above research methods are inadequate. Due to the local character of the shady torrent basin, the terrain features of each mountain flood ditch have their own particularities. It is difficult to find similar drainage basins for substitution. Due to the accuracy and reliability of survey data Most of the above methods are mostly based on rainfall, disasters or rainfall disasters, and have less consideration for the hydrological process. The FloodArea hydrodynamic model used in this paper is more suitable for this situation. This paper aims to establish the Annual Maximum (AM) based on the observed data in the Hunhe River Basin and to fit this distribution by four kinds of 47 kinds of distribution functions (such as Wakeby, Gemma, Gumbel, Frechet, etc.) Precipitation series, get the maximum daily precipitation intensity in the once-in-a-hundred-year recurrence period. FloodArea hydrodynamic model is used to simulate the flood scenarios that may occur in the once-in-a-hundred-year precipitation. The evolved characteristics of the submerged depth of a flood-prone site in the upper reaches of the river are analyzed to evaluate the possible impact of the once-in-a-century storm flood on the socio- to lay the foundation for a scientific, systematic and quantitative flood disaster assessment and provide a scientific basis for flood control, disaster reduction and disaster relief.
The Hun River basin is adjacent to Prince Edward River in the south and Qinghe River and Chaihe River in the north and Longgang Mountain Range in the east to the boundary between the Yalu River and Songhua River. The main tributaries of the right bank have a chapter Party River, Puhe, the left bank of Suzi River, Dongzhou River. Basin is a temperate continental monsoon climate, cold and dry in winter, hot and humid in summer and rainy. There are 11 hydrological stations with long-term water level and flow observation data in the basin. There are 8 large and medium-sized reservoirs with a total storage capacity of 2.467 billion cubic meters. There are four weather stations in the basin with long sequence observation data, namely Qingyuan Station, Xinbin Station, Fushun Station and Shenyang Station (Figure 1).
2. Data and Methods
2.1. Data Sources and Processing
The Liaoning Meteorological Information Center provided the daily precipitation data of Qingyuan Station, Fushun Station, Xinbin Station and Shenyang Station in the Hunhe River Basin from January 1, 1961 to December 31, 2015. The unit is mm. The daily average precipitation series, the surface rainfall series, are calculated by the arithmetic average method, and the annual maximum daily
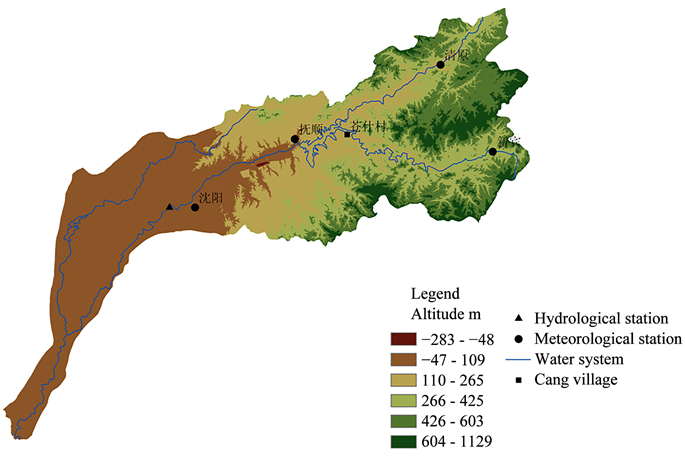
Figure 1. Survey, landform and stations distribution of Hunhe River Basin.
precipitation is extracted by the annual maximum method to form the AM sequence. The DEM data is SRTM data at a resolution of 30 m. Data on river system and land use types from Grade 1 to 5 in Liaoning Province are from the National Climate Center Based on the DEM data and the distribution data of three levels of water system in Liaoning Province, GIS hydrological analysis tools were used to extract the elevation of the Hunhe River Basin (Figure 1). Hunhe River Basin population and GDP distribution data from the Chinese Academy of Sciences Institute of Geographic Sciences and Resources constructed by the Chinese km grid population distribution data set and GDP distribution data set.
2.2. Research Methods
2.2.1. Probability Distribution Model and Recurrence Calculation
The template is used to format your paper and style the text. All margins, column widths, line spaces, and text fonts are prescribed; please do not alter them. You may note peculiarities. For example, the head margin in this template measures proportionately more than is customary. This measurement and others are deliberate, using specifications that anticipate your paper as one part of the entire journals, and not as an independent document. Please do not revise any of the current designations.
Reproductive period can reflect the degree of flood caused by precipitation in probability [12] . It refers to the average time interval of repeated occurrence of extreme precipitation events over a period of time, usually expressed in terms of number of years. Based on the AM sequence from 1961 to 2015 in the Hunhe River Basin, 47 distribution functions were used to fit the annual maximum precipitation series [13] . The distribution functions are divided into four categories: 8 kinds of Bounded distribution, 11 kinds of Unbounded distribution, 23 kinds of Non-negative distribution and generalized distribution function Advanced distribution) 5 kinds. The maximum likelihood method was used to estimate the optimal parameters of the probability distribution model, and the Kolmogorov-Smirno (KS) test was used to test the goodness of fit. The distribution of the samples was compared with the population. The distribution function of the degree of fit [14] , to determine the ranking of the first distribution function and the function of the calculated precipitation results [15] .
2.2.2. Introduction to FloodArea Model
FloodArea is a hydrodynamic submerged model developed by Geomer AG in Germany. The calculation is based on the hydrodynamic method [16] . It operates as a module in ArGIS and uses the spatial analysis function to fully integrate with the ArGIS desktop graphical user interface. It simulates the evolution of floods in grid units. The Manning-Stricker formula is used to calculate the flood flow rate between each grid unit and the surrounding eight units. The submerged depth of water flow is defined as the difference between submerged water level elevation and ground elevation, and the direction of water flow Decided by the terrain aspect. The “FloodArea” runtime and its corresponding submergence range and depth are stored in a grid format that is intuitive and easy to query [17] . Based on the DEM and precipitation data in the Hunhe River Basin, this study used model rainstorm model to simulate the submergence caused by heavy rainfall in the Hunhe River basin Scenario simulation, according to the process of submergence of the river basin, the trend of submerged depth change is calculated, and the social and economic impact of submergence on the submerged field is evaluated.
3. Result Analysis
3.1. Hourly Precipitation Sequence Established
The fitting analysis of the AM sequences in Hunhe River Basin by using different probability distribution functions shows that the Wake by function can well fit the probability distribution of annual maximum precipitation series in Hunhe River Basin. The maximum daily precipitation corresponding to different recurrence periods in the Hunhe River basin was calculated by fitting the optimal function (Table 1). The daily mean precipitation intensity in the once-in-a-lifetime return period of the Hunhe River basin was 186.0 mm, and was evenly distributed on the first day in 24 hours, the hourly precipitation sequence was obtained, with an hourly precipitation of 7.75 mm.
3.2. Surface Runoff Coefficient Calculation
The SCS model developed by the USDA Soil Conservation Service was used to determine the surface runoff coefficient, which can reflect the effect of underlying surface conditions on the runoff process (Figure 2). This method is chosen because it has the advantages of simple structure, less required parameters and easy access to data, which can reflect the effects of soil types, land use patterns

Table 1. The maximum daily precipitation of different return periods in Hunhe River basin.
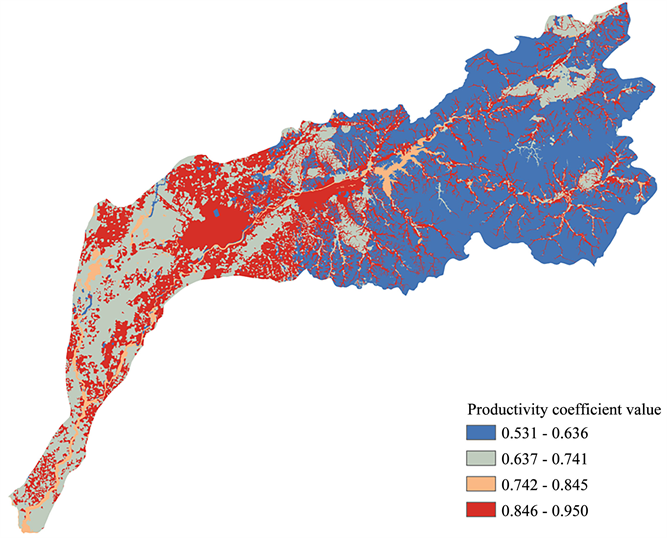
Figure 2. Runoff coefficient value in Hunhe River basin.
and the previous soil moisture content on rainfall runoff, and can effectively calculate the Hun River catchment Water area runoff [18] . The model is calculated as:
(1)
(2)
(3)
where, Q is the output flow, P is the precipitation, S is the potential infiltration, K is the dimensionless coefficient of flow coefficient. Curve Number (CN) reflects the characteristics of the watershed before rainfall. It varies with the state of soil moisture, slope, land cover, land use status and soil type in the early stage of the river basin, and can be found according to Chapter 4 of the National Engineering Handbook CN values corresponding to land-use patterns and soil texture [19] , and the larger the CN value, the more prone to runoff.
3.3. Surface Water Roughness Calculation
Different land cover forms can intercept, store and filter surface runoff and form different resistivities for flood evolution, which is largely quantified by Mannin roughness [20] . Therefore, when simulating flood flood in the Hunhe River Basin, a comprehensive parameter that can reflect the shape irregularity and roughness of the river channel or gutter wall should also be added to the model. Based on the data of land use types in Hunhe River Basin, this study determined the roughness coefficient of Hunhe River Basin according to the related literature [21] based on the five types of residential land, water body, dry land, irrigated land and forest land (Figure 3). Surface type with larger roughness coefficient has larger water permeability.
3.4. FloodArea Flooding Results Analysis
According to the elevation data of the Hunhe River Basin, the surface runoff coefficient, the surface water roughness and the hourly precipitation data corresponding to the once-in-a-century heavy rainfall, the “FloodArea” submerged rainfall storm model was used to simulate the Hunhui Basin once in a year heavy rainfall may trigger watershed inundation scenario simulation. Cangshi Village, Fushun County, Fushun County was selected as hidden danger point (Table 2). The hidden danger point is located in the upper reaches of Hun River with concentrated population, developed agriculture and rich natural resources. There are several factories in the village with good economic returns. When the precipitation in the basin submerged, located in the upper reaches of Hun River Cang Shishui flood arrived earlier, with some representation. Hidden point of the selected representative, is conducive to the determination of warning points, warning points and hidden points consistent.
When heavy rains occur in the Hunhe River basin once in a century, submerged depths are below 1.0 m in most areas of the Hunjiang River basin, submerged depths reach 1.0 - 2.5 m in some areas and submerged depths exceed 2.5 m in some areas. The entire rainfall lasted for 24 hours from the beginning to the end, and the sub-flood village located in the upper reaches was submerged at the beginning of the precipitation. After the precipitation stopped, the submergence depth of the Shishushi village gradually decreased (Figure 4).
Submerged by “FloodArea” simulation results (Figure 5). At the beginning of precipitation, the submergence was mainly concentrated in the upper reaches of the river. The submergence depth of Qingshe village rapidly increased with the accumulation of precipitation. At the 02nd, the depth of submergence of Qingshe village reached about 0.2 meters, had not passed a normal human ankle, on the 07th began to submerge the depth of more than 1.0 meters. With the increase of rainfall and the passage of time, the depth of flood inundation deepened and the inundation range gradually increased. The flooding in the river gradually spread to the middle and lower reaches and the depth of submergence deepened slow. At 19:00 Canshun village depth of inundation maximum, submerged depth of 1.083 meters. On the 25th, the precipitation process is over and the floodwater continues to flow downstream. The upper reaches of the Hun River have the features of high elevation, large drop, rapid discharge under rainfall, increased depth and extent of submergence in the lower reaches, rapid decline of submergence depth in the upstream of Qushushi village, and depth of submergence of only 0.87 meters at the 26th hour. On the 38th, when the flood was piled up in the downstream, the submerged depth of the sub-village was less than 0.2 meters, and the submergence in the upstream was basically completed.
Table 2. Description of warning spots in Hunhe River basin.
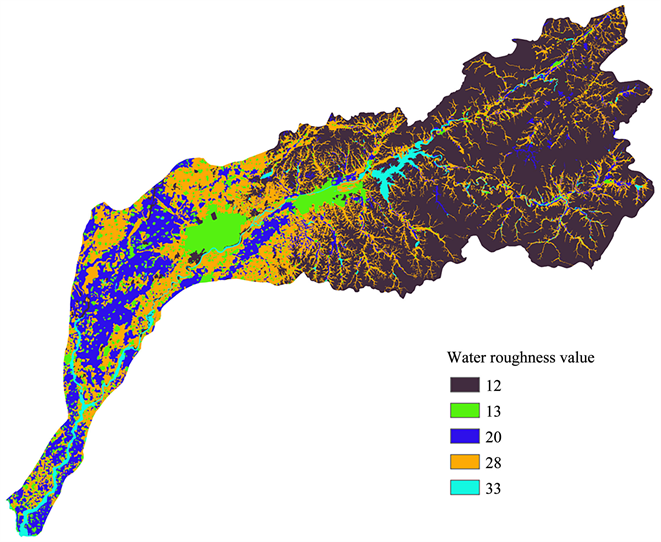
Figure 3. Water roughness value of surface hydraulic power in Hunhe River basin.
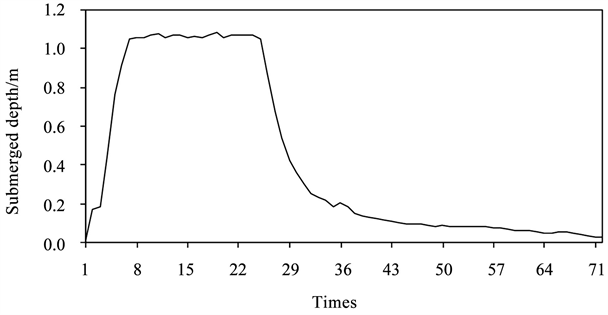
Figure 4. Simulated hourly flood depth at warning spot in Hunhe River basin.
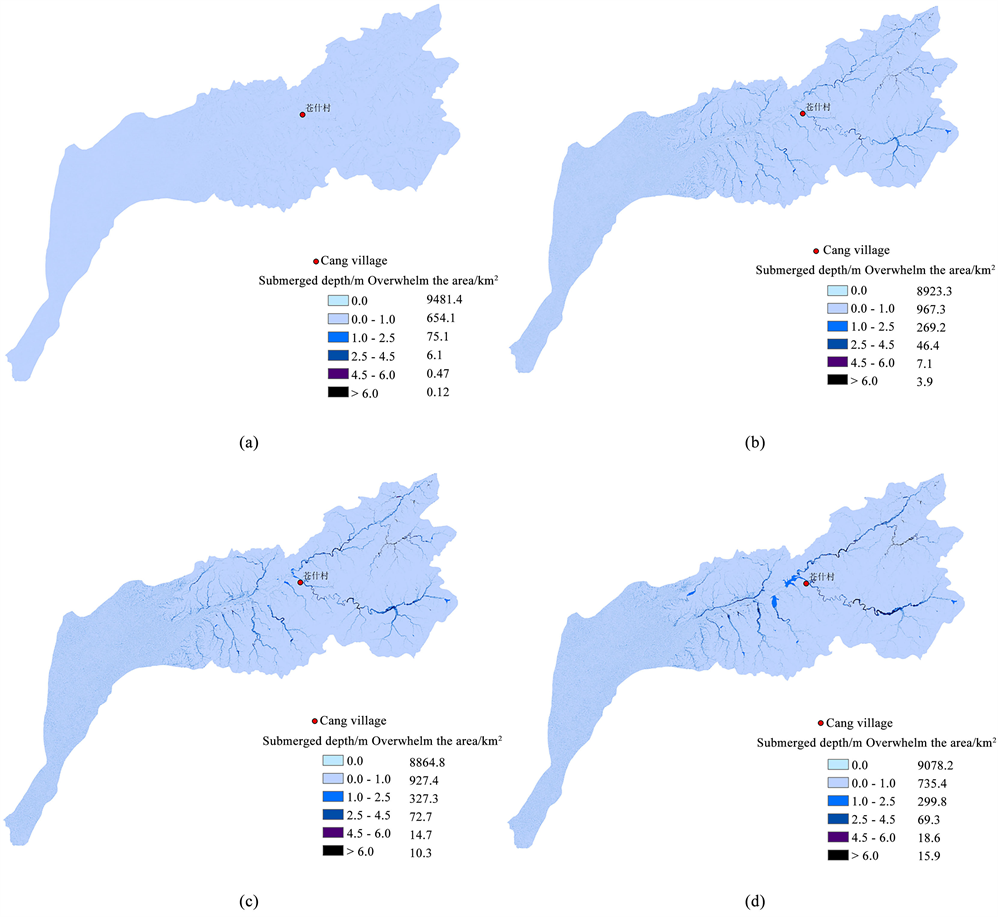
Figure 5. Simulation of flood process in Hunhe River basin at 07 time (a); 19 time (b); 26 time (c); 38 time (d).
3.5. Flood Damage Assessment
In order to assess the social and economic impact of the flood caused by the heavy precipitation in the Hunhe River Basin once a year, the 38th moment when the submergence of the subsidence point Cangshi Village ended, the population of the basin was superimposed on the submerged map of the Hunhe River (Figure 6(a)). GDP (Figure 6(b)), distribution of land use (Figure 6(c)), and statistics on corresponding socio-economic losses within the range of inundation depths in the basin.
Hun River flows through Shenyang, Fushun, Liaoyang, Anshan and other cities, population density of 1054 people per square kilometer, is China’s urban population density larger areas, but also heavy industry in Liaoning Province
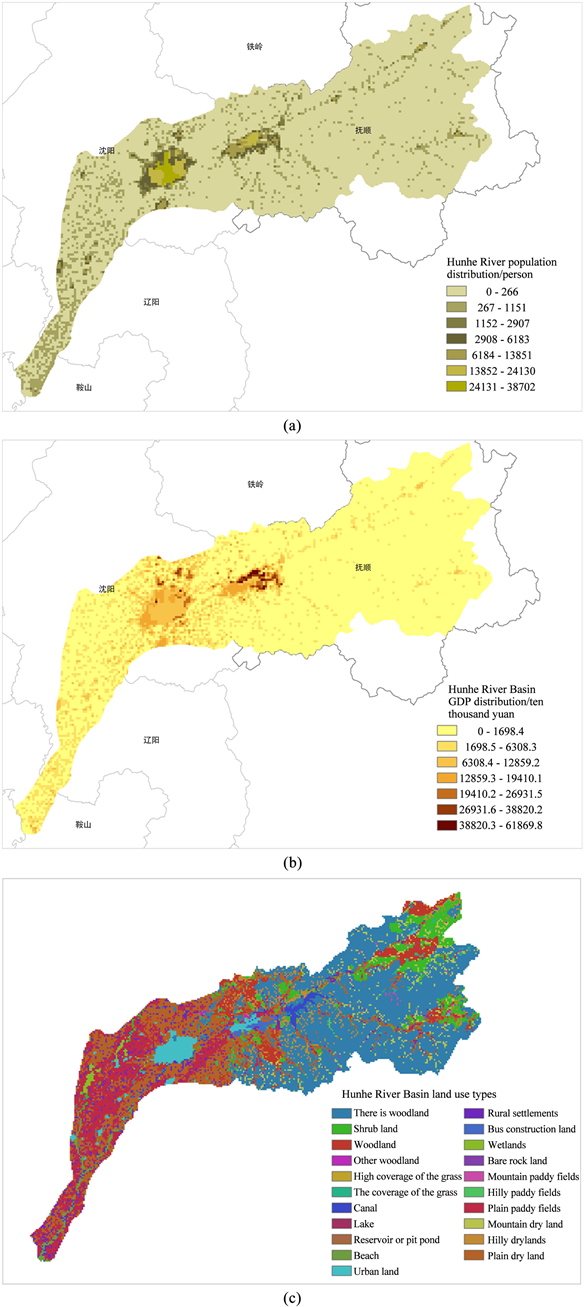
Figure 6. Distribution of population, GDP and landuse in Hunhe River Basin.
and grain production base. Hunhe River Basin population, the distribution of GDP is not uniform, the highest density of population distribution and larger GDP in southeastern Shenyang, western Fushun and other urban areas. There are 21 kinds of land use types in the basin. They are forest land, grassland, reservoir and urban land. Among them, the upper reaches of the basin (source to Dahuofang Reservoir) are mountainous areas with dense forests and good vegetation. The middle reaches Reservoir to Shenyang Hunhe grew up railway bridge) for the hilly areas, southeast of ups and downs, the northern low mountain, the western connecting the plains, the downstream (from the railway bridge to the confluence of San Chahe and Prince Edward River) for the plain, the terrain Flat, fertile land, suitable for crop growth. The basin area of about 61% of the basin, hilly area only 2%, plain accounted for 37%.
As of the end of the upper reaches of the hidden point of submergence over the whole basin, by the once-in-a-hundred cases of heavy rainfall inundated population of about 1,562,000 people, the GDP of about 38.17 billion yuan, the affected land types, the area of forest land submerged 96.4 km2 and grassland flooded 5.6 km2. 102.9 km2 of water area including lakes and canals was affected. 169.8 km2 of residential and urban construction land was submerged, and 369.3 km2 of paddy fields and 495.2 km2 of dry land were affected by this heavy rain flood impact. In general, the population density and GDP in submerged depths within 2.5 meters are higher and the losses are more serious. The forest land and grassland in the land types are less affected, but the losses in dry land and paddy field are relatively large. When the submerged depth exceeds 2.5 meters of area, the population density and GDP are small, available land resources less damage, significantly reduced the extent of the loss. As shown in Table 3 and Table 4,
Table 3. The number of population and GDP corresponding to different flood depth.
Table 4. The landuse corresponding to different flood depth.
the submerged depth is within 2.5 meters. The population affected by this heavy rainfall is 199,000, with a total output value of 32.96 billion yuan. The submerged land totaling 1133.7 km2. The submerged depth exceeds 2.5 meters. The affected population is 1.363 million People, with a total GDP of 5.21 billion yuan, a total of 105.5 km2 submerged land.
4. Conclusion and Discussions
Based on the meteorological and geographical information data of Hunhe River Basin, the optimal distribution function was determined by KS test and the maximum daily precipitation intensity at the once-in-one-hundred-year recurrence period was calculated according to the fit results of the four types of distribution function to the AM sequence. Flooding by FloodArea the model simulates flood inundation scenario caused by heavy rainfall in one hundred years. According to the affected population, GDP and land use types, the model divides the degrees of disaster damage in order to provide real-time disaster risk assessment, disaster prevention planning, construction of its defensive project and more accurate service. The main conclusions are as follows:
1) When severe rainfalls occur once in a century, the depth of submergence in most parts of the Hunhe River basin is less than 1.0 meter, the submergence depth in some areas reaches 1.0 - 2.5 meters, and the flooding depth in some areas exceeds 2.5 meters. After the start of precipitation, flooding mainly concentrated in the upper reaches of the river. With the increase of precipitation and the passage of time, the flooding depth deepened and the inundation range gradually increased. The flooding in the river channels gradually converged to the middle and lower reaches.
2) Cangshu Village, a residential area upstream of Hunhe River, is chosen as the hidden point of the watershed. The change of precipitation depth with precipitation during the flood season is analyzed. Precipitation lasts for 24 hours in total. Cangshi village flooded at the beginning of precipitation. The depth of inundation rose rapidly with the accumulation of precipitation. The depth of inundation began to exceed 1.0 meters at 07:00. At 19:00, the depth of submergence was the largest. After the precipitation stopped, the depth of submergence of Cangshi village decreased gradually. At 26th, the depth of submergence was only 0.87 meters. At 38th, the depth of submergence was less than 0.2 meters, and the submergence of upstream was basically completed.
3) Combined with the population, GDP, and land use information in the basin, GIS is used to evaluate the impact of heavy rainfall on the socio-economic development of the basin in the once-in-a-century severe rainfall in the Hunhe River Basin. Up to the end of the submergence of the upstream, within the whole basin, about 1,562,000 people have been affected by this once-in-a-century heavy rainfall inundation, with a GDP of about 38.17 billion yuan. Of the affected land types, woodland and grassland are less affected, Dry land and paddy fields suffer relatively large losses. The submerged depth of 2.5 meters within the area suffered more serious losses, more than 2.5 meters loss significantly reduced.
There is a certain distance between the fitting results of the four types of distribution function and the measured precipitation data, and the fitting of the precipitation extreme may have some uncertainties. When simulating the Hunhe River with FloodArea submerged model, this study distributes the daily precipitation extremes in a hundred years to an average of 24 hours, which is only representative. If we consider different distribution patterns of hourly precipitation, it may produce Different submerged simulation results.
Acknowledgements
This work was jointly funded by China Meteorological Administration Climate Change Special Project (CCSF201608); Liaoning Province Science and Technology Program (2015103038); China Meteorological Administration Climate Change Special Project (CCSF201609); Liaoning Meteorological Bureau Scientific Research Project (201503); China Meteorological Administration Shenyang Atmospheric Environment Research Open Fund Project Funding.
Cite this paper
Liu, M.Y., Sun, F.H., Hou, Y.L., Zhou, X.Y., Zhao, C.Y. and Yi, X. (2018) Risk Assessment and Simulation on Storm Flood of the 100-Year Return Period in Hunhe River Basin. Journal of Geoscience and Environment Protection, 6, 1-14. https://doi.org/10.4236/gep.2018.67001
References
- 1. Jing, Z.S., Gu, H., Zheng, L.D., et al. (2014) Encyclopedia of Rivers and Lakes in China Section of Heilongjiang River and Liaohe River. China Water Power Press, Beijing, 268-271.
- 2. Lan, H., Yang, L. and Qiu, J.W., et al. (1997) Numerical Simulation for Flood Control Standard of Southern Embankment of Hunhe River in Shenyang City. Journal of Natural Disasters, 6, 95-101.
- 3. Liu, W., He, J.S. and Chen, Y. (2016) Variation Characteristics and Synchronicity Analysis of the Precipitation and Runoff in Hunhe River Basin. Research of Soil and Water Conservation, 23, 150-154.
- 4. Chen, H.Y., Yang, S.F. and Xu, H.E., et al. (2013) GIS-Based High-Resolution Early Warning Index of Rainstorm Disaster. Journal of Natural Disasters, 22, 136-143.
- 5. Shen, C., Sun, Y. and Yin, D.P., et al. (2015) Characteristic Analysis of Rainstorm-Induced Flood Disaster in Jiangsu Province. Journal of Natural Disasters, 24, 203-212.
- 6. Rong, Y.S., Wang, W. and Wang, P., et al. (2012) Analysis of Characteristics of Extreme Rainfall and Estimate of Rainfall during Return Periods in Huaihe Basin. Journal of Hohai University (Natural Sciences), 40, 1-8.
- 7. Lu, Y.Y., Xie, W.S. and Tian, H. (2016) Analysis of Critical Flood Causing Rainfalls in Medium and Small Rivers Based on Hydrological Model and Statistical Method. Journal of Natural Disasters, 25, 38-47.
- 8. Zhang, Z.T., Gao, C. and Liu, Q., et al. (2014) Risk Assessment on Storm Flood Disasters of different Return Periods in Huaihe River Basin. Geographical, 33, 1361-1372.
- 9. Zhang, L., Wang, W. and Wen, M.Z., et al. (2015) Research on Refined Early-Warning Method of Mountain Flood Disaster Based on Floodarea. Journal of Fudan University (Natural Science), 54, 282-287.
- 10. Wen, M.Z., Lin, X. and You, L.J., et al. (2013) Risk Rainfall Assessment Methods of Flash Floods Disaster. Meteorological Monthly, 39, 1325-1330.
- 11. Xie, W.S., Tian, H. and Lu, Y.Y. (2015) Risk Evaluation of Rainstorm and Flood Disasters in Datong River Basin Based on the FloodArea Model. Torrential Rain and Disasters, 34, 384-387.
- 12. Du, H., Xia, J. and Zeng, S.D., et al. (2012) Temporal and Spatial Variations and Statistical Models of Extreme Runoff in Huaihe River Basin. Acta Geographica Sinica, 67, 398-409.
- 13. Lu, M., Gao, C. and Su, B.D., et al. (2015) Spatial Distribution and Probabilistic Characteristics of Extreme Precipitation in the Huaihe River Basin. Journal of Natural Disasters, 24, 160-168.
- 14. Su, B.D., Jiang, T. and Dong, W.J. (2008) Probabilistic Characteristics of Precipitation Extremes over the Yangtze River Basin. Scientia Meteorologica Sinica, 28, 625-629.
- 15. Lu, M., Gao, C. and Yao, M.T., et al. (2016) Probability Distribution Model and Its Application on Extreme Precipitation in Huaihe River Basin. Bulletin of Soil and Water Conservation, 36, 197-203.
- 16. Liu, M.Y., Wang, Y., Zheng, S., et al. (2015) Critical Precipitation Determination for a “0816” Torrent Event in Qingyuan, Liaoning Province. Journal of Meteorology and Environment, 31, 25-30.
- 17. Su, B.D., Jiang, T., Guo, Y.Y., et al. (2005) GIS Raster Data-Based Dynamic Flood Risk Simulation and Its Application. Journal of Hohai University (Natural Sciences), 33, 370-374.
- 18. Liu, J.F., Jiang, W.G., Zhan, W.F., et al. (2010) Processes of SCS Model for Hydrological Simulation: A Review. Research of Soil and Water Conservation, 17, 120-124.
- 19. Peng, D.Z. and You, J.J. (2006) Application of Modified SCS Model into Runoff Simulation. Journal of Water Resources and Water Engineering, 17, 20-24.
- 20. Zhang, H.J. and Hikaru, K. (1995) A Study on Effect of Forest Land Condition upon Roughness Coefficient in the Waet of Shanxi Province. Bulletin of Soil and Water Conservation, 15, 10-21.
- 21. Zhang, H.J., Hikaru, K., Xie, M.S., et al. (1994) Study on Roughness Coefficient under the Conditions of Several Land Utilization in the West of Shanxi Province. Journal of Beijing Forestry University, 16, 86-91.