Journal of Geoscience and Environment Protection
Vol.03 No.07(2015), Article ID:59329,9 pages
10.4236/gep.2015.37001
Dynamics of Forest Landscape Transition across Protected Areas in the Niger Delta from 1986 to 2014
Alex O. Onojeghuo1,2*, Ajoke R. Onojeghuo2,3
1Lancaster Environment Centre, Lancaster University, Lancaster, UK
2Department of Surveying and Geoinformatics, Nnamdi Azikiwe University, Awka, Nigeria
3Centre for Landscape and Climate Research, University of Leicester, Leicester, UK
Email: *lexisgis@yahoo.com
Copyright © 2015 by authors and Scientific Research Publishing Inc.
This work is licensed under the Creative Commons Attribution International License (CC BY).
http://creativecommons.org/licenses/by/4.0/


Received 2 June 2015; accepted 29 August 2015; published 1 September 2015
ABSTRACT
The overall aim of this study was to conduct a spatially explicit study of forest cover changes across 13 selected protected areas (PAs) across the study area using a combination of satellite remote sensing and ground data. The objectives of the study included: determine the spatial extent of forest landscape for selected PAs using three epochs of satellite imagery (1986, 2000 and 2014); determine the spatial extent and rates of forest transition over two 14-year periods (1986 to 2000 and 2000 to 2014); and provide a comprehensive summary of current forest landscape status in the study area. The results indicated that the spatial extent of forest landscape for the 13 FRs was 522,164, 481,870 and 457,651 hectares in 1986, 2000 and 2014 respectively. The forest cover transition for the two 14-year periods investigation showed a larger percentage of forest landscape across the 13 FRs were more affected by deforestation in comparison to afforestation. The overall annual deforestation rates for the PAs were 0.82% and 0.68% for 1986 to 2000 and 2000 to 2014 time periods. The annual afforestation rates for both 14-year periods were 0.38% and 0.39% respectively. Based on the results being obtained there was an urgent need to review the ways forest reserves and national parks in Cross River state were managed. The promotion of forest conservation was vital to the preservation of existing forest landscapes and endangered wildlife, such as the Cross River Gorilla gorilla and Nigeria-Cameroon chimpanzees. The role of community participation with the assistance of government and conservation organizations would prove effective in forest monitoring activities across the state. In conclusion, results of this study showed the potential of incorporating satellite remote sensing and ground truth data for better understanding the spatial dynamics of forest cover in PAs across the Niger Delta region.
Keywords:
Remote Sensing, Forest Reserves, Change Detection, Protected Area

1. Introduction
The Niger delta region is an ecological fragile region with high levels of biodiversity and is known to be a repository of biologically diverse plants that offers opportunities for food and pharmaceuticals [1] . Plants such as Thaumatococcus danielii (Marantaceae), Synsephalaum dulciferum (Sapotaccae) and Dioscroreophyllum cumminsii (Menispermatacae) grow naturally in the Niger delta region and are potential sources of high calibre or potent natural sweeteners [2] [3] . Other medicinal plants that grow naturally in the region include Fagara sp. for sickle cell anaemia treatment and Rauvolfia vomiforia for high blood pressure relief [2] . In addition to providing plants for medicinal purpose, the forest ecosystem offers the following products: fuel wood for cooking, heating, drying of rice and charcoal production; timber for use in the road/railroad construction, building industry or boat construction; paper production and edible wildlife plants in forms of leafy vegetables, fruits and seeds, spices, food wrappers and starchy tubers. However, due to problems like rise in population density; urbanisation; activities relating to exploration of crude oil (e.g. indiscriminate felling of trees and land clearing for sesmic surveys, drilling for crude etc.); deforestation [4] ; and poor farming practice all have negative impacts on the preservation of forests and the produce derivable therein. Therefore, the conservation of the tropical forest ecosystem in the region is a critical issue needing urgent attention.
A major approach to conserving the diverse forest landscape across this fragile region is through the establishment and effective management of conservation sites across the states in this region. The conservation of forest landscapes and its derivable resources in the region is directly linked to the peculiarity of human activities not evenly distributed on the land surface owing to variations in climatic, geological, demographic, and cultural, factors in different areas of Nigeria [5] . Consequently, land uses are not influenced by capabilities of existing resources or effective landuse polices but rather the resources that are directly derivable. As is the case of the Niger delta region, derivable resources (such as oil and timber) are exploited without consideration for future development and conservation of the environment. The Niger Delta region has been termed as a biodiversity hotspot and classed as the second most sensitive environment in Africa [6] . With over 70 protected areas (PAs) being designated and gazetted as national parks, game reserves, forest reserves (FR) and strict natural reserves [7] across the region, there are still challenges facing forest and wildlife conservation [8] [9] . The distribution of PAs in the Niger Delta region comprise of 1 strict Nature Reserve of IUCN (International Union for Conservation of Nature) category Ia in Edo state; 2 national parks, IUCN category II in Edo and Cross River State (CRS); 4 game reserves of category IV in Edo and CRS; and 63 FRs all across the state [7] [10] . Phil-Eze and Okoro [10] note that there has been a substantial decline in biodiversity around the Niger Delta due to immense loss in forest cover. The study further emphasizes on the need to select suitable PA sites based on the ecological zones of the region, as such an approach will prove to better sustain biodiversity conservation. A key requirement for selecting new or managing existing PAs is first understanding the spatial transition pattern of forest landscapes across the region, information that’s currently lacking for the region.
Studies have demonstrated the potential of combining satellite remote sensing and ground data [11] to effectively determine the spatial extent of deforestation across PAs in tropical forest regions of the world [12] [13] . In a study conducted by DeFries et al. [12] , multiple satellite imagery was used to examine the extent of forest cover loss over a period of two decades throughout the world’s moist and dry tropical forests. In order to answer the existing gap in literature on spatial information of forest landscape dynamics across PAs in the Niger Delta region, this paper presents results on the current status of tropical forests in CRS (a state with over 50 percent of tropical forests in the Niger Delta region).
The overall aim of this study was to conduct a spatially explicit study of forest cover changes across 13 selected PAs (FRs and national parks in CRS) using satellite remote sensing and ground data. The objectives of the study were: 1) determine the spatial extent of forest landscape of selected PAs using three epochs of satellite imagery (1986, 2000 and 2014); 2) determine the spatial extent and rates of forest transition over two 14-year periods (1986 to 2000 and 2000 to 2014); and 3) to provide a comprehensive summary of current forest landscape status in the study area.
2. Materials and Methods
2.1. Study Area
The study area comprises of 13 forest reserves (FRs) spread across the state and is known to have over 50% of the country’s remaining tropical forest (Figure 1). The ecological zone of Cross River state is characterized by lowland rain forest, freshwater swamp forest, mangrove vegetation, coastal wetland vegetation, Montane Forests and savannah vegetation [14] . The FRs across the state are managed by either local communities, government representation (in form of the Cross River State Forestry Commission―CRSFC), conservation organizations or a combination of the afore-mentioned. The FRs investigated in the study includes the following: Afi River (FR1), Agoi (FR2), Boshi (FR3), Boshi extension (FR4), Cross River North (FR5), Cross River South (FR6), Ekinta
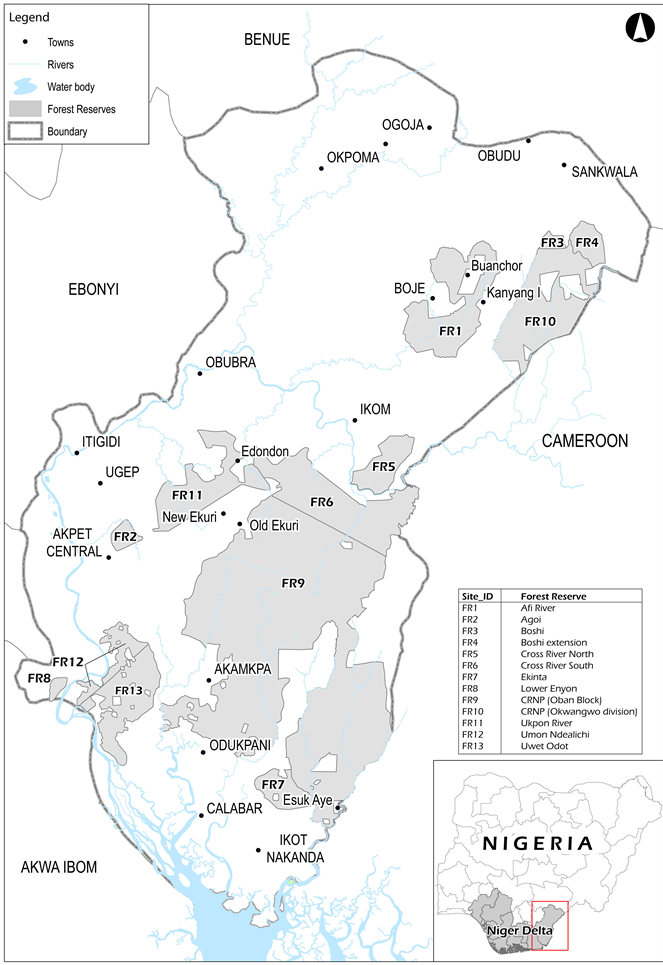
Figure 1. Map of study area showing 13 forest reserves across cross river state.
(FR7), Lower Enyon (FR8), Cross River National Park (Oban Block) (FR9), Cross River National Park (Okwangwo division) (FR10), Ukpon River (FR11), Umon Ndealichi (FR12) and Uwet Odot (FR13).
2.2. Remotely Sensed Data
For this study the satellite imagery used for forest classification and change detection analysis were for three epochs (1986, 2000 and 2014) included Landsat and UK-DMC sensor data. The Landsat images used were Landsat Thematic Mapper (dated December 1986), Landsat Enhanced Thematic Mapper―ETM (January 2000) and UK-DMC (January 2014) all acquired in the dry season in order to minimize seasonality variations [15] . Both Landsat images were downloaded from the Global Landcover Facility website while the UK-DMC image was provided by the Nigeria Space Agency (NASRDA―National Space Research and Development Agency). The supplied satellite imageries were radiometrically and geometrically corrected thereby allowing for direct image-to-image comparison.
2.3. Image Classification and Change Detection Analysis
The satellite images were classified using the unsupervised ISODATA (Iterative Self Organising Data Analysis) classification technique [16] . This procedure was performed using the ISODATA classifier algorithm in ERDAS Imagine software [17] . Using independent training and testing data, a total of six broad classes based on the IPCC (Intergovernmental Panel on Climate Change) land use classification scheme [18] were delineated to show forestland, cropland, grassland, wetlands, settlements and other land classes. Following the confirmation that the classified images were within tolerance, the classified outputs for each year were further reclassified to reflect two major classes needed for the is study: forest and non-forest classes respectively. The training and validation ground truth data were obtained from the following sources: Google Earth, high resolution satellite imageries, historic aerial photographs, global positioning system (GPS) ground data and manual interpretation of the satellite imageries used in the study.
The process of change detection analysis was performed using the Land Cover Modeler of IDRISI 17.0 Selva Edition [19] . Using the LCM transitions in forest cover landscape across the study area was performed to identify the extent of deforestation, unchanged forest cover and afforested parts of the FRs. The two time intervals investigated in this study were 1986 to 2000 and 2000 to 2014 respectively. The annual deforestation rates of the classified outputs were calculated using Equation (1) below:
 (1)
(1)
where Fb/a = forested area for baseline (earlier) and assessment (later) in hectares, B = deforested area in hectares and “ta and tb” indicate time-1 and time-2 respectively.
3. Results and Discussion
3.1. Accuracy Assessment of Classified Images
The classification accuracy results of the classified images for 1986, 2000 and 2014 are presented in Table 1 below. The results indicated that the overall classification accuracy for the 1986, 2000 and 2014 images were 91%, 89% and 91% respectively.
3.2. Pattern of Forest Cover Transition
Table 2 presents the results of forest cover and change detection analysis for all FRs in the study area. The spatial extent of forest landscape for the 13 FRs were 522,164 hectares (1986), 481,870 hectares (2000) and 457,652 hectares (2014) respectively (Table 2). Figure 2(a) shows the percentages of forest landscape cover for 1986, 2000 and 2014. The results show that forest landscape in FR1, FR2, FR3, FR6, FR7, FR9, FR10 and FR11 decline from 1986 to 2014. The second pattern of forest cover transition shown in FR4 was a rise between 1986 and 2000 with subsequent decline in 2014. In FR5, FR8 and FR13, the third pattern of forest transition was a decline from 1986 to 2000 and rise in 2014. The final pattern of transition observed in the study was a rise in forest landscape from 1986 to 2014 observed in FR12.

Table 1. Accuracy assessment results showing user accuracy (UA), producer accuracy (PA) and overall accuracy (OA) generated for classified images.

Figure 2. Results of study showing percentage cover of (a) forest landscape cover; (b) deforested landscape; (c) unchanged forest landscape; and (d) afforested landscape from 1986 to 2014 for forest reserves in CRS.
Results of forest cover transition for the two 14-year periods investigated showed that overall a larger percentage of forest landscape across the 13 FRs were more affected by deforestation in comparison to afforestation (Figure 2(b) and Figure 2(d)). With regards to the unchanged forest landscape, the results showed a general decline over the two 14-year periods with the exception of FR6 which was approximately the same. The forest landscape across the study area affected by deforestation declined from 81,143 hectares (between 1986 and 2000) to 70,624 hectares (between 2000 and 2014). The afforested and unchanged forest landscape over the 14-year periods investigated increased by 33,582 hectares and declined by 13,131 hectares respectively (Table 2). The overall annual deforestation rates for the PAs were 0.82% and 0.68% for 1986 to 2000 and 2000 to 2014 time periods. The annual afforestation rate for both 14-year periods was 0.38% and 0.39% respectively. Figure 3 shows the forest cover maps for the 13 FRs across Cross River state. Figure 4 shows the forest cover transition map indicating forest landscapes across the FRs that were deforested, unchanged and afforested.
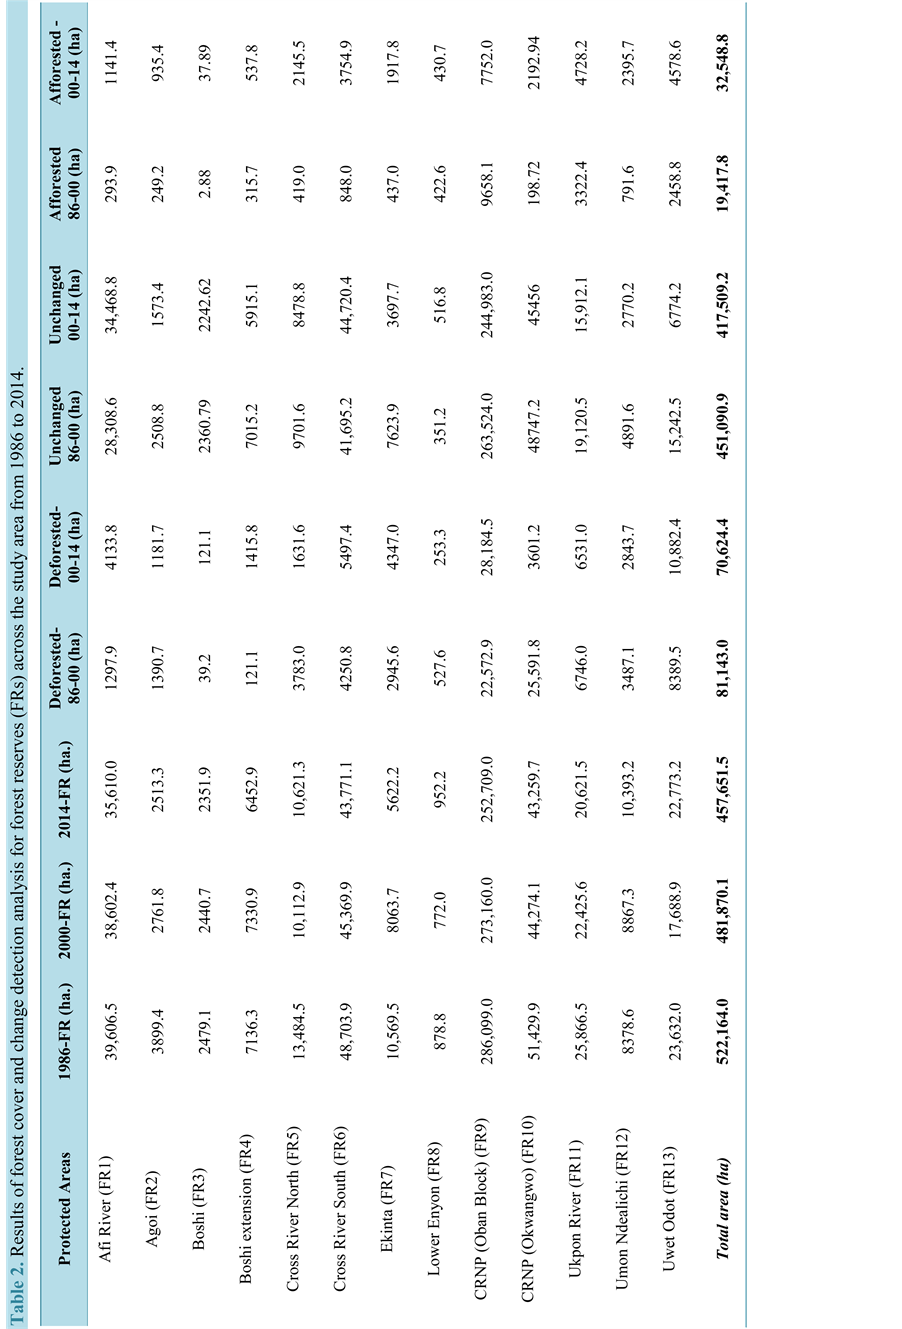
Table 2.Results of forest cover and change detection analysis for forest reserves(FRs) across the study area from 1986 to 2014.

Figure 3.Forest cover maps of forest reserves across cross river state for 1986,2000and 2014.
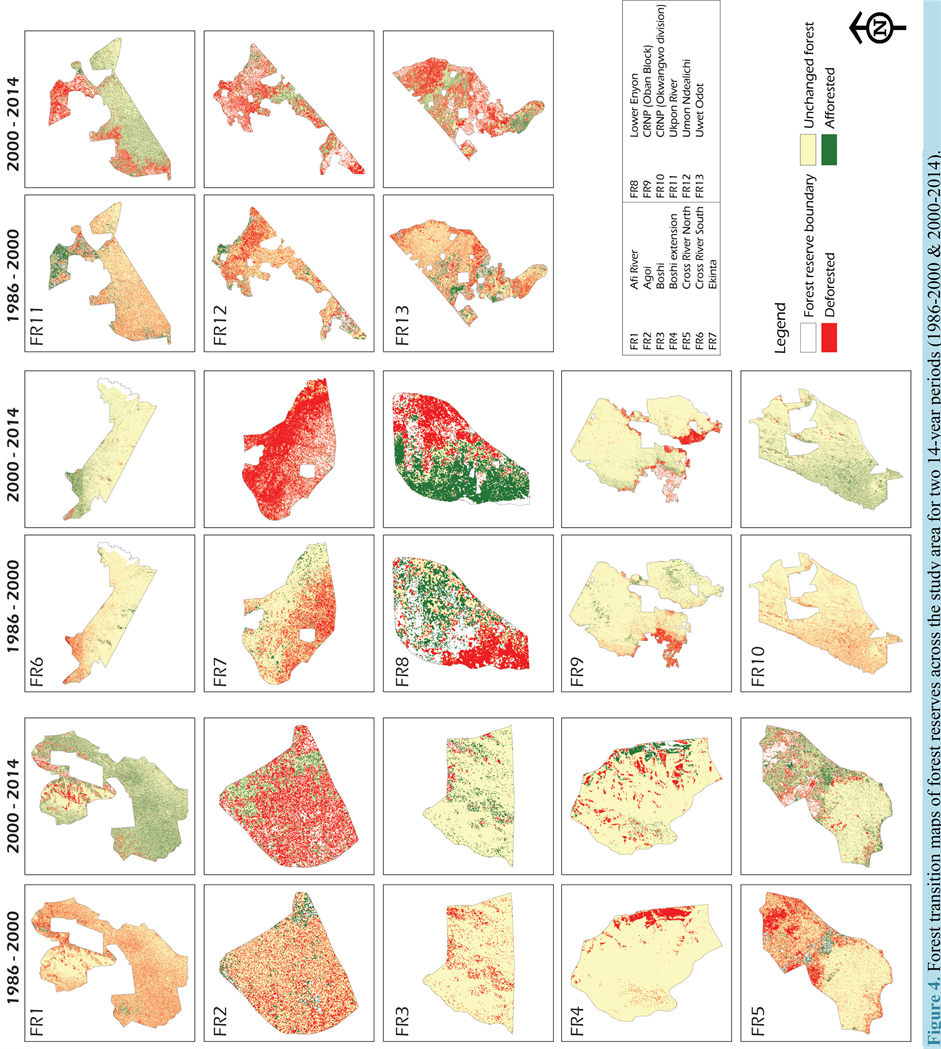
Figure 4.Forest transition maps of forest reserves across the study area for two 14-year periods(1986-2000&2000-2014).
4. Conclusions
This study has demonstrated the effectiveness of utilising satellite remote sensing and ground based measurements to determine the spatial extent and changes of forest landscape across protected areas in CRS. The results indicate that spatial extent of forest landscape for the 13 FRs is 522,164, 481,870 and 457,651 hectares in 1986, 2000 and 2014 respectively. Results of forest cover transition for the two 14-year periods investigation show a larger percentage of forest landscape across the 13 FRs are more affected by deforestation in comparison to afforestation. The overall annual deforestation rates for the PAs are 0.82% and 0.68% for 1986 to 2000 and 2000 to 2014 time periods. The annual afforestation rates for both 14-year periods are 0.38% and 0.39% respectively.
From the results it’s obvious that the 13 PAs are under threats of deforestation. Hence, there’s an urgent need to review the ways FRs and NPs in CRS are managed. The promotion of forest conservation is vital to the preservation of existing forest landscapes and endangered wildlife, such as the Cross River Gorilla gorilla and Nigeria-Cameroon chimpanzees. The role of community participation with the assistance of government and conservation organizations will prove effectively in forest monitoring activities across the state. In addition, further research as to the effects of forest change in protected areas across the Niger Delta suggests that as such information is currently lacking. In conclusion, results of this study show the potential of incorporating satellite remote sensing and ground truth data for better understanding the spatial dynamics of forest cover in PAs across the Niger Delta region.
Acknowledgements
The authors would like to appreciate the National Space Research and Development Agency (NASRDA) for providing the UK-DMCii satellite image used in the study.
Cite this paper
Alex O.Onojeghuo,Ajoke R.Onojeghuo,11, (2015) Dynamics of Forest Landscape Transition across Protected Areas in the Niger Delta from 1986 to 2014. Journal of Geoscience and Environment Protection,03,1-10. doi: 10.4236/gep.2015.37001
References
- 1. NDES (1997) Niger Delta Environmental Survey Phase 1 Report: Volume IV—Biodiversity. Environmental Resources Managers Limited, Lagos.
- 2. Hall, J.B. and Swaine, M.D. (1981) Distribution and Ecology of Vascular Plants in a Tropical Rain Forest. Forest Vegetation in Ghana. Springer, Netherlands.
http://dx.doi.org/10.1007/978-94-009-8650-3 - 3. NDES (1997) Niger Delta Environmental Survey Phase 1 Report: Volume I—Environmental and Socio-Economic Characteristics. Environmental Resources Managers Limited, Lagos.
- 4. Onojeghuo, A.O. and Blackburn, G.A. (2011) Forest Transition in an Ecologically Important Region: Patterns and Causes for Landscape Dynamics in the Niger Delta. Ecological Indicators, 11, 1437-1446.
http://dx.doi.org/10.1016/j.ecolind.2011.03.017 - 5. Osemeobo, G.J. (1988) The Human Causes of Forest Depletion in Nigeria. Environmental Conservation, 15, 17-28.
http://dx.doi.org/10.1017/S0376892900028411 - 6. World Bank (1995) Defining an Environmental Development Strategy for the Niger Delta. Vol. I & II, Industry and Energy Operation Division, West Central Africa.
- 7. WCMC (2005) World Conservation and Monitoring Centre (WCMC) Protected Area Database.
http://www.unepwcmc.org - 8. Oates, J.F., Sunderland-Groves, J., Bergl, R., Dunn, A., Nicholas, A. and Takang, E. (2007) Regional Action Plan for the Conservation of the Cross River Gorilla (Gorilla gorilla diehli). IUCN/SSC Primate Specialist Group and Conservation International.
- 9. Morgan, B.J., Adeleke, A., Bassey, T., Bergl, R., Dunn, A. and Fotso, R. (2011) Regional Action Plan for the Conservation of the Nigeria-Cameroon Chimpanzee (Pan troglodytes ellioti). IUCN/SSC Primate Specialist Group and Zoological Society of San Diego.
- 10. Phil-Eze, P. and Okoro, I. (2009) Sustainable Biodiversity Conservation in the Niger Delta: A Practical Approach to Conservation Site Selection. Biodiversity and Conservation, 18, 1247-1257.
http://dx.doi.org/10.1007/s10531-008-9451-z - 11. Murdiyarso, D. and Skutsch, M. (2006) Community Forest Management as a Carbon Mitigation Option: Case Studies. CIFOR, Bogor.
- 12. DeFries, R., Hansen, A., Newton, A.C. and Hansen, M.C. (2005) Increasing Isolation of Protected Areas in Tropical Forests over the Past Twenty Years. Ecological Applications, 15, 19-26.
http://dx.doi.org/10.1890/03-5258 - 13. Ellis, E.A. and Porter-Bolland, L. (2008) Is Community-Based Forest Management More Effective than Protected Areas? A Comparison of Land Use/Land Cover Change in Two Neighboring Study Areas of the Central Yucatan Peninsula, Mexico. Forest Ecology and Management, 256, 1971-1983.
http://dx.doi.org/10.1016/j.foreco.2008.07.036 - 14. Oyebo, M., Bisong, F. and Morakinyo, T. (2010) A Preliminary Assessment of the Context for REDD in Nigeria.
http://www.gcftaskforce.org/meeting/documents/Nigeria_National_Update_GCF_2011.pdf - 15. Malingreau, J., Achard, F., D’souza, G., Stibig, H., D’souza, J. and Estreguil, C. (1995) AVHRR for Global Tropical Forest Monitoring: The Lessons of the TREES Project. Remote Sensing Reviews, 12, 29-40.
http://dx.doi.org/10.1080/02757259509532273 - 16. Ball, G.H. and Hall, D.J. (1965) ISODATA, a Novel Method of Data Analysis and Pattern Classification. Stanford Research Institute, Menlo Park.
- 17. ERDAS (2014) ERDAS Imagine 2014. Hexagon Geospatial, Peachtree Corners Circle Norcross.
- 18. Smith, P., Bustamante, M., Ahammad, H., Clark, H., Dong, H. and Elsiddig, E.A. (2014) Agriculture, Forestry and Other Land Use (AFOLU). In: Edenhofer, O., Pichs-Madruga, R., Sokona, Y., Farahani, E., Kadner, S. and Seyboth, K., Eds., Climate Change 2014: Mitigation of Climate Change, Contribution of Working Group III to the Fifth Assessment Report of the Intergovernmental Panel on Climate Change, Cambridge University Press, Cambridge, United Kingdom and New York.
- 19. IDRISI (2014) IDRIS Selva Version 17. Clark Labs, Clark University, Worcester.
NOTES

*Corresponding author.