Open Journal of Medical Imaging
Vol.2 No.2(2012), Article ID:19689,8 pages DOI:10.4236/ojmi.2012.22006
Sources of Variability in the Use of Standardized Perfusion Value for HCC Studies
1Department of Biomedical, Electronic and Telecommunication Engineering, University “Federico II”, Naples, Italy
2National Cancer Institute “Pascale Foundation”, Naples, Italy
Email: *cesarell@unina.it
Received December 6, 2011; revised January 31, 2012; accepted February 10, 2012
Keywords: CT perfusion; calibration; liver tumour
ABSTRACT
Hepatocellular carcinoma (HCC) is one of the world’s most common malignant tumours. As it is known, liver tumour tissue is characterised by an increased blood supply related to neoangionesis which causes an increased arterial vascularisation. CT Perfusion Imaging is an important, non invasive, technique for qualitative assessment of tissue perfusion after contrast agent administration. Nevertheless, being able to reliably quantifying angiogenesis is increasingly important to both the evaluation of the disease progression and monitoring of the therapeutic response of HCC. With this in mind, we believe that could be helpful to employ Standardised Perfusion Value (SPV), which has the potential to be a useful non-invasive marker of HCC angiogenesis. However, before using SPV in clinical practice, we need to verify its reliability. There are different causes of variability in applying the SPV index, e.g., the technical specifications of the CT system employed and the image processing system. In this paper the authors will analyse the variability of the BFa estimates and the variability due to the calibration procedure of the CT system, this with the objective of verifying how these factors affects SPV values. In our case, perfusion MDCT images of seventeen HCC patients were analysed. A software application, based on maximum slope method, was developed to compute BFa and SPV values. Four radiologists were involved in images processing evaluating variability related to ROI selection; each radiologist repeated the ROI drawing four times on the same image set. We computed the K calibration factor in order to evaluate SPV variability due to calibration protocol of CT systems. Results show that calibration factor variance, due to the position in the gantry, is less than BFa variability. So, we conclude that, when daily calibration is preferred, a simplified protocol, which neglects the dependence of K factor from the position, may be utilised; at least until the intrinsic variability of perfusion parameter computation operator-dependent will be reduced.
1. Introduction
Perfusion CT imaging is a non invasive technique for an assessment of tissue perfusion after contrast agent administration. Initially, the technique was essentially confined to research studies of renal or myocardial blood flows. Nowadays, instead, perfusion CT studies and clinical applications are also increasingly used in the oncology field, this is facilitated by the current availability, on the market, of multislice spiral CT systems and commercial software packages [1] and promoted by the diffusion, in routine clinical practice, of anti-angiogenic therapies. Neoplastic angiogenesis is in fact an important prognostic factor and a promising target for new treatments, of fundamental importance for monitoring tumour growth and metastasis [2]. Different techniques of image processing have been employed, in recent years, to obtain information about angiogenic characteristics of tumours in a non-invasive way [3]. Among them, CT perfusion is advocated as a means to assess the grade of vascularisation in tumour tissue, this is supported by studies, which have reported a correlation between contrast enhancement parameters and histological measurements of angiogenesis [4,5]. CT perfusion is also employed to evaluate variations in perfusion parameters following regional treatments in loco, in which has demonstrated to be a valid alternative to hepatic resection and a suitable option for unresectable tumours [6,7] and antiangiogenic drugs [5,8-10].
Several tumours are currently analysed by means of CT perfusion, among them the HCC, object of our interest. Hepatocellular carcinoma (HCC) is one of the most common malignant tumours in the world, causing about 1 million deaths per year [11,12]. As known, liver tumour tissue is characterized by an increased blood supply related to neoangiogenesis which causes an increased arterial vascularisation [2,13,14]. Hence, the CT perfusion represents a useful and promising technique for HCC studies; however, in the clinical application of CT perfusion exams, there is lack of standardization because of different acquisition image protocols and different software analysis applied to obtain perfusion parameters. This vacuum makes it difficult to evaluate and to compare results from different studies [6,14]. Other causes of variability can be recognised in CT perfusion exams, e.g.: the subjectivity of the operator that processes perfusion exams and defines the software’s input parameters to obtain perfusion values [15,16] and the injection rate of contrast agent. Finally, other additional variability elements are those related to the individual patient, such as weight and cardiac output that influence distribution and flow of contrast agent in tumour tissue. In order to reduce these latter variability sources, in 2001 Miles [17] proposed a Standardized Perfusion Value (SPV) index, that is normalised compared to those parameters.
Some clinical studies have demonstrated that SPV is a useful index to characterize lung and breast tumour vascularisation [17-19], but, for all we know, there are not studies about SPV use in liver tumour analysis [2]. Nevertheless, we consider might be helpful to employ SPV index for reliably quantifying angiogenesis, for evaluation of disease progression and for monitoring the therapeutic response of HCC. Of course, for using SPV in clinical practice, to quantify arterial perfusion within HCC nodules using perfusion CT studies, we need a robust and standardised image acquisition protocol, an appropriate image processing, and it is necessary to ensure the reliability of the proposed index.
There are different causes of variability to take into consideration when applying the SPV index, such as the mathematical model adopted to evaluate perfusion, technical specifications of the employed CT system and image processing; some of which are dealt with in this article. In particular, in order to verify how these factors affect SPV values, the authors are discussing, in this paper, the variability related to BFa estimation (within image processing) and calibration procedure of CT system (important technical aspect).
These factors were chosen for the reasons explained below.
The variability related to the BFa estimates is in turn due to different aspects, in particular the ROI positioning. In this work, intra and inter operator variability in the computation of BFa was analyzed collecting the results of the processing made by four expert radiologists after more independent positioning of the ROI on the CT images.
As reported in literature [17], calculation of SPV includes the value of a calibration factor that converts iodine concentration to CT attenuation in Hounsfield units (HU); but calibration factor is specific for each CT system and changes over time [20], so, a calibration procedure has to be carried out before computing SPV tumour index. A calibration procedure was carried out to examine dependence of K factor by the position within the gantry.
2. Patients and Methods/Materials and Methods
2.1. Patients
For this research, were initially enrolled twenty subjects, with multiple or single hypervascular HCC lesions and without cardiac complications.
Three of them were excluded from the analysis because of poor quality in data images, this was due to patient’s movements, which, as known, represent an important reason of image misregistration in the CT perfusion of chest and abdomen [6]. Therefore, seventeen patients (5 women and 12 men; age range, 52 - 83 years; mean, 69.3 years) were included in the study.
The diagnosis of HCC tumour was achieved on the basis of AASLD (American Association for the Study of Liver Disease) criteria using established techniques (RM, MDTC and CEUS) or by means of liver biopsy. Weights and other relevant clinical information were collected for all patients. A target untreated lesion was selected on basal CT scan (without contrast). Then, perfusion CT study was performed for each patient. The project was approved by the scientific technical committee of the hospital (National Cancer Institute “Pascale Foundation”, Naples, Italy) as part of an internal research project, with note DSC/1957 of 2009, all patients gave informed consent to undergo investigation.
2.2. CT Perfusion Imaging
Perfusion CT was performed by means of a commercially available scanner (Philips Brilliance 16 slices). The perfusion protocol comprised 30 scans (90 kVp, 250 mAs, 4 × 6 mm slice thickness, 1 second gantry rotation time, 3 s acquisition time), which were obtained in correspondence of tumour lesion. A 70 ml bolus of contrast agent (Iomeron 400 mg/ml) was injected (injection rate 4 ml/s) into an antecubital vein at the beginning of the CT data acquisition. The participants were advised to breathe slowly to reduce motion artifacts.
2.3. Image Processing
Images were exported for successive analysis by means of DICOM protocol and then were processed off-line using Matlab version 7.8.0.
As mathematical model, we selected the slope method, already successfully validated for abdominal organs [1], which has the advantage of allowing the calculation of perfusion parameters with short-duration scans [3]. About flow assessment; arterial blood flow (BFa) and portal blood flow (BFp) in the liver, should be separately evaluated. Nevertheless, it is possible to neglect BFp [14, 21] since HCC is characterised by a high arterial vascularisation and it is not generally nourished by portal vein.
A software implementing the “slope method” was developed by the authors both to process time attenuation curves (TAC) [22] and to compute BFa. Two circular regions of interest (ROI) were drawn on images, one on the liver tumour and the other on the aorta (please refer to Section “Analysis of BFa Variability Due to ROI Manual Selection” for details). In figure 1, as example, an abdominal image with the two ROI (HCC lesion and aorta) superimposed and the correspondent TAC are shown. TAC were obtained plotting the mean values of the gray levels within ROI against the acquisition time. Then, they were processed to reduce breathing artifacts1.
2.4. SPV and BFa Indexes
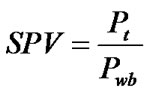
SPV index was evaluated for all patients according to the formula proposed by Miles:
 (1)
(1)
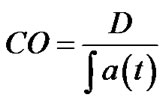
where Pt is the tumour perfusion and Pwb is the mean whole-body perfusion. Pwb is defined as Cardiac Output (CO) divided by the patient’s body weight (W). Cardiac output can be evaluated from perfusion CT images and defined as injected dose of contrast (D) divided by the area under aortic curve (AUC):
 (2)
(2)
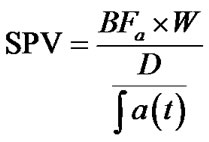
Pt was evaluated computing BFa; hence, in the end, we computed SPV index by means of the following equation:
 (3)
(3)
where the dose of contrast is calculated as below illustrated:
D = volume of contrast [ml] × contrast concentration [mg/ml] × K factor [HU/(mg/ml)] (4)
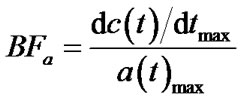
According to the slope method analysis [1], BFa was evaluated as:
 (5)
(5)
where c(t) is the tumour TAC and a(t) is the aorta TAC, obtained respectively by ROI on tumour and aorta.
The maximum slope was automatically evaluated by means of first derivative computation, implemented over the fitting of the TAC curve, BFa value was automatically calculated by dividing the estimated maximum slope by the maximum enhancement value over aorta TAC.
2.5. Analysis of BFa Variability Due to ROI Manual Selection
As it can see by equation (3), before the evaluation of SPV, BFa value has to be computed. In this phase, important causes of variability are slice and ROI selection [23].
Four expert radiologists (each with at least two years of experience in CT perfusion) were involved in the processing of the perfusion image data set for each patient. They were instructed to choose a single slice, from the perfusion image data set, that best depicted the tumour. Then, a circular ROI was drawn on the image displayed by the software, this was done in order to include as much of tumour tissue as possible, still remaining within its boundaries, and to ensure that it did not include large vessels. Once the slice is selected, different circular ROI of different size and in different position (respecting the inclusion criteria) can be selected on the same patient. Therefore, to evaluate the variability related to operator-dependent ROI selection, each radiologist, repeated, on the same selected slice and a week apart from each other, the input procedure (i.e. ROI position and dimension) four times on the same image set. For each set of measures (same radiologist and same patient) mean value and standard deviation of BFa values were computed, finally providing the percentage of variation coefficient as a concise estimation of variability.
2.6. Calibration of the CT System
To evaluate the SPV index, the computation of the calibration K factor of the CT system was necessary (please see equations (3) and (4)). K factor is defined as the slope of the plot of attenuation in HU vs different contrast agent concentrations (in milligrams per millimetre) [17]. Therefore, the calibration procedure aims to determine the calibration K factor that characterizes the linear
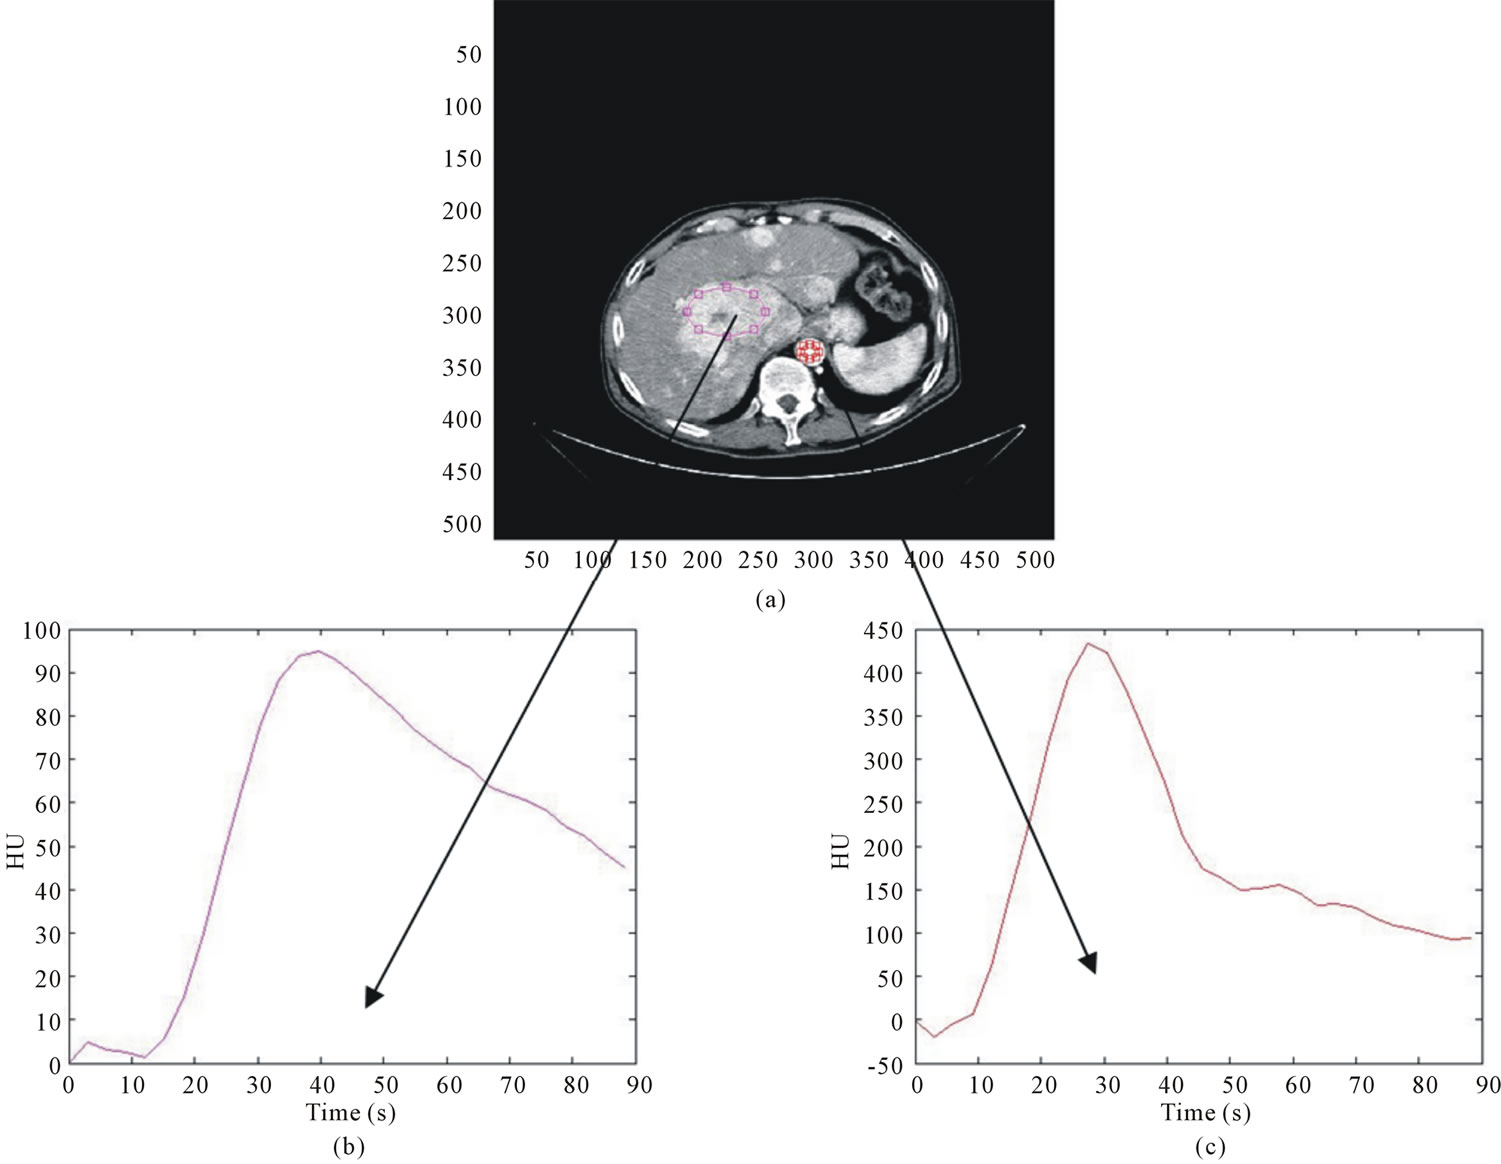
Figure 1. on the top (a), example of a CT perfusion image; in the second row, correspondent TAC relative to the lesion (a) and to the aorta (b).
relationship between the measured attenuation in HU and the concentration of contrast agent [20].
We have carried out a specific procedure to evaluate the dependence of the K factor from the position in the CT scan for our CT system.
We performed our calibration procedure, following a method similar to others reported in literature [17,20,24], with a cylindrical acrylic phantom (Fluke Biomedical) with five holes. The thickness of the phantom is 15 cm with diameter of 32 cm and contains five pipettes holes (A, B, C, D, E, see figure 2), one in the centre and four around the perimeter, 90˚ apart and 1 cm from the edge. The inside diameter of the holes is 1.31 cm.
The phantom includes five acrylic inserts for plugging all the holes not filled with pipettes. Contrast agent of 400 mg/ml was diluted in physiological saline solution to obtain four different concentrations (6, 9, 12, 15 mg/ml). These concentrations correspond to physiological concentration in abdomen, liver, spleen and major vessels (such as aorta and vena porta) when a contrast agent bolus of 70 ml is injected at a rate of 4 ml/s. Pipettes with five different concentrations of contrast were prepared (0, 6, 9, 12, 15 mg/ml). The scan parameters were the same used to obtain patients images in our HCC perfusion studies. The phantom was placed on the scanner table so
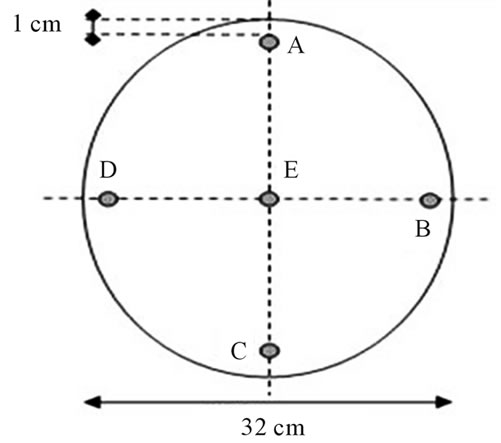
Figure 2. scheme of the phantom used for the calibration procedure.
that the pipettes of contrast agent were parallel to the z-axis of the CT scanner. The height of the table was adjusted in order to position the phantom at the centre of the CT gantry (figure 3).
Our calibration protocol was based on six configurations (P0, PA, PB, PC, PD, PE) corresponding to different positions of the pipettes in the phantom. The evaluation of K factor in different configurations aims to estimate its dependence on the position in the scan field. In configuration P0, the five pipettes with different contrast concentrations (0, 6, 9, 12, 15 mg/ml respectively) were inserted in the five holes (A, B, C, D, E) of the phantom and then scanned simultaneously by means of a single acquisition using the perfusion protocol scan sequence. In the other configurations, the five pipettes were inserted one at a time in the same hole (i.e. A corresponding to PA, B to PB, C to PC, D to PD and E to PE configuration), and the others holes were filled with acrylic inserts. Therefore, for these configurations, five scans were necessary, each of them with a different contrast agent concentration in the pipette, in order to estimate the K factor corresponding to every position. Since each TC scan provides 8 images, 8 K factors and their mean and standard deviation were computed for each configuration. To determine the K factor, regions of interest (ROI) were located by the operator on images in correspondence with each pipette containing contrast agent. The dimensions of the ROI were chosen as large as possible and avoiding partial volume effects and air bubbles generated during preparation of the solutions. For each contrast agent concentration, the mean values of gray levels (HU units) in each ROI were obtained in the different images. The slope of a linear least square fit of the five points (HU vs milligrams per milliliter) gave the calibration factor.
3. Results
Results obtained about the estimation of variability in
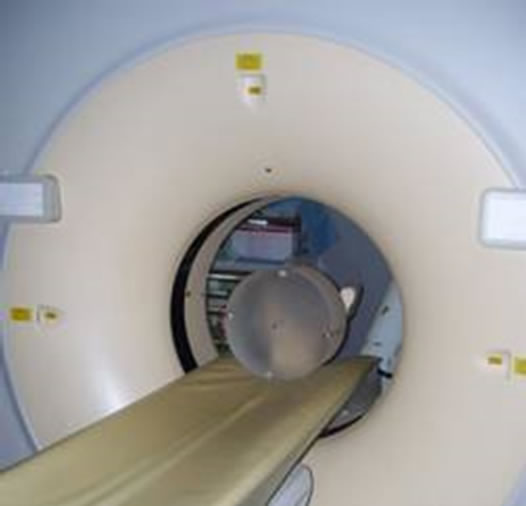
Figure 3. example of phantom positioning into the CT gantry.
BFa evaluation are shown in table 1. They indicate that BFa computation is affected by the different ROI positioning made by the four operators. In fact, we obtained a great variability both among radiologists for the same patient (please, see different µ values along the lines) and among results obtained by the same radiologist on the same patient (please, see s values).
We computed also RSD (table 1) as estimation of variability observer-dependent, obtaining a mean value of 6.7%.
About the calibration procedure, we found that K factor depends on the position in the CT gantry. Obtained statistical parameters are shown in table 2 (RSD less than 3%).
Finally, we have preliminarily estimated SPV index reference values, by computing them from CT perfusion exams in the group of seventeen HCC patients obtaining values in the range 8.0 - 18.3.
4. Discussions
Contrast-enhanced CT, in clinical practice, is frequently considered as the primary mean for assessing the therapeutic response of HCC to loco-regional treatments, especially after the introduction of multislice systems [25-27]. The CT perfusion technique is quickly spreading in the field of oncology since it can be simply incorporated into routine CT protocols, providing precious information about tumour grade and angiogenesis monitoring “in vivo” [1]. However, beneficial, extensive clinical application of perfusion CT requires a reliable use of the technique. In particular, when it is used for monitoring effects of a therapy, the reproducibility of the technique has to be such that the difference between repeated measurements is small compared to the variability due to therapeutic changes [1]. At the moment, there are encouraging preliminary findings about reproducibility of the methodology and intraand inter-observer variability but they regard only some body regions [28], not including the liver.
Software packages involving SPV computation are considered as advantageous in oncological applications [1], but we believe that the first application of SPV index to liver tumour is described here. At the best of our knowledge, in fact, there are no studies about SPV application in HCC patients, although perfusion CT studies are widely used in characterization of liver tumour. We believe that SPV index could be very helpful in liver tumour studies, nevertheless its application in clinical practice requires a preliminary evaluation of its reliability. In this study we wanted to provide details about some limitations of this technique.
Important is, for example, the variability in SPV computation. SPV index, normalised respect to CO and patient’s weight was proposed by Miles [17] to reduce
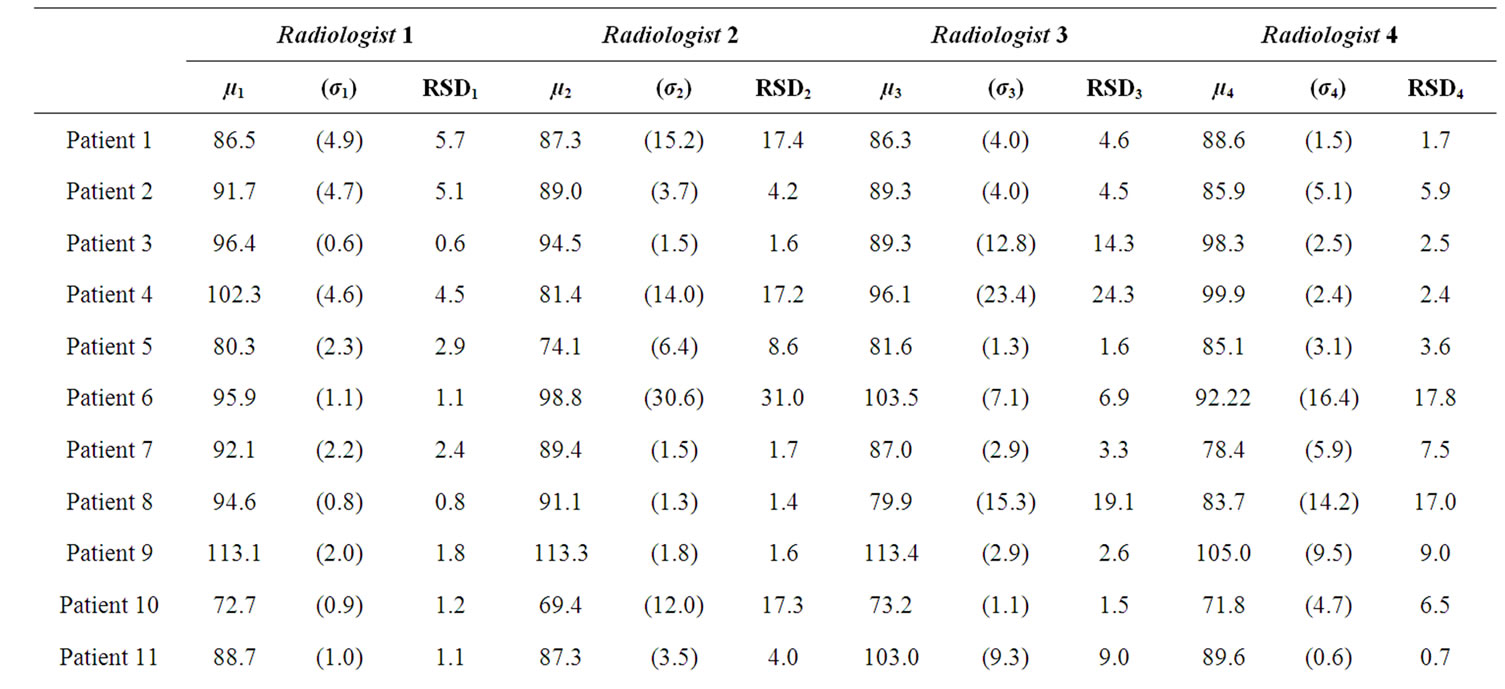
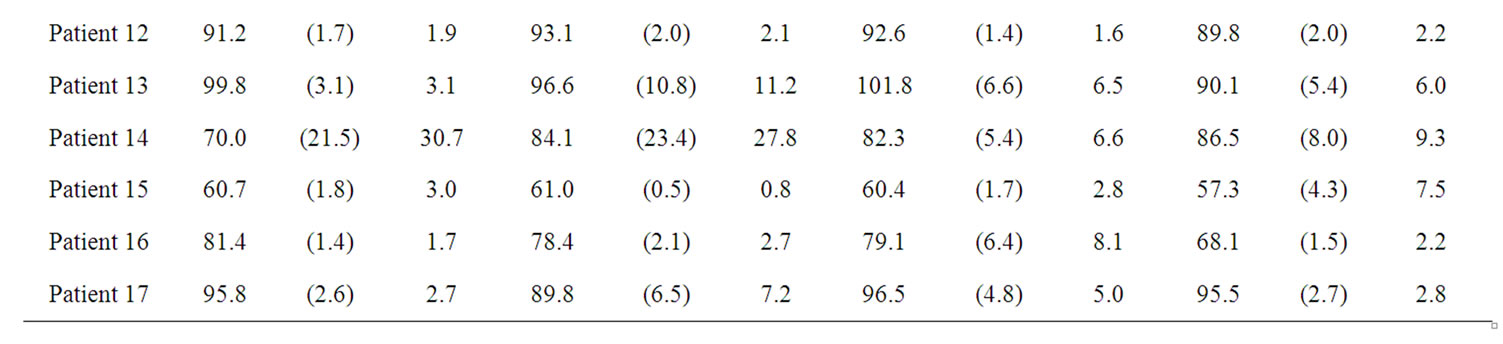
Table 1. results obtained by the four radiologists in BFa estimation shown as average (µ), standard deviation (σ) and coefficient of variation in percentage (RSD).
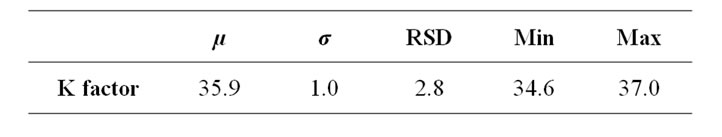
Table 2. statistics of K factor computed by means of the extended calibration procedure implemented by the authors and described in the appendix.
variability relative to these parameters. However, as can be seen from equation (3), there is still variability due to K and BFa calculation.
BFa computation is mainly related to the subjective positioning of the ROI done by a specific operator. Our results are in accordance with other works in which is reported the variability of the perfusion parameter, related to the processing analysis of perfusion image [15, 16].
The positioning of the ROI consists in manually drawing a circular ROI along tumour margins so to allow the software to quantify perfusion values within it. It is crucial that the ROI is placed within tumour margins in all perfusion scan images. By consequence, all images of the study should be carefully analysed, preferably in cine-loop modality, to ensure that the ROI does not extend beyond tumour margins and does not include vessels, air or surrounding adipose tissue in any of them [3]. However, this procedure does not solve problems relative to patient movements during the time of acquisition. In fact, it is very difficult to choose a ROI that remains still on the tumour in each different image. The solution could be the selection of a different ROI for each image; however, this procedure can be boring for the operator, is time consuming and could introduce other sources of variability. Therefore, generally (as done also for this research work), once drawn a ROI, it should be placed in the same position on all the temporal images of the same anatomical level [22]. Because of respiratory misregistration, which represents an important source of error, as reported also by other authors [6], it is possible that the selected ROI can include, in some slices, not only the tumour but also air, bone or normal liver parenchyma.
The calibration of CT systems is a necessary procedure, being the K factor a parameter included in the formula for computing the SPV.
Calibration factor depends on the specific CT system and on the acquisition parameters (KVp, mAs, kernel reconstruction) and changes over time. Some authors [28] proposed to compute K factor for each patient. Others [20] stated that it would be prudent to calibrate the CT system on the same day for each quantitative contrastenhanced study.
However, we consider this recommendation a limit in clinical practice, because of the time needed to calibrate the system. Therefore, in order to verify if it is possible to avoid a complex calibration procedure, we estimated the contribution of K factor variability to the variability of SPV index respect to the variability due to BFa evaluation.
Calibration factor variance, due to the position in the gantry, resulted less than BFa variability (which is more than the double). So, we concluded that, if the daily calibration is preferred, a simplified protocol, which neglects the dependence of K factor from the position, may be utilised.
Otherwise, also according to literature [20], we advice, to keep it on the safe side, that calibration procedure should be repeated about every two weeks for a specific CT system, before that the amount of K factor variation, reported in literature [20], becomes comparable with variability due to BFa estimation, found in our results.
Finally, concerning values of SPV index, we evaluated them in seventeen patients in order to preliminarily verify the accordance between obtained results and the theoretical hypothesis that, being HCC characterised by a higher vascularisation respect to other kinds of tumours, it should show higher SPV values. We retain to have obtained interesting results even though our patients number was not so large and a direct comparison with the SPV values in other organs was not possible. In fact, as expected, we found high SPV values (8.0 - 18.3) that characterize the hyper-vascularised HCC lesion, respect to lung (range 1.13 - 10.36) [18] and breast tumour (range 2.5 - 5.9) [19].
5. Conclusions
The application of SPV index in HCC tumour could have a great potential in the management of HCC patients. However, to ensure the reliability of SPV perfusion index, it is advisable to use always the same acquisition protocol and to calibrate the CT system with the same measurements conditions at least every two weeks. Nevertheless, we have demonstrated that this aspect can be neglected until the intrinsic variability of perfusion parameter computation will be reduced.
In conclusion, we suggest the use of SPV index since CT perfusion provides qualitative assessment of vascularisation and therapeutic effects whereas a quantitative evaluation can be more useful. The use of SPV Index could be a feasible and non-invasive tool in the management and follow up of TACE/TAE, PEI, radiofrequency ablation and radioembolization treatment in HCC patients. This treatments are the most suited in patients with non surgical lesions in early, intermediate and advanced stage [29]. The response to these loco-regional treatments may be evaluated by comparing the difference in SPV values preand post-treatment.
The results of this work represent, in our opinion, an important step in the evaluation of the use of SPV index in liver tumour perfusion studies. However, we aware that the main limitation of our study is the small volume of coverage related to the image CT system. This volume is limited along the z-axis by the number of CT detectors used (e.g. 2.4 cm for our 16-slice CT system). Anyway, 16 slices CT systems are still widely spread and applied in the follow up of HCC patients [30].
6. Acknowledgements
Authors thank Mr. P. Guida for his kind support to image acquisition.
REFERENCES
- K. A. Miles and M. R. Griffiths, “Perfusion CT: A Worthwhile Enhancement?” The British Journal of Radiology, Vol. 76, No. 904, 2003, pp. 220-231. doi:10.1259/bjr/13564625
- D. V. Sahani, N.-S. Holalkere, P. R. Mueller and A. X. Zhu, “Advanced Hepatocellular Carcinoma: CT Perfusion of Liver and Tumor Tissue—Initial Experience,” Radiology, Vol. 243, No. 3, 2007, pp. 736-743. doi:10.1148/radiol.2433052020
- G. Petralia, L. Preda, G. D’Andrea, S. Viotti, L. Bonello, R. De Filippi and M. Bellomi, “CT Perfusion in Solid-Body Tumours. Part I: Technical Issues,” Radiolmed, Vol. 115, No. 6, 2010, pp. 843-857.
- K. A. Miles, “Perfusion CT for the Assessment of Tumour Vascularity: Which Protocol?” The British Journal of Radiology, Vol. 76, No. 1, 2003, pp. S36-S42. doi:10.1259/bjr/18486642
- D. V. Sahani, N. Holalkere and A. X. Zhu, “Role of Perfusion CT in Monitoring Anti-Angiogenic Response in Patients with Advanced Hepatocellular Carcinoma,” Contrast Media and Molecular Imaging, Vol. 1, No. 2, 2006, p. 72. doi:10.1002/cmmi.44
- B. Daniele, I. De Sio, F. Izzo, G. Capuano, A. Andreana, R. Mazzanti, et al., “CLIP Investigators Hepatic Resection and Percutaneous Ethanol Injection as Treatments of Small Hepatocellular Carcinoma: A Cancer of the Liver Italian Program (CLIP 08) Retrospective Case-Control Study,” Journal of Clinical Gastroenterology, Vol. 36, No. 1, 2003, pp. 63-67.
- R. Lencioni, “Loco-Regional Treatment of Hepatocellular Carcinoma,” Hepatology, Vol. 52, No. 2, 2010, pp. 762- 773. doi:10.1002/HEP.23725
- G. Chen, D.-Q. Ma, W. He, B.-F. Zhang and L.-Q. Zhao, “Computed Tomography Perfusion in Evaluating the Therapeutic Effect of Transarterial Chemoembolization for Hepatocellular Carcinoma,” World Journal of Gastroenterology, Vol. 14, No. 37, 2008, pp. 5738-5743. doi:10.3748/wjg.14.5738
- Z. Kan, S. Phongkitkarun, S. Kobayashi, Y. Tang, L. M. Ellis, T. Y. Lee, et al., “Functional CT for Quantifying Tumor Perfusion in Antiangiogenic Therapy in a Rat Model,” Radiology, Vol. 237, No. 1, 2005, pp. 151-158. doi:10.1148/radiol.2363041293
- Z. Kan, S. Kobayashi, S. Phongkitkarun and C. Charnsangavej, “Functional CT Quantification of Tumor Perfusion after Transhepatic Arterial Embolization in a Rat Model,” Radiology, Vol. 237, No. 1, 2005, pp. 144-150. doi:10.1148/radiol.2371040526
- F. X. Bosch, J. Ribes, M. Diaz and R. Cleries, “Primary Liver Cancer: Worldwide Incidence and Trends,” Gastroenterology, Vol. 127, No. 5, 2004, pp. S5-S16.
- K. Okuda, “Natural History of Hepatocellularcarcinoma Including Fibrolamellar and Hepatocholangiocarcinoma Variants,” Journal of Gastroenterology and Hepatology, Vol. 17, No. 4, 2002, pp. 401-405. doi:10.1046/j.1440-1746.2002.02734.x
- C. K. Kim, J. H. Lim, C. K. Park, D. Choi, H. K. Lim and W. J. Lee, “Neoangiogenesis and Sinusoidal Capillarization in Hepatocellular Carcinoma: Correlation between Dynamic CT and Density of Tumor Microvessels,” Radiology, Vol. 237, No. 2, 2005, pp. 529-534. doi:10.1148/radiol.2372041634
- P. V. Pandharipande, G. A. Krinsky, H. Rusinek and V. S. Lee, “Perfusion Imaging of the Liver: Current Challenges and Future Goals,” Radiology, Vol. 234, No. 3, 2005, pp. 661-673. doi:10.1148/radiol.2343031362
- V. Goh, S. Halligan, J. A. Hugill, P. Bassett and C. I. Bartram, “Quantitative Assessment of Colorectal Cancer Perfusion Using MDCT: Interand Intraobserver Agreement,” American Journal of Roentgenology, Vol. 185, No. 1, 2005, pp. 225-231.
- D. Fiorella, J. Heiserman, E. Prenger and S. Partovi, “Assessment of the Reproducibility of Postprocessing Dynamic CT Perfusion Data,” American Journal of Neuroradiology, Vol. 25, No. 1, 2004, pp. 97-107.
- K. A. Miles, M. R. Griffiths and M. A. Fuentes, “Standardized Perfusion Value: Universal CT Contrast Enhancement Scale That Correlates with FDG PET in Lung Nodules,” Radiology, Vol. 220, No. 2, 2001, pp. 548-553.
- K. A. Miles, M. R. Griffiths and C. J. Keith, “Blood Flow-Metabolic Relationships are Dependent on Tumour Size in Non-Small Cell Lung Cancer: A Study Using Quantitative Contrast-Enhanced Computer Tomography and Positron Emission Tomography,” European Journal of Nuclear Medicine and Molecular Imaging, Vol. 33, No. 1, 2005, pp. 22-28. doi:10.1007/s00259-005-1932-7
- A. M. Groves, G. C. Wishart, M. Shastry, P. Moyle, S. Iddles, P. Britton, et al., “Metabolic-Flow Relationships in Primary Breast Cancer: Feasibility of Combined PET/ Dynamic Contrast-Enhanced CT,” European Journal of Nuclear Medicine and Molecular Imaging, Vol. 36, No. 3, 2009, pp. 416-421. doi:10.1007/s00259-008-0948-1
- K. A. Miles, H. Young, S. L. Chica and P. D. Esser, “Quantitative Contrast-Enhanced Computed Tomography: Is There a Need for System Calibration?” European Radiology, Vol. 17, No. 4, 2007, pp. 919-926. doi:10.1007/s00330-006-0424-x
- T. Kobayashi, T. Hayashi, S. Funabasama, S. Tsukagoshi, M. Minami and N. Moriyama, “Three-Dimensional Perfusion Imaging of Hepatocellular Carcinoma Using 256-Slice Multidetector-Row Computed Tomography,” Radiation Medicine, Vol. 26, No. 9, 2008, pp. 557-561. doi:10.1007/s11604-008-0266-3
- M. D’Antò, M. Cesarelli, P. Bifulco, M. Romano, V. Cerciello, F. Fiore, et al., “Study of Different Time Attenuation Curve Processing in Liver CT Perfusion,” Proceedings of the 10th IEEE International Conference on Information Technology and Applications in Biomedicine, Corfù, 3-5 November 2010, pp. 1-4. doi:10.1109/ITAB.2010.5687750
- V. Goh, S. Halligan, A. Gharpuray, D. Wellsted, J. Sundin and C. I. Bartram, “Quantitative Assessment of Colorectal Cancer Tumor Vascular Parameters by Using Perfusion CT: Influence of Tumor Region of Interest,” Radiology, Vol. 247, No. 3, 2008, pp. 726-732. doi:10.1148/radiol.2473070414
- M. J. Siegel, B. Schmidt, D. Bradley, C. Suess and C. Hildebolt, “Radiation Dose and Image Quality in Pediatric CT: Effect of Technical Factors and Phantom Size and Shape,” Radiology, Vol. 233, No. 2, 2004, pp. 515-522.
- F. Fiore, P. Vallone, P. Ricchi, R. Tambaro, B. Daniele, F. Sandomenico, R. De Vivo, C. Civiletti, F. Izzo, S. Pignata and M. Ziviello, “Levovist-Enhanced Doppler Sonography Versus Spiral Computed Tomography to Evaluate Response to Percutaneous Ethanol Injection in Hepatocellular Carcinoma,” Journal of Clinical Gastroenterology, Vol. 36, No. 1, 2003, pp. 63-67.
- H. K. Lim, D. Choi, W. J. Lee, S. H. Kim, S. J. Lee, H. J. Jang, et al., “Hepatocellular Carcinoma Treated with Percutaneous Radio-Frequency Ablation: Evaluation with Follow-Up Multiphase Helical CT,” Radiology, Vol. 221, No. 2, 2001, pp. 447-454. doi:10.1148/radiol.2212010446
- I. R. Kamel, E. Liapi and E. K. Fishman, “Multidetector CT of Hepatocellular Carcinoma,” Best Practice & Research Clinical Gastroenterology, Vol. 19, No. 1, 2005, pp. 63-89.
- K. Takanami, S. Higano, K. Takase, T. Kaneta, T. Yamada, H. Ishiya, et al., “Validation of the Use of Calibration Factors between the Iodine Concentration and the Computed Tomography Number Measured outside the Objects for Estimation of Iodine Concentration inside the Objects: Phantom Experiment,” Radiation Medicine, Vol. 26, No. 4, 2008, pp. 237-243. doi:10.1007/s11604-007-0220-9
- R. Wong and C. Frenette, “Management of Hepatocellular Carcinoma: An Update,” Hepatology, Vol. 53, No. 3, 2011, pp. 16-24.
- D. V. Sahani, N. S. Holalkere, P. R. Mueller and A. X. Zhu, “Advanced Hepatocellular Carcinoma: CT Perfusion of Liver and Tumor Tissue—Initial Experience,” Radiology, Vol. 243, No. 3, 2007, pp. 736-743. doi:10.1148/radiol.2433052020
NOTES
*Corresponding author.
1We deleted the points in which the first derivate is negative or zero, as they are considered as unreliable data. Zero or null slope values are not in agreement with or model, until we’ve reached the maximum point of the TAC curve; contrast enhancement of the tumour needs to necessarily correspond to a continuous increase of the HU signal [22].