Natural Resources
Vol.08 No.10(2017), Article ID:79992,21 pages
10.4236/nr.2017.810039
Performance of an Activated Carbon-Ammonia Adsorption Refrigeration System
Tao Zeng1, Hongyu Huang2*, Noriyuki Kobayashi1*, Jun Li1
1Department of Chemical Engineering, Nagoya University, Nagoya, Japan
2Guangzhou Institute of Energy Conversion, Chinese Academy of Sciences, Guangzhou, China

Copyright © 2017 by authors and Scientific Research Publishing Inc.
This work is licensed under the Creative Commons Attribution International License (CC BY 4.0).
http://creativecommons.org/licenses/by/4.0/


Received: September 1, 2017; Accepted: October 28, 2017; Published: October 31, 2017
ABSTRACT
An experimental study of the adsorption performances of NH3 on several commercial activated carbons was described. Firstly, the specific surface area, pore size distribution and morphological structure of the activated carbons have been characterized by N2 adsorption, Scanning Electron Microscope (SEM), and X-ray diffraction (XRD). The adsorption capacities of four kinds of activated carbons were compared based on adsorption isotherms at 30˚C. Results show that a type of activated carbon MSC30 with high adsorption capacity of NH3 is a promising adsorbent for NH3 because of its large specific surface area and high pore volume. Secondly, the effect of adsorption temperature on the adsorption capacity of NH3 on MSC30 was investigated. A modified Dubinin-Astakhov equation was employed to describe the adsorption isotherms, with the reliability and accuracy evaluation. The isosteric heat of adsorption of MSC30-NH3 as a function of the amount adsorbed was calculated applying the Clausius-Clapeyron equation with isotherms obtained at 20˚C and 30˚C. Thirdly, a packed-bed type adsorber was used to evaluate the influence of cycle time on the system cooling performance (coefficient of performance, specific cooling performance, and volumetric cooling performance) of the MSC30-NH3 pair at the evaporating temperatures of 5˚C, 10˚C and 15˚C with a fixed adsorption/condensing temperature and desorption temperature of 30˚C and 80˚C, respectively. Finally, a long term operation without degradation for MSC30-NH3 adsorption was experimentally demonstrated from the 80 consecutive adsorption-desorption cycles.
Keywords:
Adsorption Refrigeration, Ammonia, Activated Carbon, Adsorption Isotherm, Adsorption Characteristics

1. Introduction
Adsorption refrigeration systems, as one of the promising effective energy conservation techniques and environmentally friendly applications, have been widely studied since the 1970s due to the oil crisis [1] . In comparison to vapor compression refrigeration systems, adsorption refrigeration systems can be driven by low-grade thermal energy sources, such as solar energy, geothermal energy, waste heat from industries/automobiles/fuel cells/combined heat and power systems (CHP) etc., instead of electricity consumed by a compressor, and therefore have large energy conservation potential. Moreover, adsorption refrigeration systems mainly use natural working refrigerants, like water, ammonia and methanol, have the advantage of zero global warming potential and zero ozone depletion potential [2] . Such systems can be applied in a variety of applications, such as air conditioning in buildings or automobiles, process cooling, ice making, food storage, medicine protection, thermal lift and so on. Most of the agricultural, livestock and aquatic products need to be maintained in nutritional and organoleptic qualities, safety (to inhibit the growth and reproduction of bacteria) conditions for relatively long storage life at low temperatures, especially the highly perishable commodities, such as vegetables, meat and fish [3] . Unfortunately, about 20% of the global food supply is lost annually due to lack of preservation facilities or scarcity of electricity. The food losses in developed countries and developing countries are nearly 9% and 23% of the total food production, respectively [4] .
Adsorption refrigeration systems have great potential to tackle the barriers of the places where the electricity supply is difficult (such as the rural areas of developing countries) by using solar energy or the refrigerated transport via the utilization of the waste heat of the engine. Combining a thermally driven refrigeration system with a CHP system, which is defined as combined cooling, heating, and power (CCHP) system, can produce not only power and heating but also cooling simultaneously, with an overall efficiency may reach up to 90% compared to about 35% for the conventional coal-fired power station. Thus CCHP system, exhibits outstanding energy efficiency, economic feasibility and ecological advantage, is a promising integration for application in various sectors. Absorption refrigeration systems are the most successful practical applications of CCHP and studies have been concentrated in lithium bromide-water [5] [6] [7] and water-ammonia [8] [9] absorption refrigeration systems. However, despite the above mentioned advantages and some new small-capacity products are market available in recent years (such as 2.5 kW ENC, 10 kW STJU, 10 kW Mitsubishi Plastics, 13 kW SorTecheZea 10IPS, 4 - 14 kW Invensor LTC 10 e, etc.), there are only a few real application of adsorption refrigeration systems installed in CCHP systems compared with absorption refrigeration systems [10] [11] [12] .
The major challenges that we face are: 1) low coefficient of performance (COP) and 2) low specific cooling power (SCP) or volumetric cooling power (VCP) that make them large volume and weight, due to the low thermal conductivity and low adsorption capacity of adsorbents, and the poor heat and mass transfer performance of the adsorbent beds.
The natural refrigerants like water, ammonia, methanol, and ethanol are commonly used in adsorption refrigeration systems. Due to its high latent heat of evaporation (2258 kJ/kg), water is the most frequently employed refrigerant and often used with silica-gel or zeolite. However, its low vapor pressure and freezing point are the dominant constraints on the application, such as ice making or food storage. Although the latent heat of evaporations of methanol, ethanol, and ammonia (1100 kJ/kg, 838 kJ/kg and 1368 kJ/kg, respectively) are inferior to water, they can be applied to produce sub-zero temperatures on account of their low melting points. Methanol will have decomposition problems when the driving temperatures are higher than 120˚C [13] , while ammonia can remain stable at least 200˚C. This makes it applicable to a wider range of driving temperature, such as the waste heat from the gas turbine of a CHP system or the diesel engine of a fishing boat. Despite ammonia is toxic and its corrosivity prohibits the use of copper, the distinctive pungent odor will make it possible to be detected immediately if leakage happened. Unlike the other three refrigerants that operate at subatmospheric pressure, the high working pressure of ammonia leads to a good mass transfer performance.
Due to the high ability of mass transfer and stable adsorption capacity, activated carbon (AC) is the most commonly used physical adsorbent for ammonia [14] [15] [16] [17] . However, the large internal surface area results in poor thermal conductivity. On the other hand, alkaline-earth metal chlorides, such as CaCl2 [18] , SrCl2 [19] , BaCl2 [20] , are often used as chemical adsorbents for ammonia owing to they have higher adsorption capacity than physical adsorbents, but the swelling and agglomeration behaviors also make them poor heat and mass transfer performance, and the higher driving temperatures are needed in comparison with physical adsorbents. With the purpose of solving the above problems, numerous investigations related to composite adsorbents have been conducted recently. Up to now, the most common type of chemical adsorbent that used to synthesize composite adsorbents is CaCl2, combined with a porous matrix such as alumina [21] , vermiculite [21] , activated carbon [22] [23] , activated carbon fibre [24] , expanded graphite [25] , CaSO4 [26] . Results of these researches shown that higher system performances could be achieved by the use of composite adsorbents as the enhancement of heat and mass transfer. The composite adsorbent can also be composed of a physical adsorbent and a porous matrix. Wang et al. [27] presented a composite consolidated adsorbent that consisted of a granular activated carbon and an expanded natural graphite which was treated with sulfuric acid. They obtained a maximum effective thermal conductivity of 34.2 Wm−1K−1 which was 150 times larger than that of granular AC. Moreover, the equilibrium adsorption capacity of composite adsorbent didn’t change with the addition of porous matrix and had a better desorption performance in comparison with the granular AC.
The objectives of this research are to choose the optimal AC-NH3 pairs and to develop an adsorption refrigeration system with high performances for air conditioning and ice making applications. Firstly the specific surface areas and pore size distributions of ACs were studied, and the SEM and XRD were employed to characterize the morphological structures of the adsorbents. Then the adsorption isotherms of ammonia on several different ACs were investigated. Finally, the system performances (COP, VCP, and SCP) have been tested.
2. Adsorbent
2.1. Characterization of Adsorbent
The selection of appropriate adsorbent is indispensable for an adsorption refrigeration system, and the following factors must be taken into account while selecting adsorbent: high adsorption/desorption capacity, low specific heat, excellent thermal conductivity, compatible with refrigerant, noncorrosive and cost effective, etc. [28] .
The commonly used physical adsorbents for adsorption refrigeration are silica gel, zeolite, and activated carbon. Compare to silica gel and zeolite, activated carbon has high pore volume and large surface area available for adsorption, and is available in many forms, such as powders, granular, carbon-foam, molecular sieves or fiber, etc. Several activated carbons, as furnished in Table 1, have been applied in this research. The specific surface area and pore size distribution of adsorbents have been studied. SEM and XRD have also been employed for an accurate description of the microstructure and morphological structure of the adsorbents.
2.1.1. BET and PSD
The specific surface areas and pore size distributions were measured by N2 adsorption at 77 K, using an automatic adsorption system (ASIQMO002-2, Quantachrome). The samples were degassed at 150˚C for 24 hours to remove surface impurities before the measurements of N2 adsorption isotherms in the relative pressure range between 10−3 and 0.2.
The pore size distributions were calculated by non-local density functional theory model. As indicated in Figure 1 and Table 2, sample 2) - 5) were mainly microporous, particularly, sample 5) contained more than 95% micropores, with the average pore diameter of 0.52 - 1.48 nm. However, there were almost no micropores in sample 6), which was found to be the most mesoporous, with the mean pore diameter of 36 nm and exhibited the lowest BET surface area of among the samples.
Sample 1) had a BET surface area of 3037 m2/g, was much higher than the other samples, and a large porous volume of 1.49 ml/g, showing the possibility of high adsorption of ammonia. Moreover, sample 1) displayed a broad pore size distribution in the range of 0.5 - 4 nm, which indicated the existence of micropores and narrow mesopores (2 - 4 nm), but the micropore volume was only 56.4% due to the presence of massive narrow mesopores.

Table 1. Details of activated carbons.
Table 2. Specification of activated carbons.

Figure 1. Pore size distributions of activated carbons.
2.1.2. SEM
Field Emission Scanning Electron Microscope (JSM-6335F, JEOL Ltd.), giving a resolution of 1.5 mm at 15 kv and 5 nm at 1 kv, was used to characterize the morphological structures of the samples. Observations were carried out at 35× and 1000× magnifications. SEM images of activated carbons are shown in Figure 2.
 (a)
(a)
 (b)
(b)
 (c)
(c)
 (d)
(d)
 (e)
(e)
Figure 2. SEM images of activated carbons. (a) BAC; (b) BA; (c) MSC-30; (d) GA-H; (e) PG-H.
BACs were highly spherical particles, ranged from 50 - 250 µm in size, with a few cracks or visible pore developments appear on the surface, as shown in Figure 2(a). In contrast, the SEM images of the other samples were characterized by heterogeneous structures, demonstrating the presence of irregularly shaped particles with different sizes. The average particle size of BA, GA-H, PG-H, and MSC was about 200, 400, 300, and 90 µm, respectively. Small size particles agglomerations dispersed on large particles can be found in some regions of BA, GA-H, and PG-H.
From the high magnification SEM images, it can be seen clearly that some voids of different sizes were distributed randomly at the surface of MSC30, indicating relatively high specific surface area and a better diffusion of adsorbates than the other samples. This is consistent with the observation from BET.
2.1.3. XRD
XRD was performed for structural identification of the AC on an ESCALAB-210 spectrometer (VG Scientific Ltd.), using AlK α radiation source at 40 kV and 40 mA. The scan speed was 2˚/min with a step size of 0.02 across a range of 20˚ to 80˚. As shown in Figure 3, the activated carbons except for MSC30 exhibited two peaks around 2θ value 26˚ and 44˚, which correspond to the diffraction of (002) and (100)/(101) plane of the graphitic structure, respectively. The broad asymmetric peak at 26˚ indicated that the ACs were amorphous and had a disordered graphitic structure in common. The disappearance of the peak at 26˚ in MSC30, implying that a more disordered graphitic structure than the others and this was greatly related to the substantial increase in the specific surface area according to [29] .

Figure 3. XRD patterns of activated carbons.
2.2. Experimental Apparatus of Adsorption Isotherm
A schematic diagram of volumetric gas adsorption apparatus is shown in Figure 4. The apparatus is mainly composed of three parts: Gas supply system, adsorption system, and gas scrubber system. NH3 with a purity of 99.9998% (Taiyo Nippon Sanso, the Gas Professionals Co. Lt.) and N2 gas with a purity of 99.9998% (Taiyo Nippon Sanso the Gas Professionals Co. Lt.) are supplied by the compressed gas tank. The flows of the two gases are regulated and controlled by commercial mass flow controllers. N2 gas is used to calibrate the system volume and remove the residual ammonia gas in the system. Gas supply system, adsorption system, and gas scrubber system are connected by 316 L stainless tube as shown in Figure 4.
The adsorption system mainly includes sample cell, reference cell, a set of actuated valves (Swagelok DP series), filter and a pressure transducer. The sample cell has an inner volume of 58 ml. A filter (Swagelok SS-4F-2, element nominal pore size: 0.5 µm) is installed right above the sample cell to prevent activated carbon particles from flying out of the sample cell while executing adsorption/desorption and vacuum processes. The volume enclosed by V3, V4, V5, V6, pressure transducer (Swagelok PTU-S series, 6 MPa max, accuracy: ≤0.5% of span) and thermometer (Asone TPT-16150L), is defined as reference volume with a size of 197 ml.
In order to keep this system at the desired temperature, the sample cell and reference cell are located in a thermostatic chamber, and temperature is controlled via the thermostatic water bath (Eyela NCC-2100, with ±0.1˚C - 0.2˚C accuracy of the set point) and is monitored with a platinum resistance thermometer (Asone TPT-16150L) placed at the center of the chamber. The vacuum pump (Asada, Y93539, ultimate pressure 2.0 Pa [abs]) is connected to the system by a flexible stainless steel hose to V7. All the pressure and temperature devices are connected to the data logger (Keysight 34970 A) to monitor and record the results continuously. Due to the corrosivity and toxicity of ammonia, a gas
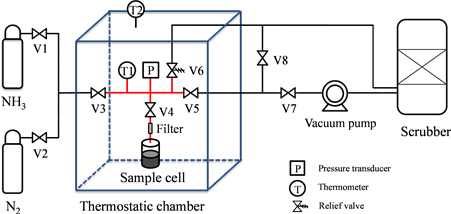
Figure 4. Schematic diagram of the adsorption isotherm apparatus.
scrubber is used to prevent ammonia leakage accident by providing immediate removal of leaking ammonia.
2.3. Experimental Procedures of Adsorption Isotherm
All samples were placed in an electric furnace (Y-1218-N, YAMADA DENKI CO., LTD.) at 120˚C for 24 hours to dry before the experiments of adsorption measuring procedure. Electronic balance (Mettler Toledo AG204, with a minimum display of 0.1 mg) is used to gauge the mass of samples. 0.5 g of dried sample was transferred to the sample cell and then the temperature of the thermostatic chamber was set at 80˚C by using hot water circulation. The entire system was evacuated by the vacuum pump at 80˚C for 5 hours to remove the residual gases from the samples wholly. To minimize the risk of sample particles flying out of the sample cell, the pressure of the sample cell was decreased from atmospheric pressure to 1 Pa step by step, with an interval of about 10 kPa.
After finishing the vacuum process, V7 was closed to isolate the vacuum pump and the temperature of the thermostatic chamber was set at 30˚C. As the system temperature reached 30˚C, all the opened valves were closed. Adjusted the NH3 pressure through the gas cylinder pressure regulator and then opened V1, V3 to allow the NH3 gas flow into the reference cell. Closed V3 and wait until the temperature of the NH3 in reference cell reached the adsorption temperature 30˚C, monitored by thermometer T1. The initial pressure in the reference cell was recorded as P0. V4 was opened slightly allowing NH3 gas in the reference cell to flow into the sample cell, and then the NH3 gas began to adsorb on the surface of the samples partly. The adsorption process was run for 2 hours until it reached the thermodynamic equilibrium state. The equilibrium pressure P1 recorded by data logger was used as a basis to calculate the adsorption capacity. Closed V4 and then repeated the above operations at different initial pressures and equilibrium pressures to achieve an adsorption isotherm at 30°C. To ensure reliable and repeatable experimental results, each sample was tested at least twice with a fresh batch of the sample.
2.4. Experimental Apparatus of System Performance
The experiments to investigate the cooling performance of the MSC30-NH3 pair at different evaporating temperatures and cycle times were conducted in the experimental apparatus is illustrated in Figure 5. This system mainly comprised of an evaporator/condenser (plate type heat exchanger) and an adsorber/desorber (with a finned tubes heat exchanger), both of them were thermally insulated by glass wool to minimize heat dissipation. The temperatures of these instruments were regulated and controlled by thermostatic water baths. And the inlet and outlet temperatures of evaporator/condenser and adsorber/desorber were measured by the platinum resistance thermometers. The system pressures were measured through pressure transducers (Swagelok S Model, with an accuracy of ≤0.5% LPC). The flow sensors (Keyence FD-SS2A, ±1% of F.S) and needle valves were applied to measure and adjust the flow rate of the heat transfer fluid, respectively. The influence of evaporating temperature and cycle time on the system performances were investigated, while the temperature of condenser and desorber were fixed at 30˚C and 80˚C, respectively. The adsorber has a dimension of 347 mm (length) × 142 mm (width) × 34 mm (height), with a volume of 1.68 L.
2.5. Experimental Procedures of System Performance
The adsorber was packed with 66 g MSC30, which had been desiccating in the electric furnace at 120˚C for 24 hours. The adsorbent was overlaid with a stainless steel mesh to avoid adsorbent powders frying out of the adsorbent bed.
For leak detection, opened V2, V4, V5 and V7, adjusted NV3 to control the flow of N2 into the system until the system pressure up to 1.5 MPa, then closed V2 and monitored the system pressure by data logger for one day. After the leak detection, V9 was opened to remove N2 from the system. When the system decreased to atmospheric pressure, opened all valves except V9, the entire system was evacuated by operating the vacuum pump for 24 hours and the adsorber was simultaneously heated by the thermostatic water bath 2 at 80˚C. Closed V8 to

Figure 5. Schematic diagram of the system cooling performance apparatus.
isolate the system from the vacuum pump and waited 12 hours to make sure that no leak occurred. Meanwhile, set the thermostatic water bath 2˚C to 30˚C to cool down the adsorbent bed. Opened V1 and V3 while the other valves were closed, charged a certain amount of NH3 into the evaporator whose temperature was controlled by the thermostatic water bath 1 at 5˚C. Closed V1, V3 and opened V5 to allow NH3 vapor to transfer from evaporator to adsorber. Liquid NH3 started to evaporate in the evaporator by absorbing heat from the circulating chilled water, and thus cooling effect was achieved. NH3 vapor was adsorbed in adsorber, and the heat of adsorption was extracted by 30˚C cooling water which was circulated through thermostatic water bath 2.
After the adsorption process had continued for a particular time (cycle time), V5 was closed, and the temperature of evaporator and adsorber were adjusted to 30˚C and 80˚C respectively. Six different cycle times were investigated in this study. When the condenser and desorber pressure reached to the condensing pressure, opened V5 for the desorption process. The desorbed NH3 gas flowed into the condenser and then was condensed. The cycle time of desorption process was the same as adsorption process. Once the desorption process finished, closed V5 and set the temperature of condenser and desorber to 5˚C and 30˚C respectively. The sensible heat of the adsorber was removed by the cooling water.
After the pressure of evaporator and adsorber reduced to the evaporating pressure, adsorption process was conducted by opening V5 and repeated the operation as mentioned above for the next condition as shown in Table 3. The COP, SCP, and VCP were calculated by the following equations:
(1)
(2)
(3)
where Qc is the cooling heat (kJ), Qs is the sensible heat (kJ), Qdes is the desorption heat (kJ), Δq is the amount adsorbed (kg-adsorbate/kg-adsorbent), τcycle is the cycle time (s), τpre is the preparation time (s), W is the mass of adsorbent (kg), V is the volume of heat exchanger (m3).
3. Results and Discussions
3.1. Adsorption Isothermal
Four kinds of activated-carbon (MSC30, BAC, BA, and CNST) were applied to measure the NH3 adsorption isotherms at 30˚C, and the results are shown in Figure 6. The adsorption of the NH3 on the activated carbons increases with the relative pressure as a consequence of the existence of the more NH3 molecules, or in another word, the NH3 gas diffusion rate is enhanced by increasing the
Table 3. Experimental conditions.

Figure 6. Adsorption isotherms of NH3 on the various activate carbons (30˚C).
pressure. The isotherm shape of MSC30, BAC and BA are similar in general, concave to the relative pressure axis. MSC30 shows a steep uptake up to the relative pressure of about 0.5, revealing that the presence of a broader pore size distribution which including wider micropores and narrow mesopores [30] . Howbeit CNST illustrates a convex curve to the relative pressure axis, which is attributed to its non-microporous property. The adsorption capacity of these four kinds of activated carbons is MSC30 > BAC > BA > CNST at the relative pressure of 0.7, which is strongly related to the specific surface area and the pore volume as summarized in Table 2. Moreover, it is evident that the hysteresis of MSC30 isotherm is minimal.
Due to the excellent adsorption/desorption capacity of NH3, MSC30 is selected for further studies in this paper. The experimental results of NH3 adsorption on MSC30 at the temperature of 20˚C, 30˚C and 40˚C are presented in Figure 7. It shows that the amount adsorbed is higher at lower temperatures under the same equilibrium pressure because the NH3 vapor molecules have much higher internal energy at high temperatures.

Figure 7. Adsorption isotherms of NH3 on MSC30 at different temperatures.
3.2. Adsorption Isotherm Model
The analysis of experimental isotherm results is necessary to establish equation which can describe the results precisely. There are several empirical adsorption isotherms models defined to characterize the experimental data. The most frequently employed models are Langmuir [31] [32] [35] , Freundlich [31] [32] , BET [33] , Dubinin-Raduskevich [34] [35] , and Dubinin-Astakhov [34] [36] .
In this work, the modified Dubinin-Astakhov equation was adopted to evaluate the experimental results. The modified Dubinin-Astakhov equation is given as [37] :
(4)
where q represents the amount adsorbed (kg/kg), q0 is the maximum amount adsorbed (kg/kg), T is the adsorption temperature (K), Tsat is the saturation temperature of refrigerant (K), n and k are coefficients. Equation x can be linearly rewritten in the following form with a logarithmic operation.
(5)
The coefficients of the equation were obtained by the intercept and slope of the linear plot of ln[ln(q0/q)] against ln(T/Tsat−1).Besides, the coefficient of determination (R2) andthe standard error of estimate (SEE) were applied to assess the agreement between the predicted values and experimental results. R2 demonstrates the proportion of variation in y (dependent variable) that is interpreted by x (independent variable), and can be expressed by the following equation [38] :
(6)
where yi is the ith experimental value, is the predicted value, is the mean value of y, the numerator represents the regression sum of squares, and the denominator refers to the total sum of squares. The standard error of estimate (SEE) is an indicator of the accuracy of predicted values, given as:
(5)
where represents the degrees of freedom, is calculated by subtracting the number of parameters in the equation with the number of experimental result points.
Figure 8 exhibits the fitting results of the modified Dubinin-Astakhov equation for MSC30-NH3 at adsorption temperatures of 293, 303, and 313 K. It is clear that the calculated values have good agreement with the experimental values. Table 4 includes the parameters achieved by Equation (4) and the values of R2 and SEE for MSC30-NH3 at different adsorption temperatures.
The constant n gives an estimation of the heterogeneous degree of the adsorbent surface and can be used as an empirical indicator of pore size distribution of adsorbent. It is observed that, in general, for adsorbents with narrow micropore size distribution, such as molecular sieve carbons, n is around 3; for adsorbents whose micropore size distributions are broad, like activated carbons, n is smaller than 3 (varies from 1.2 - 1.8 for strongly activated carbon with heterogeneous micropores); for adsorbents having exceptionally narrow micropore size distribution, like zeolites, n lies between 3 - 6 [39] . The n values obtained in this work were 1.63 - 2.07, indicating that MSC30 has a broad micropore size distribution and is regarded as a heterogeneous adsorbent. These conclusions are in accord with the findings obtained in material characterization. According to the R2 and SEE, it can be inferred that the modified Dubinin-Astakhov equation can describe the adsorption behavior of MSC30-NH3 pair accurately.
3.3. Isosteric Heat of Adsorption
Isosteric heat of adsorption (ΔHads), as one of the critical kinetic study parameters, is an indicator of the interaction strength between the adsorbate and the adsorbent. The Clausius-Clapeyron equation is commonly employed to calculate the ΔHads, and can be written as:
(8)
where R is the universal gas constant; P1 and P2 are the equilibrium adsorption pressures corresponding to the adsorption temperatures of T1 and T2 at the same amount adsorbed, respectively.The ΔHads was computed from the experimentally obtained isotherms at 20˚C and 30˚C, and the result is shown in Figure 9.
Table 4. Characteristic parameter values of Equation (4).

Figure 8. Comparisons between the experimental isotherms and the isotherms calculated by the modified Dubinin-Astakhov equation.

Figure 9. Dependence of the isosteric heat of adsorption on the amount adsorbed.
It is apparent that the isosteric heat of adsorption declined rapidly at the initial stage of adsorption (<0.25 g/g) followed by a gentle change (0.25 g/g - 0.7 g/g) with increasing the amount adsorbed, indicating that the surface of MSC30 is energetically heterogeneous by reason of the existence of different energetic adsorption sites. Higher ΔHads values at the low amount adsorbed demonstrated stronger interactions of NH3 with some high energetic adsorption sites existed on the surface of MSC30. However, there was a marked increase in the high amount adsorbed region (0.83 g/g - 0.85 g/g), which may be attributed to the presence of strong lateral interactions between the adsorbed NH3 molecules [40] [41] . The ΔHads obtained in this study was in the range from 1552 to 2317 kJ/kg, with an average value of 1922 kJ/kg which was a little smaller than those reported in [42] (2000 - 2700 kJ/kg.).
3.4. System Cooling Performance
Figure 10 presents the influence of cycle time on COP at various evaporating temperatures. It is observed that the COP apparently profited from high evaporating temperature. The maximum COP obtained at 5, 10˚C and 15˚C were 0.24, 0.31, and 0.35 respectively. However, as the cycle time increased, the growth of COP at low evaporating temperature was more conspicuous than that at high evaporating temperature. This is because the adsorption rate decreased with the increase of adsorption ratio, which is the ratio of the amount adsorbed to the equilibrium adsorption capacity (can also be regarded as the degree of adsorbent saturation), as illustrated in Figure 11. The decline of adsorption rate resulted in the decreased in the cooling effect.
Figure 12 shows the variation in VCP and SCP versus cycle time at different evaporating temperatures. The two measurements of VCP and SCP were directly proportional to one another and increased with increasing evaporating temperature. The VCP increased from 23.6 to126.9 W/L-heat exchanger, approximately 5.4 times enhancement, when evaporating temperature increased from 5˚C to 15˚C at the cycle time of 300 s; whereas, SCP rose from 112.1 to 602.3 W/kg-absorbent. However, with the increase in cycle time, the influence of evaporating temperature on the VCP and SCP decreased. As can be seen from Figure 12, the VCP and SCP increased with the cycle time when the evaporating temperature at 5 and 10˚C, while decreased at 15˚C. This can also be explained by the adsorption ratio. The high evaporating temperature displayed higher adsorption ratio in the same cycle time, albeit the increase in adsorption ratio was more pronounced for low evaporating temperature with increasing the cycle time. The higher the evaporating temperature, the larger the amount adsorbed that means a greater adsorption heat generated. The heat exchanger could not remove the adsorption heat immediately at 15˚C resulted in the rose in adsorbent temperature which impeded the adsorption kinetics, that’s why the VCP and SCP decreased with increasing the cycle time.
Due to the thickness and the void fraction of the packed bed were only about 10 mm and 0.53 respectively, and the high vapor diffusion of ammonia, the mass

Figure 10. The influence of cycle time on COP at various evaporating temperatures.

Figure 11. The adsorption ratio against cycle time at different evaporating temperatures.
transfer performance was not the primary limiting factor of VCP and SCP. The heat transfer performance of the adsorbent bed and heat exchanger are the key limiting factors to maximum VCP and SCP. We will endeavor to resolve these problems for further study.
3.5. Durability
The durability of adsorbent is an essential factor concerning the development of sustainable and economic adsorption system. In order to analyze the durability

Figure 12. The variation in VCP and SCP versus cycle time at different evaporating temperatures. The solid lines represent the VCPs, while the dashed lines represent the SCPs.
of the MSC30 during the NH3 adsorption/desorption process, the effect of cycle number on adsorption performance of MSC30-NH3 adsorption system was experimentally investigated. 80 consecutive adsorption/desorption cycles with a cycle time of 2000 s were performed by using the apparatus illustrated in Figure 13.
The evaporating, adsorption/condensing and desorption temperature process were performed at 10, 30˚C and 80˚C, respectively. The flow rate of adsorber heat exchanger was set at 600 mL/min, and the inlet and outlet temperatures were measured to calculate volumetric heat generation (W/L-heat exchanger) and amount of heat generation (kJ) of the adsorber. The results of the 1st, 40th, and 80th cycle are shown in Figure x. As can be seen from Figure x, no noticeable reduction in volumetric heat generation and the amount of heat generation was observed after 80 consecutive adsorption-desorption cycles. MSC30 behaves excellent reversibility of NH3 adsorption under the tested conditions. Therefore, this performance could make MSC30 an attractive and promising candidate as the adsorbent for NH3 adsorption refrigeration in the practical application.
4. Conclusions
In this research, an activated carbon-NH3 adsorption refrigeration system with high ability and long durability is proposed. The performance of NH3 refrigeration system at various evaporating temperatures and cycle times were experimentally investigated. The major conclusions can be summarized as follows.
1) MSC30 had an excellent adsorption capacity of NH3 due to it possessed both higher specific surface area and higher pore volume than the other tested activated carbons.
2) The adsorption isotherms of NH3 on MSC30 at 5˚C, 10˚C, and 15˚C could be described by the modified Dubinin-Astakhov equation successfully. The

Figure 13. The effect of cycle number on adsorption performance. The solid lines are the heat output results, while the dashed lines represent the amount of heat generated
n values obtained were 1.63 - 2.07, indicating the existence of a broad micropore size distribution and heterogeneous structure in MSC30.
3) Isosteric heat of adsorption of MSC30-NH3 was evaluated by using the Clausius-Clapeyron equation and was found in the range of 1552 to 2317 kJ/kg (with an average value of 1922 kJ/kg) depending on the amount adsorbed.
4) The cooling performances varied with different evaporating temperatures and cycle times. The COP, VCP, and SCP increased as the evaporating temperature decreased. However, it is hard to satisfy both COP and VCP/SCP at the same cycle time. The COP, VCP, and SCP obtained were 0.35, 109 W/L-heat exchanger, and 520 W/kg-absorbent, respectively, at the condition of 15˚C and 600 s. Results indicated that the system needs improvement on the heat transfer performance in the adsorbent packed bed and the heat exchanger.
5) A long term operation without degradation for MSC30-NH3 adsorption/de- sorption process was experimentally demonstrated from the repetition operations, showing the MSC30-NH3 is a promising pair for adsorption refrigeration system.
Cite this paper
Zeng, T., Huang, H.Y., Kobayashi, N. and Li, J. (2017) Performance of an Activated Carbon-Ammo- nia Adsorption Refrigeration System. Natural Resources, 8, 611-631. https://doi.org/10.4236/nr.2017.810039
References
- 1. Goyal, P., Baredar, P., Mittal, A. and Siddiqui, A.R. (2016) Adsorption Refrigeration Technology—An Overview of Theory and Its Solar Energy Applications. Renewable and Sustainable Energy Reviews, 53, 1389-1410.
- 2. Sah, R.P., Choudhury, B. and Das, R.K. (2016) A Review on Low Grade Heat Powered Adsorption Cooling Systems for Ice Production. Renewable and Sustainable Energy Reviews, 62, 109-120.
- 3. Stonehouse, G.G. and Evans, J.A. (2015) The Use of Supercooling for Fresh Foods: A Review. Journal of Food Engineering, 148, 74-79.
- 4. IIR (2009) 5th Informatory Note on Refrigeration and Food “The Role of Refrigeration in Worldwide Nutrition.http://www.iifiir.org/userfiles/file/publications/notes/NoteFood_05_EN.pdf
- 5. Yang, M., Lee, S.Y., Chung, J.T. and Kang, Y.T. (2017) High Efficiency H2O/LiBr Double Effect Absorption Cycles with Multi-Heat Sources for Tri-Generation Application. Applied Energy, 187, 243-254.
- 6. Wang, Z., Han, W., Zhang, N., Liu, M. and Jin, H. (2017) Proposal and Assessment of a New CCHP System Integrating Gas Turbine and Heat-Driven Cooling/Power Cogeneration. Energy Conversion and Management, 144, 1-9.
- 7. Mohan, G., Kumar, U., Pokhrel, M.K. and Martin, A. (2016) Experimental Investigation of a Novel Solar Thermal Polygeneration Plant in United Arab Emirates. Renewable Energy, 91, 361-373.
- 8. Chitsaz, A., Hosseinpour, J. and Assadi, M. (2017) Effect of Recycling on the Thermodynamic and Thermoeconomic Performances of SOFC Based on Trigeneration Systems; A Comparative Study. Energy, 124, 613-624.
- 9. Moya, M., Bruno, J.C., Eguia, P., Torres, E., Zamora, I. and Coronas, A. (2011) Performance Analysis of a Trigeneration System Based on a Micro Gas Turbine and an Air-Cooled, Indirect Fired, Ammonia-Water Absorption Chiller. Applied Energy, 88, 4424-4440.
- 10. Grisel, R.J.H., Smeding, S.F. and Boer, R. (2010) Waste Heat Driven Silica Gel/Water Adsorption Cooling in Trigeneration. Applied Thermal Engineering, 30, 1039-1046.
- 11. Chorowski, M. and Pyrka, P. (2015) Modelling and Experimental Investigation of an Adsorption Chiller Using Low-Temperature Heat from Cogeneration. Energy, 92, 221-229.
- 12. Kong, X.Q., Wang, R.Z., Wu, J.Y., Huang, X.H., Huang fu, Y., Wu, D.W. and Xu, Y.X. (2005) Experimental Investigation of a Micro-Combined Cooling, Heating and Power System Driven by a Gas Engine. International Journal of Refrigeration, 28, 977-987.
- 13. Hu, E.J. (1998) A Study of Thermal Decomposition of Methanol in Solar Powered Adsorption Refrigeration Systems. Solar Energy, 62, 325-329.
- 14. Tamainot-Telto, Z., Metcalf, S.J., Critoph, R.E., Zhong, Y. and Thorpe, R. (2009) Carbon-Ammonia Pairs for Adsorption Refrigeration Applications: Ice Making, Air Conditioning and Heat Pumping. International Journal of Refrigeration, 32, 1212-1229.
- 15. Hirota, Y., Kobayashi, N., Watanabe, F., Hasatani, M., Uda, S. and Inaoka, H. (2008) Development of the Adsorber in the Ammonia and AC Combination Adsorption Heat Pump. Journal of Japan Society of Energy and Resources, 29, 35-41. http://www.jser.gr.jp/journal/journal_pdf/2008/journal200805_6.pdf
- 16. Sadhikh, M. and Skaria, J.J. (2016) Development of Waste Heat Fired Activated Carbon Ammonia Adsorption Chiller. International Journal of Thermal and Environmental Engineering, 11, 131-135.
- 17. Wójtowicz, M.A., Cosgrove, J.E. and Serio, M.A. (2015) Adsorption of Ammonia on Regenerable Carbon Sorbents. 45th International Conference on Environmental Systems, Washington, ICES-2015-179.
- 18. Pal1, M., Boer, R. and Veldhuis, J. (2013) Experimental Setup for Determining Ammonia-Salt Adsorption and Desorption Behavior under Typical Heat Pump Conditions: Experimental Results. International Symposium on Innovative Materials for Processes in Energy Systems, Fukuoka, IMPRES2013-084.
- 19. Ammitzb?ll, A.L., Lysgaard, S., Klukowska, A., Vegge, T. and Quaade, U.J. (2013) Surface Adsorption in Strontium Chloride Ammines. The Journal of Chemical Physics, 138, Article ID: 164701. https://doi.org/10.1063/1.4800754
- 20. Duenas, C., Pilatowskya, I., Romeroa, R.J., Oskama, A. and Finck, P.A. (2001) Dynamic Study of the Thermal Behavior of Solar Thermochemical Refrigerator: Barium Chloride-Ammonia for Ice Production. Solar Energy Materials and Solar Cells, 70, 401-413.
- 21. Sharonov, V.E., Veselovskaya, J.V. and Aristov, Y.I. (2006) Ammonia Sorption on Composites “CaCl2 in Inorganic Host Matrix”: Isosteric Chart and Its Performance. International Journal of Low-Carbon Technologies, 1, 191-200.
- 22. Chen, C.J., Wang, R.Z., Wang, L.W. and Lu, Z.S. (2007) Studies on Cycle Characteristics and Application of Split Heat Pipe Adsorption Ice Maker. Energy Conversion and Management, 48, 1106-1112.
- 23. Goshayeshi, H.R., Gewad, M. and Nazari, H. (2015) Investigation on Evaluation of a Solar Intermittent Refrigeration System for Ice Production with Ammonia/Calcium Chloride and Activated. Energy and Power Engineering, 7, 433-439. https://doi.org/10.4236/epe.2015.710042
- 24. Tokarev, M.M. (2010) Novel Ammonia Sorbents “Porous Matrix Modified by Active Salt” for Adsorptive Heat Transformation: 2. Calcium Chloride in ACF Felt. Applied Thermal Engineering, 30, 845-849.
- 25. Li, S.L., Xia, Z.Z., Wu, J.Y., Li, J., Wang, R.Z. and Wang, L.W. (2010) Experimental Study of a Novel CaCl2/Expanded Graphite-NH3 Adsorption Refrigerator. International Journal of Refrigeration, 33, 61-69.
- 26. Wang, L., Chen, L., Wang, H.L. and Liao, D.L. (2009) The Adsorption Refrigeration Characteristics of Alkaline-Earth Metalchlorides and Its Composite Adsorbents. Renewable Energy, 34, 1016-1023.
- 27. Wang, L.W., Metcalf, S.J., Critoph, R.E., Thorpeb, R. and Tamainot-Telto, Z. (2012) Development of Thermal Conductive Consolidated Activated Carbon for Adsorption Refrigeration. Carbon, 50, 977-986.
- 28. Wolak, E. and Kraszewski, S. (2016) An Overview of Adsorptive Processes in Refrigeration Systems. 1st International Conference on the Sustainable Energy and Environment Development, Poland.
- 29. Yang, S.B., Hu, H.Q. and Chen, G.H. (2002) Preparation of Carbon Adsorbents with High Surface Area and a Model for Calculating Surface Area. Carbon, 40, 277-284.
- 30. Thommes, M., Kaneko, K., Neimark, A.V., Olivier, J.P., Rodriguez-Reinoso, F., Rouquerol, J. and Sing, K.S. (2015) Physisorption of Gases, with Special Reference to the Evaluation of Surface Area and Pore Size Distribution (IUPAC Technical Report). Pure and Applied Chemistry, 87, 1051-1069. https://doi.org/10.1515/pac-2014-1117
- 31. Dada, A.O., Olalekan, A.P., Olatunya, A.M. and Dada, O. (2012) Langmuir, Freundlich, Temkin and Dubinin-Radushkevich Isotherms Studies of Equilibrium Sorption of Zn2+ Unto Phosphoric Acid Modified Rice Husk. IOSR Journal of Applied Chemistry, 3, 38-45. https://doi.org/10.9790/5736-0313845
- 32. Ebrahimian, A., Saberikhah, E., Emami, M.S. and Sotudeh, M. (2014) Study of Biosorption Parameters: Isotherm, Kinetics and Thermodynamics of Basic Blue 9 Biosorption onto Foumanat Tea Waste. Cellulose Chemistry Technology, 48, 735-743.
- 33. Rangabhashiyam, S., Anu, N., Giri, N. and Selvaraju, N. (2014) A Novel Approach of the Modified BET Isotherm towards Continuous Column Study. Journal of Scientific and Industrial Research, 73, 489-494.
- 34. Saeidi, N. and Parvini, M. (2016) Accuracy of Dubinin-Astakhov and Dubinin-Radushkevich Adsorption Isotherm Models in Evaluating Micropore Volume of Bentonite. Periodica Polytechnica Chemical Engineering, 60, 123-129.
- 35. Chen, L., Jiang Z.X., Liu K.Y., Ji, W.M., Wang, P.F., Gao, F.L. and Hu, T. (2017) Application of Langmuir and Dubinin-Radushkevich Models to Estimate Methane Sorption Capacity on Two Shale Samples from the Upper Triassic Chang 7 Member in the Southeastern Ordos Basin, China. Energy Exploration and Exploitation, 35, 122-144. https://doi.org/10.1177/0144598716684309
- 36. Singh, V.K. and Anil Kumar, E. (2017) Experimental Investigation and Thermodynamic Analysis of CO2 Adsorption on Activated Carbons for Cooling System. Journal of CO2 Utilization, 17, 290-304.
- 37. Tamainot-Telto, Z. and Critoph, R.E. (1997) Adsorption Refrigerant using Monolithic Carbon-Ammonia Pair. International Journal of Refrigeration, 20, 146-155.
- 38. Cornell, J.A. and Berger, R.D. (1987) Factors That Influence the Value of the Coefficient of Determination in Simple Linear and Nonlinear Regression Models. Phytopathology, 77, 63-70. https://doi.org/10.1094/Phyto-77-63
- 39. Do, D.D. (1998) Adsorption Analysis: Equilibria and Kinetics. Imperial College Press, London.
- 40. Sircar, S. and Rao, M.B. (1999) Surfaces of Nanoparticles in Porous Materials. In: Schwarz, J.A. and Contescu, C., Eds., Marcel and Dekker, New York, 501-518.
- 41. Julis, J. (1975) Differential Heats of Adsorption. Chemicke zvesti, 29, 653-659.
- 42. Wolak, E. and Kraszewski, S. (2016) An Overview of Adsorptive Processes in Refrigeration Systems. 1st International Conference on the Sustainable Energy and Environment Development, Vol. 10, 00104.