Natural Resources
Vol.08 No.08(2017), Article ID:78106,18 pages
10.4236/nr.2017.88032
Characterization and Modeling of Urban Water Quality in the City of Calgary, Canada
Dhiraj Shrestha, Jianxun He*
Civil Engineering, Schulich School of Engineering, University of Calgary, Calgary, Canada

Copyright © 2017 by authors and Scientific Research Publishing Inc.
This work is licensed under the Creative Commons Attribution International License (CC BY 4.0).
http://creativecommons.org/licenses/by/4.0/


Received: May 30, 2017; Accepted: July 31, 2017; Published: August 2, 2017
ABSTRACT
Non-point source pollution (NPS) besides point source pollution (PS) has contributed to pollutant loading into natural receiving water bodies. Due to the nature of NPS, the quantification of pollutant loading from NPS is very challenging but crucial to riverine water quality management, especially for the river reach flowing through urban areas. The water quality in the river reach of the Bow River flowing through the City of Calgary in Alberta, Canada, is affected by both PS and NPS. Thus, understanding and characterizing water quality of discharges (affected by NPS) into the river reach is necessary for better managing riverine water quality and preventing water quality degradation. In the paper, monitored event mean concentrations (EMCs) of stormwater runoff and mean concentrations of snowmelt and baseflow of seven common pollutants from sub-catchments, which are categorized into four land use types including commercial, industrial, residential and on-going development land uses, were used to investigate the linkage between land use and water quality. Statistical analysis techniques were adopted to identify differences or similarities in water quality among different flow types, different land use types, and among/between catchments of same land use. The results indicated that EMCs of many water quality parameters vary among different land use types and among/between catchments of same land use. The results also showed median EMCs of pollutants of snowmelt and baseflow are, in general, lower than those of stormwater runoff. In addition, Stormwater Management Model was employed to investigate the physical process that would affect water quality response to storm events for two typical land uses, industrial and residential land uses. The modeling results supported that wash-off of particulate matters might primarily affect water quality response of catchments between different land uses. All the results shed the light on the necessity of quantifying pollutant loading considering the characteristics of land uses.
Keywords:
Stormwater Runoff, Event Mean Concentration, Land Use, Statistical Analysis, Stormwater Management Modeling

1. Introduction
Urbanization occurring across the world alters urban hydrologic cycle and it largely increases water quantity due to the increase of impervious area, such as roads, parking lots, and rooftops. On the other hand, urbanization also affects generation and mobilization of both point source and non-point source pollutants from urban settings. Therefore, urbanization can lead to the increase of water quantity and the degradation of water quality of natural receiving water bodies [1] [2] [3] . Furthermore, the increases of peak flow, flow volume, and flow velocity are found to be associated with deterioration of water quality downstream [4] .
Owing to the recent rapid urbanization, water discharged from urban settings has attracted more attention in water management. Water released from stormwater drains of a typical urban area/catchment includes baseflow, snowmelt and stormwater runoff. Stormwater runoff and snowmelt are discharges from storm drains resulting from storm and snowmelt events, respectively; while baseflow is the discharge accounting for groundwater seeping into stormwater drains and surface water connected to storm drains. The different types of flow all contribute pollutant loading from nonpoint pollution sources (NPS). Among these flow types, stormwater runoff has been claimed to be one of the most common sources of water pollution, for example in U.S. [5] . An urban setting always composes of different land use types to accommodate various anthropogenic activities. Stormwater runoff from different types of land use has been shown to have little to no similarity in terms of pollutant concentrations [6] [7] [8] . In addition, reference [9] stated that urban stormwater from catchments with similar land use type and percentage of impervious area also shows large variations in pollutant concentrations. Similarly, water quality of baseflow and snowmelt is expected to be associated with land use characteristics.
A large body of studies (e.g., [7] [9] ) have been conducted to characterize the quality of stormwater runoff through analyzing data collected from stormwater monitoring systems. In addition, modeling of stormwater runoff is needed to develop preventive measures to control the runoff downstream and to mitigate and reduce the impact of urbanization on stormwater [1] . Among various models available, Stormwater Management Model (SWMM), which is a physically based hydrological model developed by U.S. EPA, is one of most commonly used modeling tools for urban stormwater runoff. SWMM has been often applied to simulate both quantity and quality of stormwater runoff ranging from urban drainage to flood routing [10] [11] [12] . It has been used in numerous watersheds in Canada, U.S., and other part of the world [11] [13] [14] . Modeling of stormwater runoff quality is very challenging due to the fact of the complexity of the processes governing the pollutant buildup and wash-off and transport from land surface. The buildup of pollutants is associated with the anthropogenic activities occurring in catchments; whereas the wash-off of pollutants deposited on land surface is primarily dependent on the hydrologic factors (such as rainfall intensity and runoff rate), physical characteristics of pollutants (e.g., size) as well as geophysical characteristics [15] . The modeling approach is thus a useful tool to investigate which process predominantly governs stormwater runoff quality.
The City of Calgary, Alberta, Canada, which has a separate storm sewer system, has put efforts to quantify pollutant loading discharged into the Bow River at a city-wide scale aiming to understand and consequently formulate strategies to prevent water quality degradation in the river. To achieve the goal, Calgary has developed a monitoring program, which targets to understand water quality of different types of flow including baseflow, snowmelt and stormwater runoff from storm drains in catchments of various land uses. Considering the cost, resources, and time required by a monitoring program to cover the entire city, modeling tool has been considered to compensate the limitations of monitoring. Therefore, the two-fold objectives of this paper were to: 1) investigate the differences/or similarities in water quality concentrations of three flow types (baseflow, snowmelt, and stormwater runoff) from catchments of different land uses; and 2) use modeling approach to study which process (either pollutant buildup and/or wash-off) might largely affect the quality of stormwater runoff for catchments of different land uses. All the results would shed light on how to accurately quantify and thus efficiently mitigate pollutant loading from urban settings.
2. Material and Methods
2.1. Water Monitoring Program
The City of Calgary is located in the transition between the Canadian Rockies Foothills and the great Prairies. The City is bounded between 113˚54'54"W and 114˚16'34''W and between 50˚50'38''N and 51˚12'44''N. It is recognized as Canadian hub for oil and gas industry. The City is one of the most fast growing cities in Canada with a population of 1.23 million currently and the most populated community centre in Alberta. The City is situated on the confluence of the Bow and Elbow Rivers. These two rivers supply water to more than one million populations residing in the City. The Bow River also supports the blue ribbon fishery. To protect the water quality of the river, the City of Calgary has conducted water monitoring in the last decades. To fulfill the objectives of the paper, the data sets collected by the water monitoring program during 2001-2005 were selected and revisited because: 1) water quality was monitored in three types of flow (baseflow, snowmelt, and stormwater runoff) separately; and 2) monitoring was conducted in catchments of four typical types of urban land use including residential, industrial, commercial, and on-going development land uses. Considering the data availability, several sub-catchments were selected from the monitoring program for each land use type: two commercial sub- catchments (Eau Claire and Rundle), two industrial sub-catchments (Bonnybrook and Wigmore East), three on-going development sub-catchments (69th St. West, Cranston, and Crestmont West), and five residential sub-catchments (68th St. East, 68th St. West, 69th St. East, Rocky Ridge Inlet, and McKenzie Towne). Note that the land use categorization is based on the dominant land use of the sub-catchments. The locations of the monitoring sites shown in Figure 1 were situated at the outlet of the sub-catchments. In the monitoring program, event mean concentrations (EMCs) of stormwater runoff of seven common water quality parameters including total suspended solids (TSS), total phosphorus (TP), total dissolved phosphorus (TDP), ammonia nitrogen ( -N), nitrate/nitrite nitrogen (NO2‾/NO3‾-N), total Kjeldahl nitrogen (TKN), and biochemical oxygen demand (BOD) were measured; while mean concentrations of above mentioned common parameters were reported for both baseflow and snowmelt. TP, TDP and TKN were measured using continuous flow analyzer (CFA); while NO2‾/NO3‾-N and
  -N were assayed using either CFA or ion chromatography method. TSS was measured using gravimetric method and

Figure 1. Study area and locations of water monitoring sites.
5-day BOD was determined in accordance with Standard Methods. At the 12 selected sub-catchments, EMCs of the water quality parameters were reported in a total of 570 storm events, 166 snowmelt events, and 321 baseflow events during the monitoring program. Considering the less variation in the quantities of baseflow and snowmelt, their mean concentrations were considered equivalent to EMCs. Thus, the terminology of EMC was used for all three types of flow throughout the paper for convenience.
When monitoring stormwater runoff, discrete samples were collected up to five hours in each storm. Water samples were composited and EMCs were reported in three phases in an event: first flush (FF) in the first 30 minutes, first remainder of the event (ROE1) in the following 2.25 hours, and second remainder of the event (ROE2) in the another 2.25-hour duration. Note that if a storm is shorter than five hours, ROE1 and/or ROE2 were absent. EMCs for an event were calculated using the reported EMCs in the three phases based on the flow-weighted average approach. Baseflow was manually sampled and water quality was reported as average concentrations during a dry period. Similar to baseflow, water samples of snowmelt were collected manually and average water quality was reported during a snowmelt event. In the presence of baseflow and snowmelt at the outlets of the sub-catchments, one to five samples per month were collected.
2.2. Statistical Analysis
Statistical analysis was conducted to investigate the differences/or similarities in water quality of different types of flow from catchments of different types of land use. Non-parametric statistical analysis was selected since water quality datasets are not normally distributed according to the Kolmogorov-Smirnov test as expected. To compare two or more than two water quality datasets, Wilcoxon rank sum test and Kruskal-Wallis (K-W) test followed by multiple comparisons were applied. All these analyses were performed at the significance level of 5%.
2.3. Stormwater Runoff Modeling
One of popular modeling tools for urban stormwater runoff is SWMM, which is applicable for both event-based and continuous simulation. Details on the model can be found in reference [10] . In the paper, SWMM was applied to conduct event-based modeling. In the event-based modeling, Green-Ampt equation was used to simulate infiltration. As there are many parameters in SWMM which can affect stormwater runoff quantity, sensitivity analysis was conducted before model calibration to determine the parameters to be calibrated. The model calibration approach proposed by reference [16] was adopted to calibrate SWMM model for both stormwater runoff quantity and quality (here TSS). The model calibration was conducted in three steps: 1) manually calibrating the model for each calibration event individually; 2) averaging the calibrated model parameters obtained from all calibration events; and 3) using the averaged model parameters to simulate all storm events and quantify the errors. In the model calibration, both stormwater runoff volume and peak flow were selected to evaluate the model in simulating water quantity; while EMC of TSS was used to assess the model performance in modeling TSS. The calibrated model parameters were then used in the model validation on the remaining storm events which were not used in the model calibration.
The calibration for stormwater runoff quantity was preceded with the calibration of stormwater runoff quality. In the model calibration for TSS, the parameters/or coefficients for sediments buildup and wash-off were determined. In the SWMM, the buildup and wash-off processes of sediments were modeled using exponential functions, which have been commonly adopted to model TSS in practices (e.g., [11] [13] ). The equations of buildup (B) and wash-off (W) of solid pollutants are given as follows
 (1)
(1)
 (2)
(2)
where C1 is the maximum possible buildup (mass/area); C2 is the buildup rate constant (1/day); and t denotes the time to accumulate pollutants; Cw1 and Cw2 are the wash-off coefficient and exponent, respectively; q is runoff rate per unit area.
3. Results and Discussion
3.1. Water Quality in Different Types of Flow
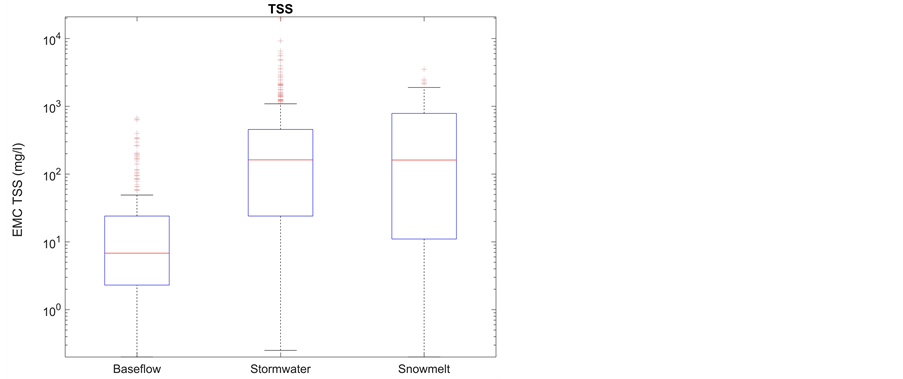
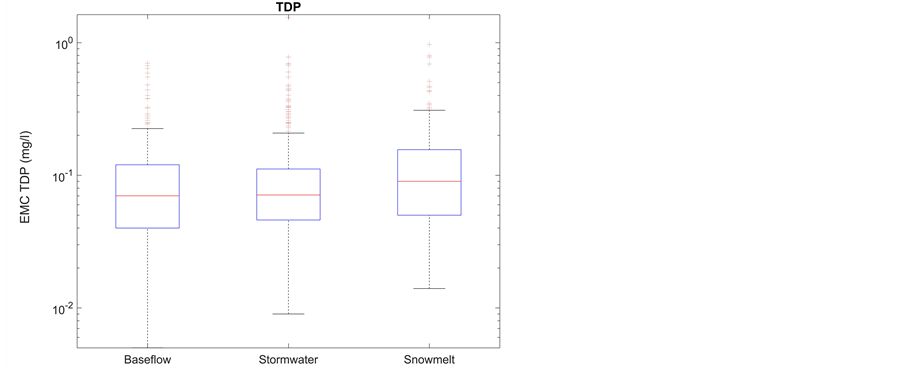
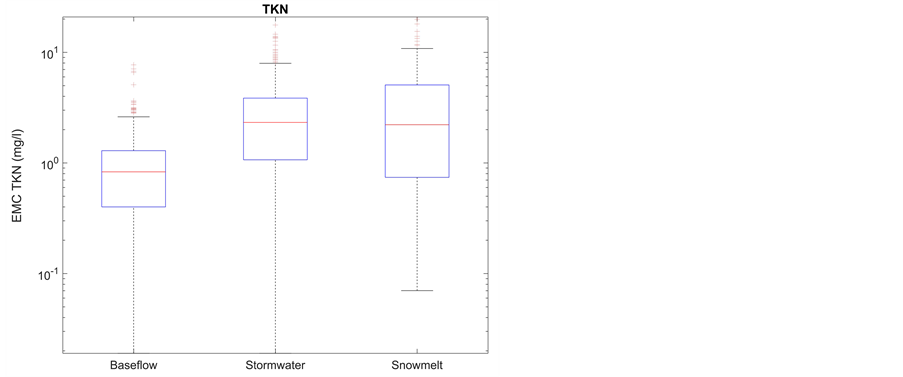
Figure 2 shows the box-whisker plots of the pooled EMCs (all 12 monitoring sites) for each water quality parameter of stormwater runoff, baseflow, and snowmelt, respectively. The median EMCs of these water quality parameters (except TDP and NO2‾/NO3‾-N) in stormwater runoff and snowmelt were found to be significantly higher than those in baseflow from the K-W test; while in general, no significant differences in the median EMCs of the water quality
 (a)
(a)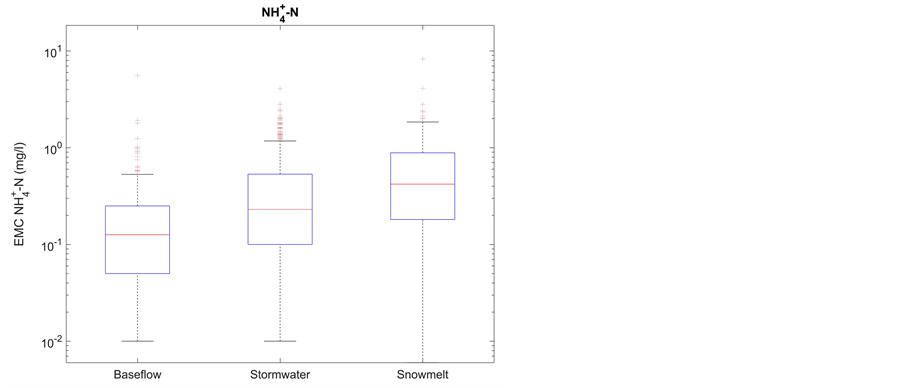
 (b) (c)
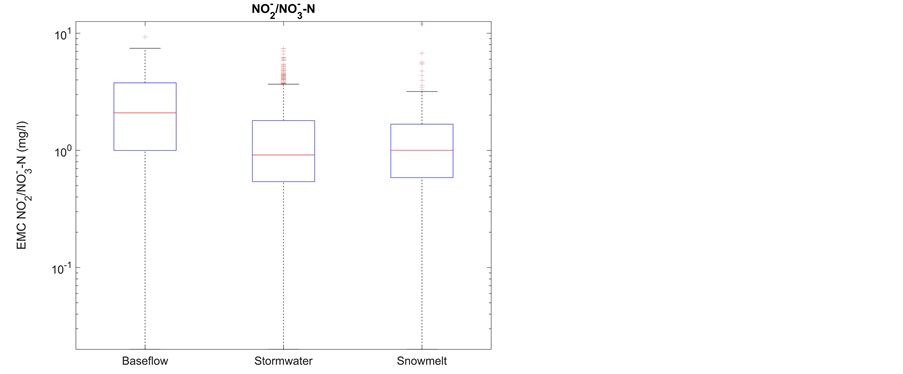
 (d) (e)
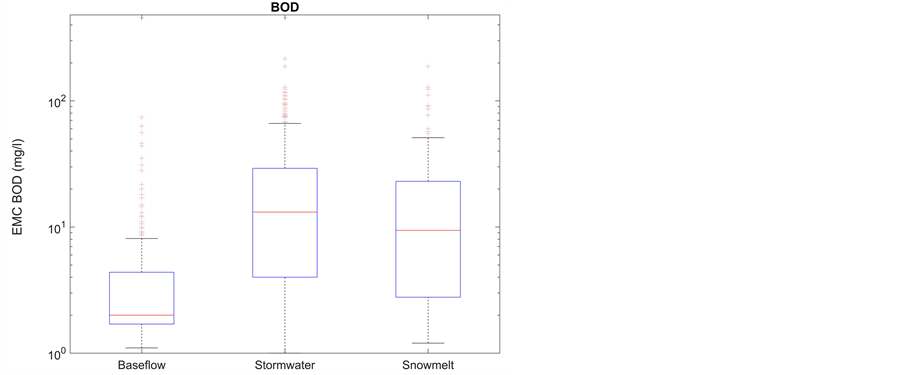
 (f) (g)
Figure 2. Box-whisker plots of EMCs of stormwater runoff (stormwater), baseflow and snowmelt.
parameters (except TDP and  -N) were tested between stormwater runoff and snowmelt. The median EMC of TDP of snowmelt was significantly higher than that of baseflow and stormwater runoff; while the median EMC of NO2‾/ NO3‾-N of baseflow was significantly higher than that of snowmelt and stormwater runoff. Significant differences among the three types of flow were only detected in the EMC of
  -N, which is significantly highest in snowmelt and significantly lowest in baseflow. The comparison among three types of flow indicated that the water quality level is equivalent between stormwater runoff and snowmelt and the water quality of baseflow is better than that of stormwater runoff and snowmelt in terms of EMCs of many investigated water quality parameters. The result that TP level is higher in stormwater runoff than that in baseflow obtained in the paper is consistent with the results of reference [17] ; whereas the result is contradictory to that observed by reference [18] , which concluded that levels of TP along with total nitrogen (TN) are higher in snowmelt instead. Thus it can be concluded that water quality level could be regional-specific, namely largely affected by regional/local conditions.
3.2. Water Quality of Different Types of Land Use
Given a flow type, the water quality data from the sub-catchments were pooled together according to land use type. A comparison of EMCs for sub-catchments with different types of land use was then conducted for each flow type. In the analysis, the EMCs of FF of storm events were used considering that the EMCs of FF are significantly higher than those of ROE1 and ROE2 and the initial stormwater runoff during a storm event is often of great interest for managing urban stormwater runoff. The analysis results are presented in Table 1, which summarizes the detected significant differences among four different types of land use for each type of flow. The median EMCs of TSS of on-going development land use are significantly higher than those of other three types of land use for all three types of flow; while in general, the median EMCs of TSS are equivalent in all flow types for commercial, industrial and residential land uses (except

Table 1. Comparison of water quality levels among land use types given a flow type using Kruskal-Wallis test (Symbols <, > and = denote significantly high, significantly low, and no significant difference, respectively. Com, Ind, Dev and Res denote commercial, industrial, on-going development and residential land uses, respectively).
the significant difference between residential and commercial land uses). As for other water quality parameters, the qualitative relationships between water quality levels and land uses (e.g., in terms of the order of the land uses) appear to vary among the three types of flow. For instance, the median EMCs of TP is highest for commercial land use in baseflow; whereas it was reported to be highest for on-going development land use in both stormwater FF and snowmelt. A previous study by reference [18] concluded that median EMCs of investigated water quality parameters of stormwater runoff are significantly different among different land use groups, which are categorized based on land use characteristics and catchment area. However a study by reference [19] did not found statistically significant differences in EMCs of stormwater runoff quality among various land uses studied.
Given a type of land use, the EMCs were pooled according to flow type and the comparison results from the K-W test for each water quality parameter among the three flow types are summarized in Table 2. In general, EMCs of
Table 2. Comparison of EMCs of water quality parameters among three types of flow given a land use type using Kruskal-Wallis test (Symbols <, > and = denote significantly high, significantly low, and no significant difference, respectively. “Base”, “Melt”, and FF” stand for baseflow, snowmelt, and stormwater runoff FF, respectively).
stormwater runoff FF and snowmelt are significantly higher than those of baseflow for all water quality parameters except the dissolved constituents including  -N, TDP and NO2‾/NO3‾-N, for all four types of land use. When comparing the water quality levels between snowmelt and stormwater runoff FF for both industrial and on-going development land uses, the median EMCs of all water quality parameters (except
  -N and NO2‾/NO3‾-N) are not significantly different; whereas the median EMCs of many water quality parameters of stormwater runoff FF are significantly higher than those in snowmelt for commercial and residential land uses.
3.3. Water Quality of Sub-Catchments with Same Flow and Land Use Types
Given a flow type and a land use type, the comparison of the median EMCs among/or between sub-catchments was conducted using the K-W or Wilcoxon rank sum tests to investigate whether significant differences among/or between sub-catchments exist. As demonstrated in Table 3, both significant differences and no significant differences were detected in the median EMCs among/or between sub-catchments. In particular in baseflow, the median EMCs are, in general, significantly different among/or between sub-catchments for all four types of land use. In snowmelt, the median EMCs of most water quality parameters were found to be significantly similar between two industrial sub-catchments and among three on-going development sub-catchments; whereas they were detected to be significantly different between two commercial sub-catchments and among five residential sub-catchments. For stormwater runoff FF, the median EMCs are, in general, significantly different among residential sub-catchments; whereas most of them are similar among/or between sub-catchments of commercial, on-going development and industrial land uses, respectively. The median EMCs of stormwater runoff ROE1 and ROE2 are either significantly similar or significantly different among/orbetween sub-catchments of all four types of land use. Therefore, relatively large variations in EMCs of baseflow among sub- catchments for all land use types and EMCs of stormwater runoff FF among sub- catchments of residential land use are expected in the study area.
As shown by the results obtained from above statistical analysis, water quality levels are functions of types of both flow and land use. The detected significant differences in water quality among/or between sub-catchments suggest the necessity and importance of selecting representative sub-catchments for water quality monitoring. All these detected differences complicate the formulation of an effective monitoring scheme for accurately quantifying pollutant loading into receiving water bodies from an urban setting. An efficient water quality monitoring program should be capable of capturing the variations of water quality. Apart from classifying land use based on the major categories (commercial, industrial, on-going development, and residential land uses), more elaborate classification, for example taking account more geophysical characteristics (slope, soil type, and percentage of impervious area) and hydrology and water quality
Table 3. Comparison of EMCs of water quality parameters among/or between sub-cat- chments given a flow type and a type of land use using Kruskal-Wallis test (for more than two samples) or Wilcoxon rank sum test (for two samples). (Com, Ind, Dev and Res denote commercial, industrial, on-going development and residential land uses, respectively. NEQ denotes that at least one sample is significantly different from other sample(s); EQ denotes that there are no significant differences between/among samples).
response of catchments, might be necessary from the point of view of quantifying pollutant loading at a city-wide scale.
3.4. Modeling of Stormwater Runoff Quantity and Quality
As discussed previously, stormwater runoff is more contaminated as the median EMCs of many water quality parameters are higher than and equivalent to those of baseflow and snowmelt, respectively (Figure 2). Comparing the contribution of the three types of flow in terms of pollutant loading, which is the product of EMC and flow volume, the contribution of stormwater runoff, which has highest flow volume, is thus more significant. For stormwater runoff especially in the phase of FF, significant differences in the EMCs of several water quality parameters (including TSS, TP, BOD, and  -N) were detected between residential and industrial land uses (Table 1), which are two major types of land use in the City of Calgary. In stormwater runoff, the EMCs of TP were found significantly correlated with those of TSS in three phases (FF, ROE1 and ROE2) (results not shown), which implies that majority of TP might be attached to sediments. The EMCs of TSS and TP of commercial land use were observed to be statistically equivalent to those of residential land use (Table 1). Therefore, two selected sub-catchments: one for residential land use (McKenzie Towne (MK)) and the other for industrial land use (Bonnybrook (BB)) were selected for investigating which process (pollutant buildup or wash-off) primarily contributes to the detected differences in particulate pollutants (especially TSS) using modeling approach.
3.4.1. Stormwater Runoff Quantity Calibration and Validation
A total of 12 and six storm events, in which data of flow, EMC of TSS and rainfall are available, were used for developing the models for BB and MK sub-cat- chments, respectively. At BB sub-catchment, eight events observed during 2003- 2004 were used in model calibration and other four events observed in 2005 were used in model validation. At MK sub-catchment, four events in 2002 were adopted to calibrate the model, while the other two events from the same year were used to validate the model. Among the 12 storm events for BB sub-catch- ment, the return period of three storm events were longer than two years return period; while at MK sub-catchment, the return periods of all storm events (except event on July 27, 2002) were equal to or less than two years. Table 4 presents the geophysical characteristics and calibrated variables in the model calibration for BB and MK sub-catchments, respectively. Among these eight variables, catchment area and width were obtained physically. For other geophysical variables (e.g., catchment slope) were determined through model calibration, although they can be estimated. The calculated relative errors of total runoff volume and peak flow are displayed in Table 5 for BB sub-catchment in model calibration and validation. In the model calibration, the errors of total runoff volume ranged from −19% to 47%; while the errors of peak flow varied from −25%
Table 4. Geophysical and calibrated variables of BB and MK sub-catchments, respectively.
Table 5. Relative errors between observed and simulated total volume and peak flow in the model calibration and validation at Bonnybrook (EV and EP stand for the relative errors of total runoff volume and peak flow, respectively).
to 32% when the average calibrated parameters were used. The coefficients of determination (R2) (between observed and simulated values) are 99% and 88% for total runoff volume and peak flow, respectively, in the model calibration. As shown in Table 5, the calculated errors for total runoff volume and peak flow in the model validation are, in general, in their ranges obtained from the model calibration. Thus, the calibrated model performed equivalently in both the model calibration and validation.
At BB sub-catchment, the modeled and observed hydrographs of the storm event on July 5, 2003, which was reported to have highest errors among the calibration events, are shown in Figure 3 as an example. As illustrated in the figure, the developed model can predict the shape of hydrograph in addition to the magnitude of flow and the time to peak fairly well.
Compared to the modeling results at BB sub-catchment, the calculated relative errors of total runoff volume and peak flow spanned wider ranges at MK sub- catchment. The errors in total runoff volume ranged from −15% to 116% and the errors in peak flow varied from −60% to 72% in the model calibration at MK sub-catchment. However, better model performance was achieved in the model validation, in which the errors in total runoff volume and peak flow are in the range of −19% to −9% and −40% to 5%, respectively. The inferior performance at MK sub-catchment, especially in the model calibration, might be ascribed to less number of events available for model development. As illustrated in Figure 4, which displays both observed and modeled hydrographs of a storm event on
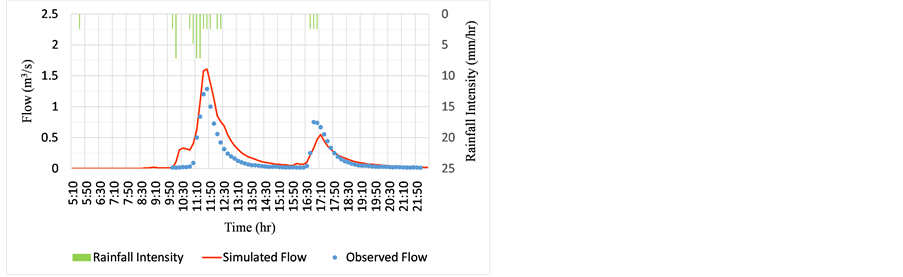
Figure 3. Hyetograph, observed and simulated hydrographs of storm event on July 5, 2003 in the model calibration at Bonnybrook sub-catchment.
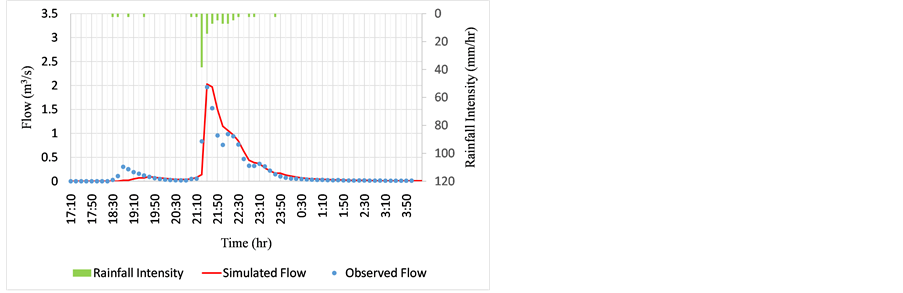
Figure 4. Hyetograph, observed and simulated hydrographs of storm event on August 10, 2002 in the model calibration at McKenzie Towne sub-catchment.
August 10, 2002 in the model calibration, the calibrated model was capable of capturing the dynamic behavior of flow.
3.4.2. Stormwater Runoff Quality (TSS) Calibration and Validation
Parameters of pollutant (here TSS) buildup and wash-off equations were determined in the model calibration. Initial assumptions of these parameters were made referring to previous studies. In the absence of pollutograph, EMCs of TSS were used to develop the water quality models. In the calibration, three storm events and one event were not included for BB and MK sub-catchments, respectively, as these events are more intensive and measured TSS EMCs in these events largely deviate from those of the rest calibration events. Thus for BB sub- catchment, five and four events were applied to calibrate and validate model, respectively; while three and two events were used for model calibration and validation, respectively, for MK sub-catchment. Table 6 shows the calibrated buildup and wash-off parameters for BB and MK sub-catchments, respectively, along with their ranges from literature.
At BB sub-catchment, TSS EMCs were overestimated in three out of five calibration events. The relative errors in EMC ranged from −10% to 59% and R2
Table 6. Calibrated parameters for TSS modeling for BB and MK sub-catchments, respectively, and their ranges in literature.
1 [20] , 2 [11] , 3 [10] .
between the observed and simulated EMCs was 0.81 (Figure 5). However at MK sub-catchment, TSS EMCs were overestimated in all three calibration events and the errors ranged from 8% to 81%.
In the model validation, the performance of developed model for BB sub- catchment is inferior to that in the model calibration. The results might reflect the stochastic nature of pollutant buildup and/or wash-off on and from land surface. The other possible explanation is that the pollutant deposited on the land surface is dependent on not only the antecedent dry period prior to a storm event but also the remaining pollutants on the land surface after its previous event. However, the developed model for MK sub-catchment performed well in the model validation as the errors in TSS EMCs ranged within ±20%.
Compared to the modeling of stormwater runoff quantity, the modeling of stormwater runoff quality is more challenging as illustrated by the results from the model calibration and validation. Although the results suggest that improvement on stormwater runoff quality modeling is needed, they provide insight into the process which largely governs TSS level in stormwater runoff. For these two sub-catchments of different types of land use, same buildup parameters were determined; whereas the wash-off coefficient and exponent were higher for BB sub-catchment (industrial land use) than those for MK sub-catchment (residential land use) (Table 6). The results suggest that the wash-off of particulate pollutants from land surface might play a dominant role in governing TSS level of stormwater runoff generated from these two sub-catchments. The results also can be explained by the fact that pollutant wash-off would be the governing process if there are more than sufficient pollutants deposited on the land surface prior to a storm event. In addition, the intensive storm events (return period longer than 2-year) were excluded, as their inclusion introduced large errors in the model calibration. The preliminary result might imply the necessity to group events based on their magnitude when conducting event-based stormwater runoff modeling as different wash-off coefficients might be required. The results might also imply that the pollutant buildup can be dominant in more intensive and longer duration event as there might be insufficient pollutants for wash-off. As a result, either pollutant buildup or pollutant wash-off or their combination primarily governing TSS levels of stormwater runoff in a storm event could be a
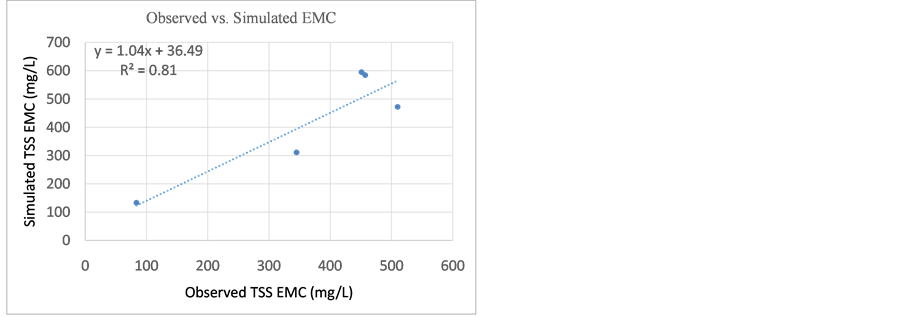
Figure 5. Observed vs. simulated EMCs of TSS in the model calibration at Bonnybrook sub-catchment.
function of land use and regional environment, thus water quality response to storms can be site-specific and even storm-specific. Under this circumstance, caution should be paid to the water quality response of catchments when characterizing stormwater runoff quality and quantifying pollutant loading.
4. Conclusion
This paper investigated the linkage between land use and water quality in an urban setting, the City of Calgary, Alberta, Canada using two different approaches: statistical analysis and modeling. The statistical analysis was conducted to study the differences or similarities in water quality in three types of flow (baseflow, snowmelt and stormwater runoff) generated from catchments grouped into four types of lands uses (commercial, residential, industrial, and on-going development). The analysis identified significant differences in many water quality parameters among the investigated types of flow and the different types of land use, and among/or between catchments categorized into same land use type. In addition, the modeling results of stormwater runoff from two sub-catchments of different land use types demonstrated that sediments wash-off might be the dominant process governing TSS level of stormwater runoff, although the governing process could be site-specific and also a function of event magnitude. All these results suggest that water quality level vary with flow types, land use types, and even catchments of a same land use type. Therefore caution should be paid to the selection of monitoring sites/catchments, which should be representative for capturing the variability of water quality level in different flows, land uses, and catchments of similar land use, and consequently accurately quantifying pollutant loading at a city-wide scale.
Acknowledgements
This research was financially support by Urban Alliance (a research partnership between the City of Calgary and the University of Calgary) and NSERC. The authors would like to acknowledge the contribution of the personnel, including Mr. Khizar Mahmood, Ms. Stacey Zhao, Mr. Lei Chen, and Ms. Lily Ma (former staff), of the City of Calgary.
Cite this paper
Shrestha, D. and He, J.X. (2017) Characterization and Modeling of Urban Water Quality in the City of Calgary, Canada. Natural Resources, 8, 513-530. https://doi.org/10.4236/nr.2017.88032
References
- 1. Tsihrintzis, V.A. and Hamid, R. (1997) Modeling and Management of Urban Stormwater Runoff Quality: A Review. Water Resources Management, 11, 136-164.
https://doi.org/10.1023/A:1007903817943 - 2. Wang, L., Lyons, J. and Kanehl, P. (2003) Impacts of Urban Land Cover on Trout Streams in Wisconsin and Minnesota. Transactions of the American Fisheries Society, 132, 825-839.
https://doi.org/10.1577/T02-099 - 3. Konrad, C.P. and Booth, D.B. (2005) Hydrologic Changes in Urban Streams and Their Ecological Significance. American Fisheries Society Symposium, 47, 157-177.
- 4. Burszta-Adamiak, E. and Mrowiec, M. (2013) Modelling of Green Roofs’ Hydrologic Performance Using EPA’s SWMM. Water Science and Technology, 68, 36-42.
https://doi.org/10.2166/wst.2013.219 - 5. U.S. Environmental Protection Agency (2000) National Water Quality Inventory. 1998 Report to Congress, USEPA 841-R-00-001, Washington DC.
- 6. Huang, J., Du, P., Ao, C., Ho, M., Lei, M., Zhao, D. and Wang, Z. (2007) Multivariate Analysis for Stormwater Quality Characteristics Identification from Different Urban Surface Types in Macau. Bulletin of Environmental Contamination and Toxicology, 79, 650-654.
https://doi.org/10.1007/s00128-007-9297-1 - 7. Lee, J.H. and Bang, K.W. (2000) Characterization of Urban Stormwater Runoff. Water Research, 34, 1773-1780.
- 8. Wang, S., He, Q., Ai, H., Wang, Z. and Zhang, Q. (2013) Pollutant Concentrations and Pollution Loads in Stormwater Runoff from Different Land Uses in Chongqing. Journal of Environmental Sciences, 25, 502-510.
- 9. Goonetilleke, A., Thomas, E., Ginn, S. and Gilbert, D. (2005) Understanding the Role of Land Use in Urban Stormwater Quality Management. Journal of Environmental Management, 74, 31-42.
- 10. Rossman, L.A. (2010) Stormwater Management Model User’s Manual. Version 5.0.
- 11. Di Modugno, M., Gioia, A., Gorgoglione, A., Iacobellis, V., la Forgia, G., Piccinni, A. and Ranieri, E. (2015) Build-Up/Wash-Off Monitoring and Assessment for Sustainable Management of First Flush in an Urban Area. Sustainability, 7, 5050-5070.
https://doi.org/10.3390/su7055050 - 12. Hsu, M.H., Chen, S.H. and Chang, T.J. (2000) Inundation Simulation for Urban Drainage Basin with Storm Sewer System. Journal of Hydrology, 234, 21-37.
- 13. Temprano, J., Arango, O., Cagiao, J., Suarez, J. and Tejero, I. (2006) Stormwater Quality Calibration by SWMM: A Case Study in Northern Spain. Water SA, 32, 56-63.
- 14. Bhaduri, B., Minner, M., Tatalovich, S. and Harbot, J. (2001) Long-Term Hydrological Impact of Urbanization: A Tale of Two Models. Journal of Water Resources Planning and Management, 127, 13-19.
https://doi.org/10.1061/(ASCE)0733-9496(2001)127:1(13) - 15. Bai, S. and Li, J. (2013) Sediment Wash-Off from an Impervious Urban Land Surface. Journal of Hydrologic Engineering, 18, 488-498.
https://doi.org/10.1061/(ASCE)HE.1943-5584.0000654 - 16. Barco, J., Wong, K.M. and Stenstrom, M.K. (2008) Automatic Calibration of the U.S. EPA SWMM Model for a Large Urban Catchment. Journal of Hydraulic Engineering, 134, 466-474.
https://doi.org/10.1061/(ASCE)0733-9429(2008)134:4(466) - 17. Walker, J.F., Graczyk, D.J., Corsi, S.R., Owens, D.W. and Wierl, J.A. (1995) Evaluation of Nonpoint-Source Contamination, Wisconsin: Land-Use and Best Management Practices Inventory, Selected Stream Water-Quality Data, Urban-Watershed, Quality Assurance and Quality Control, Constituent Loads in Rural Streams and Snowmelt-Runoff Analysis, Water Year 1994. US Geological Survey Open File Report 95-320.
- 18. Brezonik, P.L. and Stadelmann, T.H. (2002) Analysis and Predictive Models of Stormwater Runoff Volumes, Loads and Pollutant Concentrations from Watersheds in the Twin Cities Metropolitan Area, Minnesota, USA. Water Research, 36, 1743-1757.
- 19. U.S. Environmental Protection Agency (1983) Results of Nationwide Urban Runoff Program. Volume 1, Final Report, Water Planning Division, Washington, DC, National Technical Information Services, 83 (185552).
- 20. Sartor, J.D., Boyd, G.B. and Agardy, F.J. (1974) Water Pollutant Aspects of Street Surface Contaminants. Journal of Water Pollution Control Federation, 46, 458-667.