Natural Resources
Vol.07 No.08(2016), Article ID:69694,20 pages
10.4236/nr.2016.78048
GIS-Based Morphometric Analysis of Fourth-Order Sub-Basins of the Zerqa River (Northern Jordan) Using Multivariate Statistical Techniques
Yahya Farhan, Ibtisam Elmaji, Osama Khalil
Department of Geography, University of Jordan, Amman, Jordan

Copyright © 2016 by authors and Scientific Research Publishing Inc.
This work is licensed under the Creative Commons Attribution International License (CC BY).
http://creativecommons.org/licenses/by/4.0/


Received 18 July 2016; accepted 9 August 2016; published 12 August 2016
ABSTRACT
The present study attempts to examine the morphometric characteristics and relationships of 43 fourth-order sub-basins over the Zerqa River watershed, using ASTER DEM, GIS and multivariate statistics. To achieve these objectives, Principal Component Analysis was utilized to reduce the 26 parameters into six major components which accounted for 79.3% of the total variance explained by the original morphometric variables. Hierarchical Cluster Analysis (CA) (Ward’s method) has been applied to classify the 43 sub-basins based on different types of morphometric parameters. Four groups of sub-watersheds were identified and characterized by different morphometric properties. The patterns of spatial distribution of cluster groups were determined based on lithological, structure and tectonics, uplifting, and rejuvenation processes.
Keywords:
Morphometry, ASTER DEM, Principal Component Analysis, Cluster Analysis, Zerqa River, Jordan

1. Introduction
The Zerqa River watershed, locates in northern Jordan, and covers an area of 4031 km2. At the lower catchment, the King Talal Reservoir (KTR) was constructed with a capacity of 56 MCM. Generally, the catchment area is highly vulnerable to soil erosion. The estimated sediment concentration for the Zerqa River ranges between 0.1% - 2.0%, and figures exceeding 3.0% were reported by the Natural Resources Authority [1] . Further, Battikhi and Arabiat [2] estimated the total sediment inflow to KTR at about 1.7 MCM yr−1, while Lara [3] concluded that the total annual sediment volume is of 3.83 MCM yr−1. Furthermore, the measured sediment inflow at King Talal reservoir (1980/1-1967/7), applying the AGNPS erosion model was found to be 2.9 and 2.456 MCM with and without landslides respectively [4] [5] . Watershed characteristics provided the basis for quantitative analysis of morphometric properties of drainage basins as developed by Horton [6] and elaborated by Strahler [7] - [9] .
Multivariate analysis of morphometric parameters and drainage basins of different orders, have been applied worldwide in geomorphic research [10] - [16] . However, little emphasis has been devoted to investigating the internal structure and geomorphometric characterization of drainage networks in relation to the entire watershed through analysis of fourth-order sub-basins using multivariate statistics. A wide range of morphometric variables can be measured and computed for drainage basins, and often it is inconvenient to assure which are the most successful parameters for geomorphic inference. Statistical analysis in this context helps in simplifying this complexity in drainage basin studies [15] through multivariate statistical techniques such as Cluster Analysis and Principal Component Analysis. The major function of these techniques is to simplify and organize large amounts of morphometric data pertaining to a large number of drainage basins. Among the pioneer morphometric studies which employed multivariate statistics are: a case study, where 18 morphometric variables were measured and analyzed for 130 third-order drainage basins in southern Uganda [16] to assess the morphometric properties of these drainage basins. Further, a case study discusses the areal classification in geomorphology using Cluster Analysis [17] . Similarly, a study utilized morphometric analysis, multivariate statistics, and a SRTM (v.2) digital elevation model to describe the morphology, structures, hydrologic potential, and geologic evaluation of the watershed. Q and R modes of Cluster Analysis (CA), and Principal Component Analysis (PCA) were employed. Ten watersheds were analyzed in western Saudi Arabia, utilizing 18 geomorphometric parameters. The first three components of PCA contributed 86% of the total of variance in the original data and revealed more details regarding the variable loadings and the degree of parameter significance [18] . Yunus et al. [15] performed a morphometric analysis study of 36 drainage basins in the Western Arabian Peninsula, using a digital elevation model (DEM), Principal Component Analysis, and hierarchical Cluster Analysis. Likewise, 21 morphometric variables for 3833 first-order basins in the Siwaliks (Nepal) were investigated using PCA. The study recognizes different basin types based on morphometric properties, and the association of first-order basins with lithology, structure, and uplift rates was assessed [19] . A classification procedure of worldwide drainage basins was carried out through multivariate analysis of variables controlling their hydrosedimentary response [20] . Morphometric assessment of lithologic controls on drainage basin evolution was also examined using multivariate statistics [21] . Recently, PCA applied in grouping geomorphic parameters of a watershed for hydrological modeling was carried out [22] . The perception of farmers towards soil erosion in northern Jordan was assessed using factor analysis and stepwise regression [23] . In the present research, 26 morphometric parameters were computed for 43 fourth-order sub-basins related to the Zerqa River watershed and were analyzed using Principal Component Analysis (PCA) and Cluster Analysis (CA) techniques. The objectives of the present research are to:
1) Explore the relationships and correlations among morphometric variables which characterize the 43 forth- order sub-basins.
2) Describe the relationship of major components resulting from PCA to the morphometric variables, and to the individual sub-basing, and then to explain their contribution to the morphology of fourth-order sub-basins in the Zerqa River watershed.
3) Achieve a grouping scheme for the 43 sub-basins through Cluster Analysis (CA) by reference to their individual relationships to the components, and to the original morphometric parameters. The patterns of spatial distribution of cluster groups were analyzed in relation to lithology, tectonics and uplifting, and rejuvenation processes.
2. Study Area
The study area (35˚32'42''E - 36˚48'9''E and 31˚51'37''N - 32˚35'4''N) comprises the Zerqa River watershed, northern Jordan. The catchment extends from the western highlands/the Ghor to the eastern desert, crossing the Jordanian-Syrian border until the piedmonts of Jebel el Druz northeast. The watershed is drained by two major tributaries: W. Dhulil and W. Zerqa which drain the eastern and western parts of the catchment respectively. Both wadis are joined at Shkhna town to form what is known as the “Zerqa River” (Figure 1). The elevation of the watershed ranges from −367 m (b.s.l) to 1589 m (a.s.l) (Figure 2(a) and Figure 2(b)).
Slope elements and segments of a watershed are often controlled by climato-morphogenetic processes [24] .
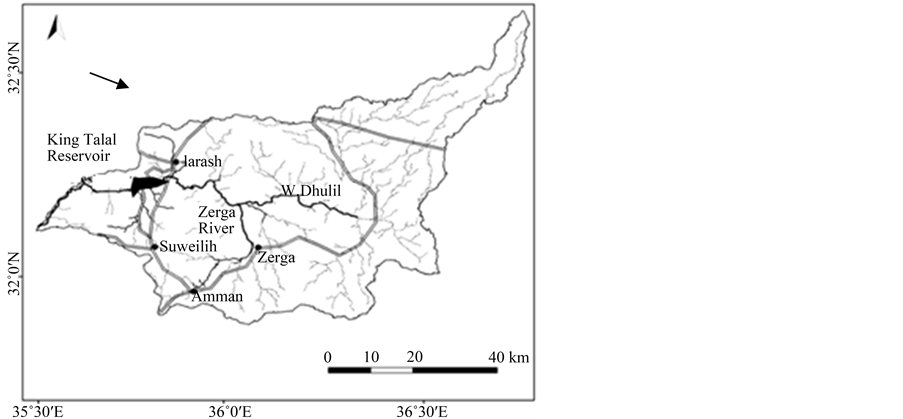
Figure 1. The Zerqa River watershed.

Figure 2. The study area: (a) DEM and (b) location of the Zerqa River.
Slope categories exhibited by the Zerqa River catchment vary from 0˚ to 20˚- 45˚. The slope categories map is illustrated in Figure 3. Higher slope categories (10˚ - 15˚, 15˚- 20˚, and 20˚- 45˚) dominate the western part of the watershed, which are seriously affected by rejuvenation processes, the presence of old landslide complexes, active landslide movements caused by heavy rainstorms, and high rates of soil erosion loess [4] [25] [26] . Slope categories of categories of 0˚ - 5˚, 5˚ - 10˚, and 10˚ - 15˚ characterize the eastern part of the watershed.
The aspect of a land unit is the direction to which it faces. Aspect has a great impact on precipitation patterns, exposure to sun, wind, and hence evaporation rate, and vegetation type and density. Slopes facing the north, southeast, south, and southwest are predominant in the western part of the watershed (Figure 4). It is thus characterized by a higher moisture content and lower evaporation rate. Rainfed cultivation is practiced here, whereas irrigated agriculture dominates in the upper part of the watershed and the lower Zerqa River floodplain.
2.1. Geology and Geomorphology
The watershed is occupied by a sequence of rocks ranging from Triassic to recent sediments, whereas the nor
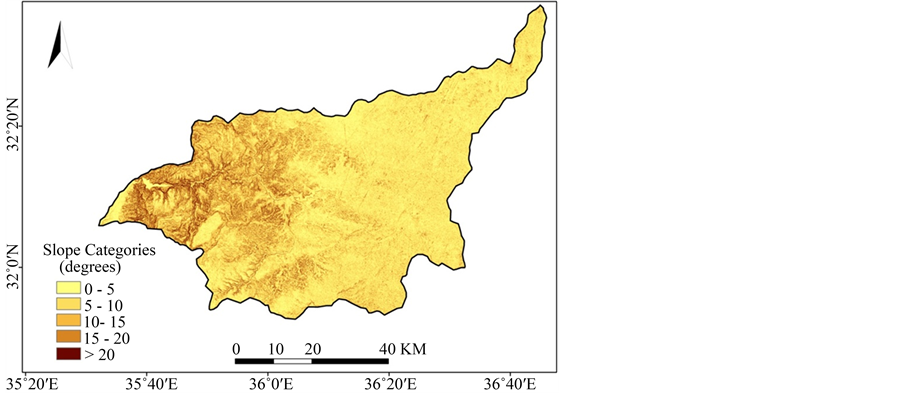
Figure 3. Slope categories.
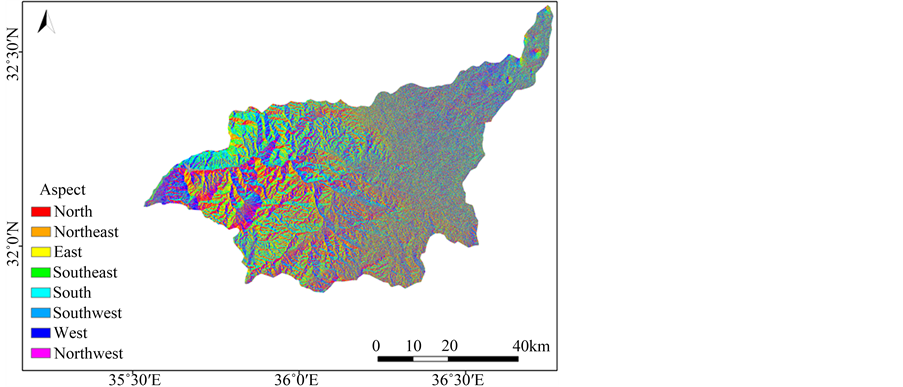
Figure 4. Aspect of the Zerqa River watershed.
theastern part of the catchment is covered by basalt rocks ranging in age from Oligocene to Pleistocene. The geological succession in the watershed is illustrated in Table 1, while, the geological units and structure are displayed in Figure 5. The older rock units are exposed at the lower reaches of the Zerqa River. It is locally called the Zerqa Group. It consists of sandstones, dolomites shales and marlstones. This rock unit is overlain by Kurnub sandstone (Lower Cretaceous age) which is exposed along the middle and lower course of the river. Silty and clayey sandstones are dominant in the upper part, while varicolored shaley sandstones characterize the lower part [27] [28] . The sandstones are overlain by the Cenomanian-Turonian Group (Upper Cretaceous age), which consists of two lithological units: the Nodular limestone unit (the Marl-Clay unit). Marls and clays intercalated with marly limestones, limestones, nodular limestones, and dolomites prevail. Rockfalls and other rock instability are attributed to erosion operating on intensively jointed and weathered marls and clays [26] . The Echinoidal Limestone unit (the Limestone-Marl unit) consists of limestones, dolomitic limestones, marl, sandy limestones, marly limestones and chert nodules. This unit is restricted to the summit surfaces and is exposed at the crest of landslide complexes and rock bluffs at the lower course of the river close and to the west of the Zerqa River bridge. The Massive Limestone unit consists of thick limestone beds which are highly jointed and fractured, and the limestone is intercalated with layers of marl. The Chert-Limestone unit is comprises of massive chalky limestone, alternating thin-bedded limestone and chert layers, that range in age from Early Paleocene to Middle Eocene [28] . During the Oligocene and Pleistocene, basiltic volcanism was widespread in Jordan including the Zerqa River watershed. Basalt covers the eastern part of the study area. From early Miocene to historical time (4000 years old in Syria, and 760 years old in the Arabian Peninsula), six basaltic flows occurred and separated from each other by 5 m of fossil soils, red clay beds, and fossil weathered basalt surfaces [32] . The older and younger flows constitute normal plateau basalt. The recent sediments composed mainly of coarse and fine clastic materials washed down along the slopes to wadi bottoms and depressions in the western highlands of the catchment. The thickness of these sediments between Zerqa city and Sukhna town approach 50 m, and the width is 500 m to 600 m. West of KTR, the Zerqa River built a wide floodplain, bounded near its outlet by the badlands terrain unit (locally named the Katar) which is composed of Lisan marl of the Late Pleistocene.
Structurally, the western part of the Zerqa River catchment exhibits three major compressional structures locally termed: Wadi Shueib Structure, Biren Structure, and the Amman-Hallabat Structure (Figure 5). Each of these consists of several highly folded synclines, anticlines, partially overturned to the west. In several localities it is heavily deformed by jointing and faulting [33] [34] . The presence of old large landslide complexes at the front or flanks of this structure indicate the role of tectonics as a controlling factor in their initiation and distribution. Continuous rejuvenation and incision of the Zerqa River draining to the Rift associated with lowering of the base level (the Jordan River and Dead Sea), and uplifting of the eastern shoulder of the Rift during late Tertiary and Pleistocene tectonics produced irregular longitudinal profiles and interrupted valley-side slopes. These irregularities and discontinuities represent some forms of rejuvenation points. Four or five rejuvenation phases can be recognized and have resulted in severe topographic dissection, dense incised “poly-cyclic” drainage, and oversteepened slopes. The existence of arcuate scars of large dimensions, prominent reverse slopes, and hummocky topography are indicative of huge old landslide activity along the lower and middle Zerqa River course.

Table 1. Lithological sequence of the Zerqa River watershed.
Based on: [27] - [31] .
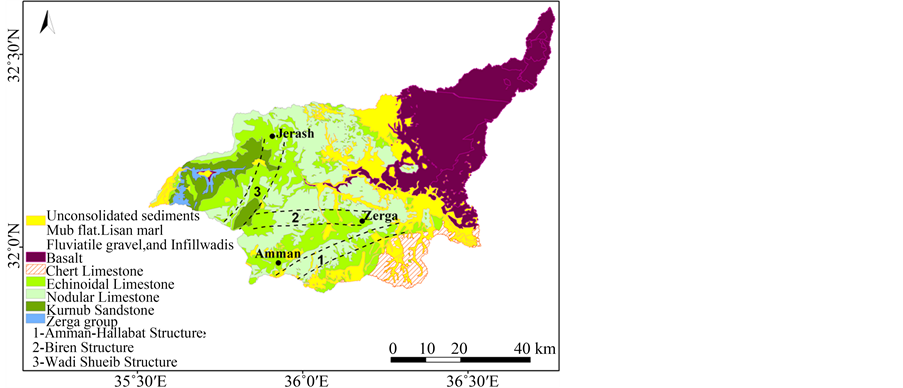
Figure 5. Lithology and compressional structures (based on [28] ).
The old landslide complex close to the Zerqa River bridge, and the Bassa landslide west of KTR are the best examples. The lower slopes of landslide complexes are considered an active landslide zone due to river incision, lateral erosion, recent tectonic activity [35] , and peak flooding. The old landslide complexes are tentatively from the Pliocene and Quaternary age [25] . Severe bank erosion and repetitive slipping during the pluvial periods of the Pleistocene prevented the development of an accumulation zone at the ultimate angle of stability. Large amounts of the slipped materials for many old large landslides have been swept away by stream erosion during peak flooding and heavy rain storms. At present seasonal flooding along the lower and middle courses of the Zerqa River constitutes an equally intrinsic factor in triggering landslides.
2.2. Climate Hydrology and Land Cover
The climate is of sub-humid Mediterranean in Suweileh and Jubba areas, then it shifts to semi-arid in the Baq’a depression and Jerash area, and dominated by arid conditions along the eastern part of the watershed. The climate is generally characterized by long, hot and dry summers, and relatively short and wet winters [36] . The average annual rainfall ranges from 541 mm at Suweileh (1050 m a.s.l) to 365 mm at Jerash (550 m a.s.l). The mean annual rainfall at the Zerqa climatic station is 132 mm (510 m a.s.l), in Mafraq at the northern border of the catchment it is 155 mm (695 m a.s.l). Some years snow becomes the dominant source of precipitation in the Sweileh and Jerash areas. 95% of the precipitation falls in the winter season (November-March). December, January and February account for about 70% of the total rainfall. Much of rainfall, particularly in January, February and March is associated with storms of high intensity which may induce serious soil erosion and landslide activity. A heavy rainstorm that occurred on March 4th, 1983 caused dozens of shallow landslides in Suweilh-Jerash area. The average annual stream flow of the Zerqa River is 70.3 MCM at KTR. Of that amount, storm runoff contributes 50.1 MCM, and the base flow represents 20.2 MCM [30] . Abnormally heavy rainstorms may occur in winter and have a considerable influence on annual and monthly discharge variations. The mean maximum discharge at the Zerqa River bridge, for the 1960-1984 was 250 m3/s and many severe floods were recorded, during which peak flows occasionally approximated 400% of the mean maximum discharge. Examples of severe floods are those that occurred in 1935/1936, 1973/1974, 1979/1980 and 1983/1984 [37] . The slopes often have a poor vegetation cover. Trees on bare slope have been deforested in the past, and are severely overgrazed at present. Rainfed cultivation (mainly cereals, fruit trees, and olive trees) is practiced in the western part of the watershed but with poor conservation measures (Figure 6), whereas, irrigated farming occupies the flood plain of the Zerqa River, the fluvial terraces, the alluvial fan of Wadi Jerash, and scattered areas in north and east arid part of the catchment. Native forest exists in the northwestern part (Jerash area) of the watershed. Pinus halepensis was also planted in the mid-1950s and 1960s to provide protective measures against soil erosion and landslide processes [38] . Furthermore, conservation practice (i.e., stone terraces) under the auspices of the High Land Development Project was initiated in the later 1980s [4] .
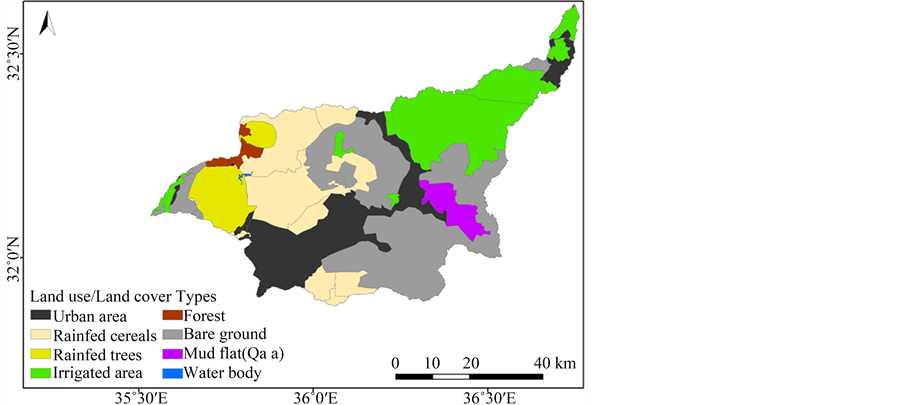
Figure 6. Land use and land cover.
3. Methodology
Topographic maps of scale 1:50,000 (20 m contour interval) were purchased from the Royal Jordanian National Geographic Centre (RJNGC), Amman. They were then scanned, geo-referenced, and converted to WGS-1984, zone 36˚N projection system using Arc GIS tool (v. 10.1) and the accompanying packages. The entire Zerqa River watershed and the 43 sub-basins were delineated initially using topo sheets. ASTER DEM (30 m spatial resolution) was employed to delineate the final boundaries of the Zerqa River watershed and the 43 sub-basins (Figure 7). The drainage networks were also demarcated using the Arc Hydro tool provided by Arc GIS software. Twenty-six morphometric parameters for the entire watershed and the 43 sub-basins were derived and computed using ASTER DEM, Arc GIS software, and the mathematical equations developed by Horton [6] ; Strahler [7] - [9] ; Miller [39] [40] (Table 2). These include: stream length (Lu), mean bifurcation ratio (Rbm), area (A), perimeter (P), basin length (Lb), elongation ration (Re), drainage texture (Dt), texture ratio (Tr), circularity ratio (Rc), compactness coefficient (Cc), shape index (Bs), lemniscates ratio (k), stream frequency (Fs), drainage density (Dd), form factor (Rf),drainage intensity (Di), constant of channel maintenance (C), length of overland flow (Lo), basin relief (Bh), relief ratio (Rr), ruggedness number (Rn), dissection index( Dis), time of concentration (Tc).
Multivariate statistical techniques were also employed in the present study. Principal Component Analysis (PCA), and Cluster Analysis (CA) have been utilized since the early 1970s in drainage morphometric research [16] [49] . The PCA technique can analyze a large data set (data matrix) illustrating the morphometric parameters, and the drainage basins (the spatial unit or taxonomic individuals). PCA is also used to reduce the original data or large number of variables to a few principal components which correlate with the morphometric parameters, and can be employed to describe the morphometric characteristics of drainage basins. Furthermore, the technique is designed to initially calculate the correlation matrix to illustrate the highly loaded parameters on each principal component, and how much the variability in the original parameters is explained by each PC. Eigen value denotes how well each of the recognized components fits the data from all the morphometric attributes on all the principal components. In practice, the analysis of principal components can be restricted to all those components that have an eigen value greater than one. Cluster Analysis is employed to classify the 43 fourth-order sub-basins into different clusters of sub-basins based on the similarity coefficient. The results of CA are normally represented by a linkage tree or dendrogram. With the aid of Arc GIS, spatial distribution maps for the groups of sub-basins can be generated. Both techniques (PCA and CA) make it possible to recognize the structural relationships of the 26 morphometric variables including the principal components [15] ; and to identify clusters of drainage sub-basins using the achieved component values along with their morphometric properties.
4. Morphometric Analysis of the Zerqa River Watershed
Quantitative analysis was performed for the entire Zerqa River watershed and the 43 sub-basins in order to
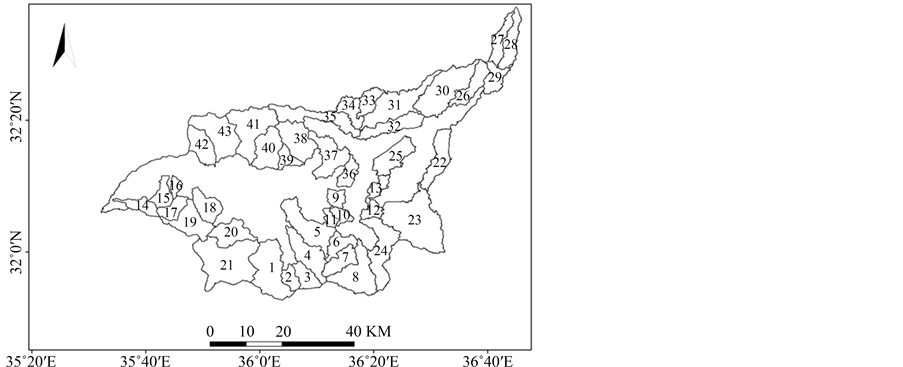
Figure 7. The 43 sub-basins of the Zerqa River watershed.
Table 2. Morphomertric parameters and their mathematical formula.
assess the characteristics and properties of the drainage networks. Twenty-six morphometric parameters which representing drainage network, basin geometry, drainage texture analysis, and relief characteristics were considered to characterize the catchment and to enhance our understanding of drainage basin development in relation to intrinsic controlling factors, such as lithology, tectonic and structure, geomorphic processes and rejuvenation phases. Table 3 summarizes the computed morphometric parameters of the Zerqa River watershed. The total drainage area of the catchment is 4895.110, and the drainage pattern is dendritic to sub-dendritic in the upper cat- chment, and trellis type in the southern and western parts. Based on drainage order, the catchment is classified as a seventh basin-order (Figure 8) with a length of 143.8 km, and perimeter of 464.7 km. The total number of streams (Nu) is 5806, and the first-order streams account for 79.6% of the total number of streams in the watershed. It is noticeable that the total number of streams gradually decreases as the stream order increases (Table 3).
Generally, the higher the order is, the longer the length of stream in nature is. The total stream length (Lu) of the Zerqa River is 7148.25 km, and the first-order streams represent 48.5% of the total stream length. A variation exists in (RL) values between the streams for different order of the Zerqa River watershed (0.376 - 3.4), and the 43 sub-basins. This variation might be attributed to geomorphic changes in relief and slope along the Zerqa Rive, the influence of the compressional structures, the stage of geomorphic development, and rejuvenation along the catchment.
The value of bifurcation ratios for the Zerqa River watershed and the 43 sub basins are typical for catchments in which structural disturbances distort the drainage system (Rb varied from 2.7 to 5.002, with a mean of 4.9). The main morphological factors controlling drainage density (Dd) are relative relief and slope steepness. Low drainage density is realized where the catchment relief is high [9] . However, other factors determining Dd are: the resistance of surface materials against erosion, and the infiltration-capacity of the soil. The Dd value for the Zerqa River watershed is 1.46 which indicates a moderate to well-drained basin. The presence of dissected and steep slopes with relatively impervious underlying bedrock, i.e., the nodular limestone (marly-clay unit), and the Echinoidal limestone (limestone-marly unit) exposed at the middle part of the watershed resulted in a series of springs out flowing to the major courses of the river. According to Smith [50] , the Zerqa River watershed exhibits a fine drainage texture (Dt), where the Dt value is 15.383. High drainage texture values denote the presence of fragile slope materials and soft rocks where high sediment yield has been recorded [4] . With reference to the ratio between the catchment area (A) and perimeter (P) (10.5:1), the borderline of the Zerqa River watershed is considered as an irregular water divide. The Fs value for the Zerqa River watershed is 1.186, and for the 43 sub-basins range from 0.979 to 6.133. Low Fs values indicate that a relatively low infiltration rate of surface water is assumed, therefore, the groundwater potential is relatively low. Strahler [9] argued that values of elongation ratio (Re) vary between 0.6 to 1.0 over a wide range of geological and climatic conditions. The elongation ratio (Re) for the Zerqa River catchment is 0.548, where the values related to the 43 sub-basins range from 0.170 to 1.234. Such values are indicative of elongated shape, and are associated with high relief and steep valley-side slopes. According to Miller [39] , drainage basins with a range of circularity ratios (Rc) of 0.4 to 0.5 are described as strongly elongated and at the youth stage of geomorphic development. The Rc value of the Zerqa River basin is 0.284, and the form factor (Rf) value is 0.236. Low Rf value denotes that low peak flows of long duration are expected for the Zerqa River watershed [51] .
The basin relief (Bh) of the Zerqa River watershed is 1949 m. High Bh value indicates a high potential erosional energy of the drainage system. Due to repetitive sinking and changes in the base level of the Dead Sea and the Ghor (along the Jordan River), and tectonic activity, the Zerqa River retained rapid downcutting and incision through its geomorphic history, giving, rise to the present dissected and rough terrain. High rates of annual soil loss and landslide movements are noticeable geomorphic processes at present. The dissection index (Di) value for the Zerqa River basin is 0.812 which clearly shows that the watershed is extremely dissected as a result of recurrent phases of rejuvenation, and youth-age stage of geomorphic evolution, where the hypsometric integral is found to be 0.834 (Table 3 and Figure 9). The catchment is also prone to severe soil erosion loss, shallow and deep seated landslides, and is of high susceptibility to attain peak discharge. Based on Di value and the classification of drainage basins in terms of dissection, the Zerqa River watershed is considered highly dissected (0.7 - 1.0) [23] .The ruggedness number (Rn) f or the Zerqa River basin is 2.845 which affirms an extreme morphological appearance. High Rn value is indicative of active geomorphic processes due to rejuvenation. Furthermore, the lemniscates (k) value for the Zerqa River watershed is 1.056 which illustrates that the basin is elongated and flows for a longer duration. The related hypsometric curve is a convex upward one, and the hypsometric integral is 0.834, denoting that the Zerqa River is in the youth-age stage of geomorphic development, and subjected to tectonic activity and rejuvenation. Therefore, dissected and rugged landscape, and landslide activity are characteristic of the western part of the watershed.
Table 3. Morphometric characteristics of the Zerqa River watershed.
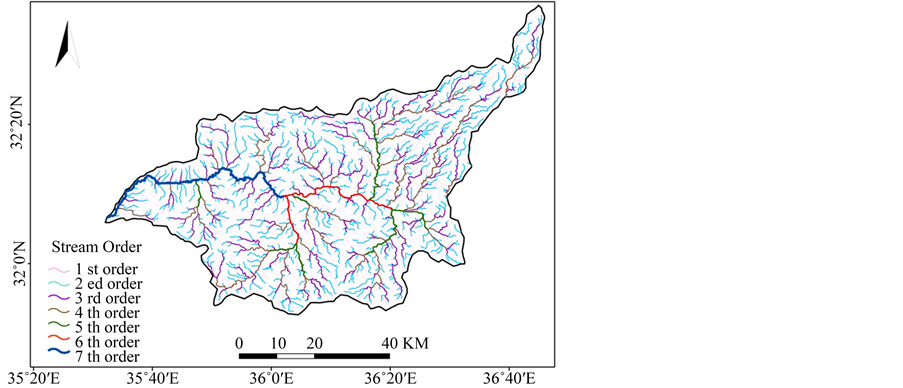
Figure 8. Stream order of the Zerqa River watershed.

Figure 9. Hypsometric curve of the Zerqa River watershed.
5. Results and Discussions
5.1. Product-Moment Correlation between the Parameters
Table 4 illustrates the means and standard deviations of the 26 morphometric variables for each of the 43 sub-basins. Further, the correlation matrix of 26 morphometric parameters is displayed in Table 5. The results of correlation analysis demonstrate that most of the morphometric parameters of the Zerqa River sub-basins exemplify a positive correlation with each other, which denotes that these parameters are interdependent. In reality, all geomorphic parameters are considered dependent variables in the genetic sense of the term. For example, stream length with a drainage basin may depend on the area of the basin, but it is possible that the area of the basin may be dependent upon the lengths of its streams. It also stated that within the correlation matrices calculated in drainage morphometric studies, there is no one dependent parameter, but all the parameters are dependent on each other, are closely internetted and have strong influence one over the other [52] , except in the few cases where physical factors play a prominent role in rendering them independent [53] . Relatively high correlation exists between basin area (A), and parameters related to stream length which indicate that an increase in basin area is associated with an increase in the number and lengths of streams. Furthermore, different levels of negative correlations are also displayed. Moderate negative correlation is present between basin area (A), stream frequency (Fs) and drainage density (Dd), elongation ratio (Re) and stream length ratio (RL); and constant channel maintenance (C) and mean stream length (Lsm). Table 5 also reveals that strong correlations (R = 0.8 − 0.9) are present between certain variables that represent similar geomorphic characteristics: (A and Rb; Re and Rc; Lo and Rf’ (C and Di). Good correlations (R = 0.7 − 0.8) exist mainly between (P) and (A); (Rc) and (Tr); (Dd) and (Fs); (Rr and Bh). Moderately well correlated parameters (R = 0.5 − 0.7) include (RL and Lu); (P and RL); (Rb and Lsm); (Tr and Rb); (Lb and RL); (k and Cc). Principal Component Analysis was carried out considering these correlation levels, because the correlation of the significant components takes into account the level and directions (negative or positive) of correlation [16] .
5.2. Principal Component Analysis
Principal Component Analysis resulted in six major components that accounted for 79.3% of the total variance explained by the original 26 morphometric variables (Table 6). Variable loadings show that four components are an expression of drainage network and geometry (RL, Rb, A, P, Lb, Tr, Rf, Re, Bs, Cc and k), and drainage texture (Dd and Lo) morphometric parameters. These components together explain 64.5% of the total variance, whereas the fifth and sixth components represent basin geometry (Tr and Rc) and relief characteristics (Bh and Rr) morphometric parameters. However, the contributions of PC4 and PC5 are noticeably smaller than those of
Table 4. Mean and standard deviation of 26 morphometric variables of 43 sub-basins.

Table 5.Person correlation coefficient matrix of the 26 parameters(bold correlation are significant at p<0.050).
Table 6. Loading of each morphometric parameter on the first six components of the PCA.
PC1-PC4, although several parameters exhibit loading values between 7 and 9. The cumulative explanation is found to be 14.8%. Principal Component 1 accounts for 22.954% of the variance of the 26 morphometric parameters. The component loadings reveal that PC1 describes the variables related to sub-basins geometry (A, P, and Lb), drainage network (U, RL and Rb), and drainage texture parameters as recognized by Fs and Lo (Table 6). Accordingly, PC1 is labeled as a “sub-basin dimension” component. The second component is predominantly related positively to drainage texture (Dt), ruggedness number (Rn), and drainage density (Dd). Strong negative correlation exists with drainage intensity (Dd). Strong negative correlation exists with drainage intensity (Di) and compactness coefficient (Cc). It explains 17.7% of the total variance. This component reflects the “intensity of dissection”.
Principal Component 2 is predominantly related positively to drainage texture (Dt), ruggedness number (Rn), and drainage density (Dd). Strong negative correlation exists with drainage intensity (Di) and compactness coefficient (Cc). It explains 17% of the total variance. This component reflects the “intensity of dissection”. Principal Component 3 corresponds to the form factor (Rf), elongation ratio (Re), and length of overland flow (Lo), and has a negative association with drainage density (Dd) and drainage intensity (Di). It explains 13.8% of the total variance, and it represents the sub-basin “form component”. The fourth component has a positive association with the shape factor (Bs), lemniscates ration (k), basin length (Lb), and compactness coefficient ratio (Cc). It explains 10.133% of the total variance, and it represents the sub-basin “general shape component”. Principal Component 5 is strongly correlated to texture ratio (Tr), circularity ratio (Rc), and stream length (Lu), it therefore, represents the sub-basin “geometry components”. It explains 8.326% of the variance. Principal Component 6 is positively and highly loaded on basin relief (Bh), and relief ratio (Rr), and negatively correlated with time of concentration (Tc) parameters. It explains 6.4% of variance. It is appropriate to label it as the sub?basin “slope or steepness component”.
5.3. Cluster Analysis
Cluster Analysis (Ward’s method)was applied to the 43 sub-basins (the spatial units) based on 26 morphometric parameters, the achieved components values, drainage network parameters, basin geometry variables, drainage texture analysis, and relief characteristics parameters. Relatively, similar results were obtained from Cluster Analysis with reference to:
1) Dendrograms generated based on rotated component values, and the 26 morphometric parameters.
2) The spatial pattern of the distribution of 43 sub-basin cluster groups along the Zerqa River watershed.
3) All sub-basins examined in the analysis were classified.
Cluster Analysis was successful in classifying sub-basins into four different groups: sub-basins developed in the basalt geomorphological unit, sub-basins which are heavily influenced by rejuvenation processes and landslide activity, where dissected terrain and steep slopes are dominant. CA was also effective in grouping sub-basins influenced by major compressional structures characterizing the southeast part of the watershed. The results of cluster analysis are illustrate in Figure 10, which shows four different cluster groups below a fusion point of 6 of similarity coefficient. The spatial distribution of these cluster groups (Figure 11) is determined by tectonic, geomorphic, lithological, and structural controls. Variations in lithology (i.e., carbonate rocks and volcanic rocks) are responsible for creating a consistent sub-basins group conform with volcanic rocks. Here, successive flows are characterized by less erosion in terms of hypsometry, although barranco drainage lines initiated in old volcanic flows. The influence of geology (tectonic, structure and lithology) and geomorphic development (rejuvenation and landslide movements) on clustering was noticeable on each sub-basin group. Group I (Figure 11) correlates significantly with the Berin Structure, whereas, Groups II and III are associated with Wadi Shueib Structure, rejuvenation belt and carbonate rocks mainly the Nodular limestone and the Echinoidal limestone (Figure 5). Sub-basins accommodated in this category are characterized by incised drainage, dissected terrain, and steep slopes. Group III of the sub-basins is clustered within the western and northwestern part of the watershed. The Wadi Shueib Structure is terminated and flanked by old landslide activity, and rejuvenation processes. The longitudinal profile of the Zerqa River, reveals that the river is far from approaching grade since several breaks/interruptions can be seen along the course of the river. These interruption may be attributed to local variation in rock resistance, whereas, five major breaks could be regarded as rejuvenation points (−250 m, 100 m, 150 m, 550 - 600 m, 675 m) [54] since they coincide in at least 3 - 4 longitudinal profiles pertaining to wadis along the Jordan River-Dead Sea Rift. This fact is supported by the major breaks recognized for the projected profiles for W. Kerak [55] , and the presence of incised meanders (intrenched and ingrown meanders) in the middle and upper reaches of the wadi. Such features denote that rejuvenation processes occurred when the river was in the mature stage of its development, probably at the middle of Pleistocene. It seems that the upper three breaks along the profile (675 m, 550 - 600 m, and 450 m) are nickpoints truncating the Upper Miocene-Pliocene surface, and may have developed during the early stage of Pleistocene tectonics. By contrast, the lower two breaks (100 m and −250 m) are attributed to the Upper Pleistocene tectonics [23] [54] . Furthermore, Group IV is restricted to the Amman-Hallabat Structure, remnants of the Arabia surface (east of Amman) with subdued morphology, and dissected basalt rocks in the north east of the watershed.

Figure 10. Dendrogram resulted by CA for the 43 sub-basins of the Zerqa River watershed.

Figure 11. Spatial distribution of the cluster groups I-IV obtained by CA.
6. Conclusions
Morphometric analysis and classification of 43 sub-basins related to the Zerqa River catchment were implemented using DEM, GIS and multivariate statistical techniques. 26 morphometric variables were extracted using ASTER DEM, and subjected to Principal Component Analysis and Cluster Analysis. PCA which accounts for 79.3 of the total variation in the original data has been summed up in six major components. Of these, the “dimension” component contributes nearly 23% of the total variance of the 26 morphometric parameters, whereas, the second component accounts for nearly 18% of the total variance. Positive correlations exist between drainage texture, ruggedness number, and drainage density. By contrast, negative correlation is present between drainage intensity and compactness coefficients. Thus, this component is considered as the “intensity of dissection component”. The third component is positively correlated with the form factor, elongation ratio, and length of overland flow, therefore, it is designated as the “from” component, and accounts for about 14% of the total variance. The remaining components explain nearly 25% of the total variance, and represent sub-basin “shape”, “geometry”, and “slope” or “steepness” components. Cluster Analysis allows the 43 sub-basins to be classified into four different clusters, were the spatial distribution of these groups is determined significantly by tectonic, geomorphic, lithological, and structural factors. The four sub-basin groups established through CA are varied in terms of their morphometric properties.
To conclude the morphometric properties of the cluster groups (I-IV) of sub-basins can be seen with reference to Table 7. The morphometric properties of sub-basin groups can be explained thoroughly in terms of the evolution of drainage networks through fluvial erosion and hillslope processes, tectonic and structural deformation, uplifting, rejuvenation processes, and the influence of lithological variation (i.e., the presence of soft carbonate nocks, the Eocene sediment, and the older and younger basalts). Basin relief (Bh) or “total relief” is high within Groups II and IV. Group IV of the sub-basins is strongly affected by the Amman-Hallabat Structure (figure), basalt rocks, and the Eocene sediments in which the subdue remnants of the Arabia erosion surface has been developed.
Members of the Group II of sub-basins, located further west, are influenced mainly be rejuvenation stages of the Zerqa River watershed, and partially by the western and eastern flanks of the W. Shueib Structure. Drainage density (Dd) and stream frequency (Fs) values are higher for Groups I and II compared with Groups III and IV. Here, Group I is distributed mainly on younger and older basalt flows characterized by pronounced dissected hummocky to hilly (occasionally mountainous) topography (Figure 5), and bare rock is often exposed and showing weathered surfaces. Erosion has been active in the older basalts thus, initiating a dense network of ravines and barranco in the upper catchment of the Zerqa River. By contrast, group II is affected heavily by rejuvenation processes. Sub-basin area (A) values are higher for Group III and Group IV, and the total stream length (Lu) values are again higher for Group I and Group IV. The sub-basins (1, 2, 14, and 24) were developed on the rejuvenated belt, and the Amman-Hallabat Structure, and the widespread exposure of soft rocks of low shearing resistance. In this regard, weak structures, lithology, and rejuvenation accelerate erosion rates, thus, area (A) values are higher for Groups III and IV compared to the values related to Group I and Group II. Similarly, the total stream length (Lu) is found to be higher for sub-basins belonging to Groups I and IV. Once more, in comparative terms, the ruggedness number (Rn) values for the sub-basins accommodated in Groups I and III are higher than those for Groups II and IV. Group III in this context is situated in the core of the rejuvenation belt and Wadi Shueib and Berin Structures, and Group I represents the transitional zone between the rejuvenation belt and the dry eastern sector. The land here is highly dissected, associated with poly-cyclic topography, breaks of slopes, and steep slopes. Stream frequency (Fs) values are higher for sub-basins related to Group I and II in comparison with those values characterizing Groups III and VI. Hilly to mountainous landscape are notable for the basalt fields, consequently erosion processes are also active in this part of the watershed.
It is obvious how useful the Principal Component Analysis in isolating out the morphometric variables of least important, and grouping the remaining into significant components. With the help of multivariate statistical techniques, available morphometric data can be employed in modeling the hydrological responses, i.e., surface runoff and sediment yield from the Zerqa River watershed and the 43 sub-watersheds. Cluster Analysis helped to recognize sub-watersheds according to similarities based on the most effective components or morphometric parameters with high correlations. Morphometric analysis and GIS can be utilized effectively in prioritizing sub-watersheds for soil and water conservation measures. Furthermore, morphometric analysis can be employed
Table 7. Morphometric characteristics for each of the CA groups (I-IV).
in flash floods risk and floods hazard assessment for the Zerqa River watershed and other catchments draining to the Jordan valley.
Cite this paper
Yahya Farhan,Ibtisam Elmaji,Osama Khalil, (2016) GIS-Based Morphometric Analysis of Fourth-Order Sub-Basins of the Zerqa River (Northern Jordan) Using Multivariate Statistical Techniques. Natural Resources,07,461-480. doi: 10.4236/nr.2016.78048
References
- 1. Natural Resources Authority (1977) National Water Master Plan of Jordan. 8 Volumes, Essen.
- 2. Battikhi, A.M. and Arabiat, S. (1983) Constraints to the Successful Application of Modern Technology for Soil Conservation in Jordan. Dirasat Natural Sciences (Amman), 10, 129-166.
- 3. Lara, J.M. (1980) The 1980 Sedimentation Survey of King Talal Dam. Report, Jordan Valley Authority, Amman.
- 4. Al-Sheriadeh, M.S., Malkawi, A.H., Al-Hamdan, A. and Abderahman, N. (2000) Evaluating Sediment Yield at King Talal Reservoir from Landslides along Irbid-Amman Highway. Engineering Geology, 56, 361-372.
http://dx.doi.org/10.1016/S0013-7952(99)00119-2 - 5. Chorely, R. (1971) The Drainage Basin as the Fundamental Geomorphic Unit. In: Chorely, R., Ed., Introduction to Fluvial Processes, Methuen and Co. Ltd., London, 30-32.
- 6. Horton, R. (1945) Erosional Development of Streams and Their Drainage Basins: Hydrological Approach to Quantitative Morphology. Geological Society of America Bulletin, 56, 275-370.
http://dx.doi.org/10.1130/0016-7606(1945)56[275:EDOSAT]2.0.CO;2 - 7. Strahler, A.N. (1952) Dynamic Basis of Geomorphology. Geological Society of America Bulletin, 63, 923-938.
http://dx.doi.org/10.1130/0016-7606(1952)63[923:DBOG]2.0.CO;2 - 8. Strahler, A.N. (1957) Quantitative Analysis of Watershed Geomorphology. Transactions, American Geophysical Union, 138, 913-938.
http://dx.doi.org/10.1029/TR038i006p00913 - 9. Strahler, A.N. (1964) Quantitative Geomorphology of Drainage Basins and Channel Networks. In: Chow, V.T., Ed., Handbook of Applied Hydrology, McGraw-Hill, New York, 4-39/4-76.
- 10. Ebisemiju, F.S. (1985) Spatial Scale and Drainage Basin Morphometric Interaction. CATENA, 12, 261-270.
http://dx.doi.org/10.1016/S0341-8162(85)80024-2 - 11. Gardiner, V. (1978) Redundancy and Spatial Organization of Drainage Basin Form Indices: An Empirical Investigation of Data from North-West Devon. Transactions of the Institute of British Geographers, 3, 416-431.
http://dx.doi.org/10.2307/622121 - 12. Malik, J.N. and Mohanty, C. (2007) Active Tectonic Influence on the Evolution of Drainage and Landscape: Geographic Signatures from Frontal and Hinterland Areas along the North-Western Himalaya, India. Journal of Asian Earth Sciences, 29, 604-618.
http://dx.doi.org/10.1016/j.jseaes.2006.03.010 - 13. Marcus, A. (1980) First-Order Drainage Basin Morphology—Definition and Distribution. Earth Surface Processes and Landforms, 5, 389-398.
http://dx.doi.org/10.1002/esp.3760050408 - 14. Persons, A.J. (1980) Slope Profile Variability in First-Order Drainage Basins. Earth Surface Processes and Landforms, 7, 71-78.
http://dx.doi.org/10.1002/esp.3290070109 - 15. Yunus, A., Oguchi, T. and Hayakawa, U. (2014) Morphometric Analysis of Drainage Basins in the Western Arabian Peninsula Using Multivariate Statistics. International Journal of Geosciences, 5, 527-539.
http://dx.doi.org/10.4236/ijg.2014.55049 - 16. Mather, P. and Doornkamp, J. (1970) Multivariate Analysis in Geography with Particular Reference to Drainage-Basin Morphometry. Transactions of the Institute of British Geographers, 51, 163-187.
http://dx.doi.org/10.2307/621768 - 17. Mather, P. (1972) Areal Classification in Geomorphology. In: Chorely, R., Ed., Spatial Analysis in Geomorphology, Methuen and Co. Ltd., London, 305-332.
- 18. Subyani, A.M., Qari, M.H. and Mastah, M.I. (2012) Digital Elevation Model and Multivariate Statistical Analysis of Morphometric Parameters of Some Wadis, Western Saudi Arabia. Arabian Journal of Geosciences, 5, 147-157.
http://dx.doi.org/10.1007/s12517-010-0149-7 - 19. Ghimire, M. (2014) Multivariate Morphological Characteristics and Classification of First-Order Basins in the Siwaliks, Nepal. Geomorphology, 204, 192-207.
http://dx.doi.org/10.1016/j.geomorph.2013.08.004 - 20. Raux, J., Copard, Y., Laignel, B., Fournier, M. and Massei, N. (2011) Classification of Worldwide Drainage Basins through the Multivariate Analysis of Variables Controlling Their Hydrosedimentary Response. Global and Planetary Change, 76, 117-127.
http://dx.doi.org/10.1016/j.gloplacha.2010.12.005 - 21. Miller, J.R., Ritter, D.F. and Kochel, R.C. (1990) Morphometric Assessment of Lithologic Controls on Drainage Basin Evolution in the Graford Uplands, South-Central Indiana. American Journal of Science, 290, 569-599.
http://dx.doi.org/10.2475/ajs.290.5.569 - 22. Sharma, S.K., Gajbhiye, S. and Tignath, S. (2015) Application of Principal Component Analysis in Grouping Parameters of a Watershed for Hydrological Modeling. Applied Water Science, 5, 89-96.
http://dx.doi.org/10.1007/s13201-014-0170-1 - 23. Farhan, Y., Zregat, D. and Anbar, A. (2015) Assessing Farmers’ Perception of Soil Erosion Risk in Northern Jordan. Journal of Environmental Protection, 6, 867-884.
http://dx.doi.org/10.4236/jep.2015.68079 - 24. Magesh, N.S., Jitheshlal, K.V. and Chandrasekar, N. (2013) Geographical Information System-Based Morphometric Analysis of Bharathapuzha River Basin, Kerala, India. Applied Water Science, 3, 467-477.
http://dx.doi.org/10.1007/s13201-013-0095-0 - 25. Farhan, Y. (1986) Landslide in Central Jordan with Special Reference to the March 1983 Rainstorm. Singapore Journal of Tropical Geography, 7, 80-97.
http://dx.doi.org/10.1111/j.1467-9493.1986.tb00174.x - 26. Farhan, Y. (1999) Geomorphic Impacts of Highway Construction, Their Causes, and Remedies: A Case Study from Aqaba, Southern Jordan. The Arab World Geographer, 2, 1-25.
- 27. Bender, F. (1974) Geology of Jordan. Trans. MK Khdeir. Beitrage zur regionalen Geologie der Erde, Vol. 7, Gebruder, Borntraeger, Berlin.
- 28. Bender, F. (1975) Geology of the Arabian Peninsula: Jordan. United States Geological Survey Professional Paper 560-I, Washington DC.
- 29. Abed, A. (1982) Geology of Jordan, Amman. (In Arabic).
- 30. Salameh, E. (1980) Hydrogeology and Hydrochemistry in the Catchment Area of the King Talal Reservoir, Jordan. Zeitschritt der Deutschen Geologischen Gesellschaft, 131, 319-338.
- 31. Quennell, A. (1958) The Structure and Geomorphic Evolution of the Dead Sea Rift. Quarterly Journal of the Geological Society, 114, 1-24.
http://dx.doi.org/10.1144/gsjgs.114.1.0001 - 32. Burdon, D. (1959) Handbook of the Geology of Jordan. Benham and Co., Colchester.
- 33. Mickbel, Sh. and Zacher, W. (1981) The Wadi Shueib Structure in Jordan. Neues Jahrbuch fur Geologie und Palaeontologie Monatshefte, 9, 571-576.
- 34. Mickbel, Sh. and Zacher, W. (1986) Folded Structure in Northern Jordan. Neues Jahrbuch fur Geologie und Palaeontologie Monatshefte, 14, 248-256.
- 35. Atallah, M. and Mickbel, Sh. (1983) Geology and Structure of an Area East of the Dead Sea. Proceedings of the 1st Geological Conference, Amman, 6-8 September 1983, 392-414.
- 36. Fisher, W.H., Bowen-Jones, H., Atkinson, K., Beaumont, P., Smith, K. and Stevens, J. (1969) Soil and Land Potential Survey of the Highlands of North-West Jordan. University of Durham, Durham.
- 37. Water Authority (1985) Hydrological Records: Unpublished Raw Data. Amman, Jordan.
- 38. Farhan, Y. (1985) Geomorphological Mapping of Landslides Complex Area in a Part of the Zerqa River, Central Jordan. Annales de Geographie, 6, 31-36.
- 39. Miller, V. (1953) A Quantitative Geomorphic Study of Drainage Basin Characteristics in the Clinch Mountain Area, Virginia and Tennessee. Project NR 389-402, Technical Report 3, Columbia University, Department of Geology, ONR, New York.
- 40. Schumm, S. (1956) Evolution of Drainage Systems and Slopes in Badlands at Perth Amboy, New Jersey. Geological Society of America Bulletin, 64, 597-646.
http://dx.doi.org/10.1130/0016-7606(1956)67[597:EODSAS]2.0.CO;2 - 41. Horton, R. (1932) Drainage Basin Characteristics. Transactions, American Geophysical Union, 13, 350-361.
- 42. Gravelius, H. (1914) Grundriβ der gesamten Gewasserkund, Band 1: Fluβkunde. Compendium of Hydrology, 1, 265-278.
- 43. Ivanova, E., Nedkov, R., Ivanova, I. and Radeva, K. (2012) Morpho-Hydrographic Analysis of Black Sea Catchment Area in Bulgaria. Procedia Environmental Sciences, 14, 143-153.
http://dx.doi.org/10.1016/j.proenv.2012.03.014 - 44. Chorely, R., Donald, M. and Pogrzelsk, H. (1957) A New Standard for Estimating Drainage Basin Shape. American Journal of Science, 255, 138-141.
http://dx.doi.org/10.2475/ajs.255.2.138 - 45. Faniran, A. (1968) The Index of Drainage Intensity—A Provisional New Drainage Factor. Australian Journal of Science, 31, 328-330.
- 46. Hadley, R. and Schumm, S. (1961) Sediment Sources and Drainage Basin Characteristics in Upper Cheyenne River Basin. US Geological Survey Water-Supply Paper 1531-B, Washington DC, 198.
- 47. Singh, S. and Dubey, A. (1994) Geoenvironmental Planning of Watersheds in India. Chugh Publications, Allahabad, 28-69.
- 48. Reddy, G.P.O., Maji, A.K. and Gaibhiya, K.S. (2004) Drainage Morphometry and Its Influence on Landform Characteristics in Basaltic Terrain, Central India—A Remote Sensing and GIS Approach. International Journal of Applied Earth Observation and Geoinformation, 6, 1-16.
http://dx.doi.org/10.1016/j.jag.2004.06.003 - 49. Mather, P. (1986) Computational Methods and Multivariate Analysis in Physical Geography. Wiley, London.
- 50. Smith, K. (1950) Standards for Grading Textures of Erosional Topography. American Journal of Science, 248, 655-668.
http://dx.doi.org/10.2475/ajs.248.9.655 - 51. Magesh, M.S., Chandrasekar, N. and Soundranayagam, J.P. (2011) Morphometric Evaluation of Papanasam and Manimuthar Watersheds, Part of Western Ghats, Tirunelveli District, Tamil Nadu, India: A GIS Approach. Environmental Earth Sciences, 64, 373-381.
http://dx.doi.org/10.1007/s12665-010-0860-4 - 52. Chirala, U., Nooka Ratnam, K. and Gurram, M.K. (2012) Correlation of Geomorphometric Parameters for the Hydrological Characterization of Meghadrigedda Watershed, Visakhapatnam, India—A GIS Approach. International Journal of Engineering Science and Technology, 4, 3169-3183.
- 53. Doornkamp, J.C. and King, C. (1971) Numerical Analysis in Geomorphology. Edward Arnold, London.
- 54. Beheiry, S. (1969) Geomorphology of Central East Jordan. Bulletin de la Societe de Geographie d’Egypt, 41-42, 5-22.
- 55. Farhan, Y. (1971) Geomorphology of Wadi Mujib and Wadi Kerak, Central East Jordan. MA Thesis, University of Cairo, Cairo.