Natural Resources
Vol.4 No.1(2013), Article ID:28993,7 pages DOI:10.4236/nr.2013.41001
Hydrogen Production by Water Electrolysis Effects of the Electrodes Materials Nature on the Solar Water Electrolysis Performances
![]()
Unit of Research: Environment, Catalysis & Processes Analysis, National School of Engineers of Gabes, University of Gabes, Gabes, Tunisia.
Email: Romdhaneb.slama@gmail.com
Received October 26th, 2011; revised October 24th, 2012; accepted November 21st, 2012
Keywords: Hydrogen; Electrolysis; Photovoltaic; Electrodes; Corrosion
ABSTRACT
Our contribution in the production of hydrogen, vector of energy, consists in testing the water electrolysis by photovoltaic solar energy. The realization of some electrolysers whose electrodes are various materials, showed a clear difference from the point of view produced hydrogen flow, conversion efficiency, energy specific consumption and the electrodes lifespan. This made it possible to classify materials, by performances descending order, as follows: copper, lead, bronzes, aluminum, stainless, graphite and steel. However lead has a too low flow and aluminum corrodes quickly. Steel admits poor yield and lifespan. Then, we retain primarily copper like anode metal. To increase the hydrogen produced flow by electrolysis, the electrolysers parallel assembly choice is essential. According to the hour of the day, the evolution of the parameters such as consumed current, efficiency, and specific energy differs from a material with another, which can be explained by the variation of solar energy during the day.
1. Introduction
The importance of Hydrogen as an energy vector is not any more to show that is to supply the fuel cells or the internal combustion engines, while respecting the environment.
Various ways exist to produce hydrogen. Let us quote the reforming using the natural gas, cracking at high temperature etc.
The hydrogen solar production by brackish water electrolysis can be profitable because solar energy is free, abundant and clean, our Tunisian climate lends itself to it.
Thus, among the multiple hydrogen production ways, we chose the solar process of water electrolysis because we have a considerable potential of solar radiation. The electrolysers are locally manufactured and the process does not require high temperatures, not easily controllable and requiring solar continuation systems and a high investment [1-5].
Works are published on the water electrolysis but do not deal with the electrodes materials nature and their corrosion [6-10]. However some authors treat anode corrosion [11-14] and prefer to use platinum.
In the present experimental study, our initial goal is to produce hydrogen by water electrolysis, using photovoltaic solar energy [3-8,15]. However, we are confronted with the anode corrosion problem, therefore, seven different materials were tested; It is about copper, the mild steel, the stainless steel, bronze, graphite, aluminum and lead. During the tests, current soup and produced hydrogen flow are measured, and are deduced then the efficiency and energy necessary.
2. Experimental Protocol
2.1. Parameters of Calculation
Hydrogen production flow rate: Qv = V/t (m3/s)
with:
• Absorptive power by the electrolyser:
• Pa = U·I (W).
• Useful power of the electrolyser: Pu = PCI. Q·ρ (W) with PCI: lower thermal value of hydrogen (119.9 × 10⁶ J/Kg) ρ: density of hydrogen (0.09 Kg/m3).
• Consumed electric power: W = Pa·t (J).
• Useful efficiency: η = PCI·(V/(Pa·t))·ρ (−).
• Consumed electric power per unit of volume: W/V = Pa·t/V (J/cm3).
2.2. Photovoltaic Module and Electrolysers
A photovoltaic model with its panel, electrolysers and their electrodes made in various materials, are represented by the following photograph (Figure 1).
3. Role of the Electrodes Materials on the Electrolysis and the Anode Corrosion
It is that the electrodes materials nature has an influence, not only over their lifespan, but also on the hydrogen production and the energy consumption.
3.1. Corrosion Phenomenon
Corrosion is the result of the phenomenon which occurs when a metal is in contact with a gas reagent or liquid in wet underworld. It results from the interaction of the material surface with the surrounding medium. It can occur dry if the temperature is high; it is hot oxidation, or in aqueous underworld with the lower part of 100˚C, it is the wet corrosion which appears by a dissolution of metal following an electrochemical phenomenon and the formation of corrosion products.
It was noticed during electrolysis that the electrode anode corrodes until its rupture. Thus, we made a systematic study according to the material nature (steel, copper, stainless steel, graphite, aluminum, bronze and lead) to observe this phenomenon and to determine the operation life until total rupture of the electrodes. The
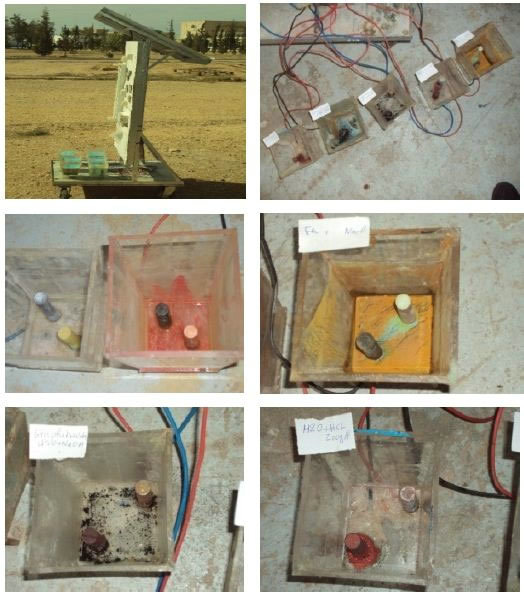
Figure 1. Photographs of the photovoltaic model and the electrolysers with their corroded electrodes.
influence of material nature on the performances was shown by plotting the load curves, efficiency and the consumed specific electric power.
3.2. UniInfluence of the Electrodes Nature on the Electrolysis Performances
The materials have varied electrochemical potentials, thus it is normal that they do not have the same performances hydrogen production: flow rate, efficiency, consumed specific energy. In our tests, seven electrolysers are assembled in parallel connexion (May 28, 2009).
3.2.1. Hydrogen Flow Rate Produced According to Time
To make comparisons between materials under identical conditions, the electrolysers are assembled in parallel with the photovoltaic module, and of measurements (current, voltage and time of filling of the test tube) are taken.
We deduce the produced hydrogen flow rate, the energetic efficiency and the consumed specific electric power.
It is noted that according to the hour, the produced hydrogen flow is not constant (Figure 2), because the terminal voltage of the photovoltaic module is not constant, contrary to the laboratory electric generators.
All the curves do not have the same appearance, a priori because of the materials conductivity (resistivity) variation; it is the case between copper and lead.
3.2.2. Hydrogen Production Efficiency According to Time
This efficiency is deduced following the measurements taken on the consumption by the electrolyser and the flow from produced hydrogen (Figure 3).

Figure 2. Produced hydrogen flow according to time and electrodes materials.
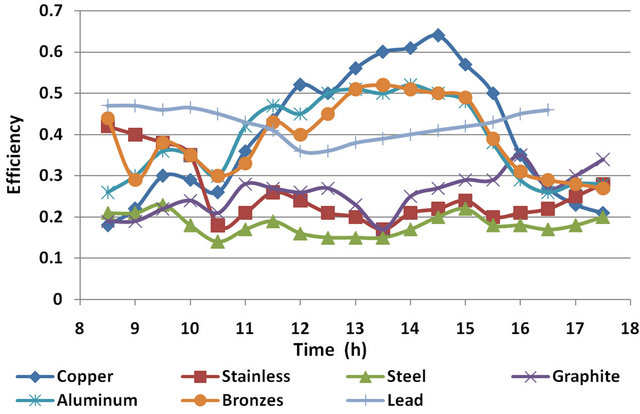
Figure 3. Useful efficiency according to time and electrodes materials (May 28, 2009).
The efficiency evolves according to the hour of the day for this parallel assembly of the electrolysers. For some materials (copper, bronzes and aluminum), this efficiency is maximum at the after midday beginning, for the others (lead, graphite, stainless and steel), the variation is more reduced and the efficiency is weaker (50% and 20% respectively).
3.2.3. Power Consumption per Unit of Produced Hydrogen Volume
For a material, the variation of the power consumption is weak throughout the day (Figure 4). The materials which had the best efficiency admit relatively weak power consumption here, and conversely.
3.3. Comparison, by the Crossed Sorting Method, between Electrodes Materials and Classification from the Productivity Point of View and Corrosion Resistance
The cross sorting is a hierarchisation method. In these case of comparison between various materials, the numbers corresponding to the difference of flow, efficiency etc between two materials given, are allotted.
Thereafter, a total of numbers is determined and a classification of the materials is granted.
3.3.1. Classification According to the Produced Hydrogen Flow
In Table 1 of crossed sorting, the indicated number represents the produced hydrogen flow difference in cm3/mn.
For a given material, one counts these numbers in line and column.
Among materials tested, copper is classified the first from the point of view of produced hydrogen flow, come then in the preferably descending order: stainless, aluminum, steel, graphite, bronze and lead in the last.

Figure 4. Specific power consumption according to time and electrodes materials.
3.3.2. Classification According to the Energetic Efficiency η
By applying the crossed sorting, Table 2 makes it possible to classify materials by preferably order from the energetic efficiency point of view.
As for the flow, copper is classified the first from the point of view energetic efficiency, come then in the order descending preferably bronze, lead, aluminum, stainless and graphite, and in the last steel.
3.3.3. Classification According to the Energy Specific Consumption W/V (J/cm3)
By applying the crossed sorting, Table 3 makes it possible to classify materials by preferably order from the specific consumed energy point of view for the hydrogen production.
As for the flow and the efficiency, copper is always classified the first from specific energy consumption point of view in exico with the aluminum and lead, come then in the preferably descending order bronze, graphite, aluminum, stainless and lastly steel.
3.3.4. Lifespan of Electrodes
Table 4 makes it possible to classify materials according to their lifespan.
Here, copper is classified second. The first rank is in favor of lead, and then come in preferably descending order: bronze, graphite, stainless, steel, and aluminum in last.
3.3.5. Total Classification
The nature of materials influences thus all the performances of electrolysis: flow of produced hydrogen, energetic efficiency, consumption of energy and lifespan of the electrodes.
The total classification (Table 5) puts copper in first; it
Table 1. Application of the sorting crossed for the produced hydrogen flow.
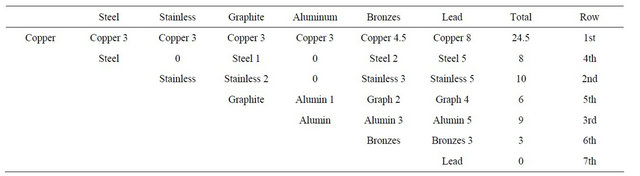
Table 2. Application of the sorting crossed for the hydrogen production efficiency.
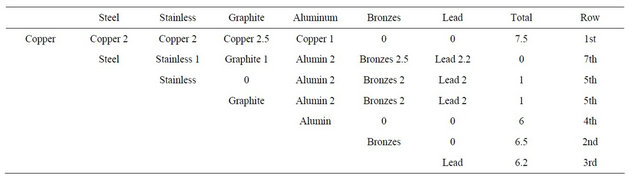
Table 3. Application of the sorting crossed for consumed specific energy.
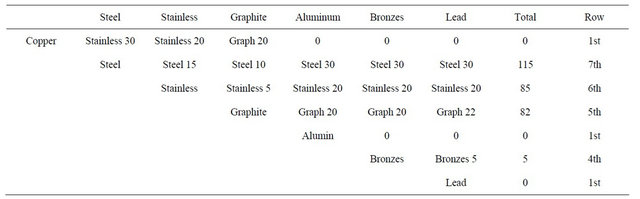
Table 4. Application of the sorting crossed for the lifespan of the electrodes.

Table 5. Total classification of materials.
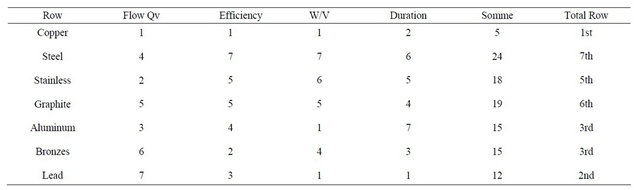
was already for three classifications out of four. Let us note that in another field, copper is also usually used for the water conduits, strongly subjected with corrosion.
The second rank is in favor of lead, however this one is not favorite for us because of its too weak hydrogen flow. Let us note however that lead is usually used in the electric battery perhaps because of its durability.
After, come bronze and aluminum. This last is to be excluded because of its too weak lifespan, itself due to its too low electrochemical potential. The last three materials are graphite, stainless and the steel which is also in efficiency and consumption of energy.
If we eliminate the materials which are classified at least once at the last row i.e. steel, lead, and aluminum. The remaining materials are in the preferably descending order: copper, bronze, stainless and graphite.
3.4. Some Common Mistakes
By having different electrodes, it is that the performances increase. One of the electrodes remained out of copper, the other out of iron or aluminum.
3.4.1. Electric Current Consumed According to the Terminal Voltage of the Electrolyser
These experiments are carried out for the same conditions such as the temperature with 25˚C and the atmospheric pressure.
One takes the water of tap with the addition of NaCl like electrolyte for all the tests with the various electrodes types.
The variation of the consumed current follows one of the two paces, according to the electrodes metals nature (Figure 5):
• For the homogeneous electrodes (copper used in our case), the consumed current remains weakest;
• However for the heterogeneous electrodes, the current is more raised and increases definitely more quickly, already even with the weak voltages applied. The current also changes when we permute the power
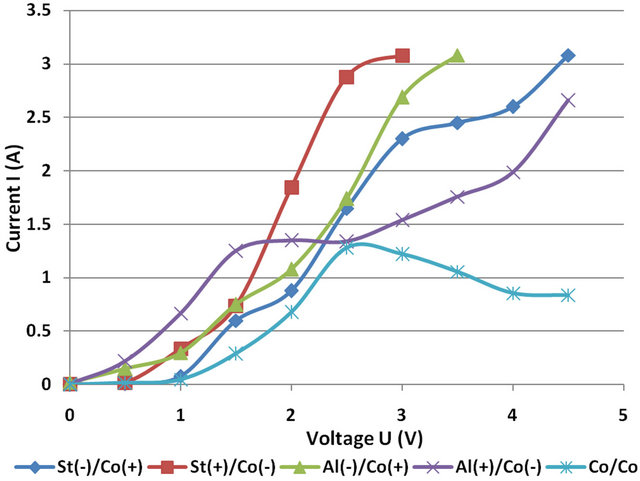
Figure 5. Current intensity variation according to the terminal voltage of the electrolyser.
supply between two metals of the couple of electrodes, anodes and cathode.
3.4.2. Released Hydrogen Flow
All these practice works are made with the ambient air, a temperature of approximately 25˚C and under the atmospheric pressure. The hydrogen release flow is calculated by knowing the filling time of a test tube, volume 27 cm3.
The histogram of Figure 6 makes it possible to emit a certain number of remarks:
Firstly, it is noticed that all the electrolysers have remarkable flows.
Secondly, the lowest flow is in the case where the anode and cathode are out of copper. The homogeneous choice of the two copper electrodes, like usually makes, generates a hydrogen flow lower than if the electrodes are heterogeneous.
Thirdly, the best produced hydrogen flows are for the electrolysers whose their electrodes steel/copper (the anode is out of steel and cathode is out of copper) and aluminum/copper (the anode is out of copper and cathode is out of aluminum).
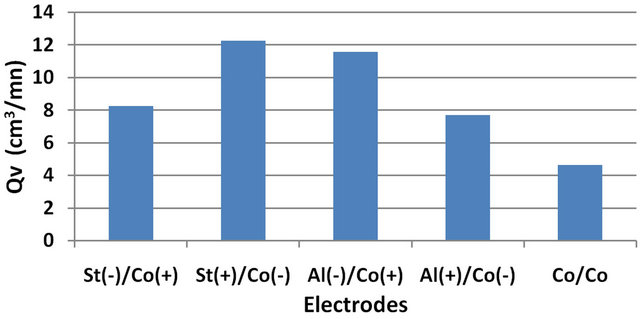
Figure 6. Produced hydrogen flow according to the metal couple of the electrolyser electrodes. Salted tap water (200 g/l).
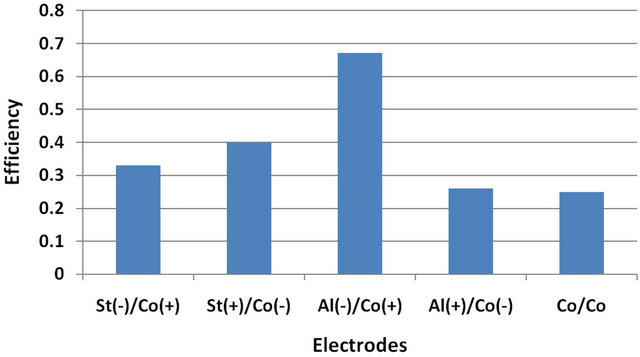
Figure 7. Electrolysis efficiency according to the electrodes metal couple. Salted tap water (200 g/l).
3.4.3. Electrolyser Efficiency
The efficiency characterizes the released hydrogen quantity, on the level of cathode, by the consumed electric power throughout one given time.
The histogram of Figure 7 shows, that for the electrolyser whose metals of electrodes are homogeneous, until now used, the output is in fact weakest, as for the case of the flow. The couple aluminum/copper, with copper anode, makes it possible to reach a considerable efficiency. This can be explained by the difference of electropositivity between copper and aluminum.
3.4.4. Consumed Electric Power
Contrary to the hydrogen flow and the efficiency which one seeks to maximize, here, the consumed electric power is rather to minimize (Figure 8). There still, it is the electrodes couple of aluminum/copper, with copper anode, which is the best; its advantage is accentuated. Even if the electrodes couple of copper/copper consumes low power, it is not favorite because it generates a low flow and an efficiency compared to the couple aluminum/ copper.
3.4.5. Consumed Specific Electric Power
The consumed electric power per produced hydrogen volume unit is the best parameter of comparison between the electrodes metal couples. Theoretical energy necessary for the decomposition of the water molecule in hy-
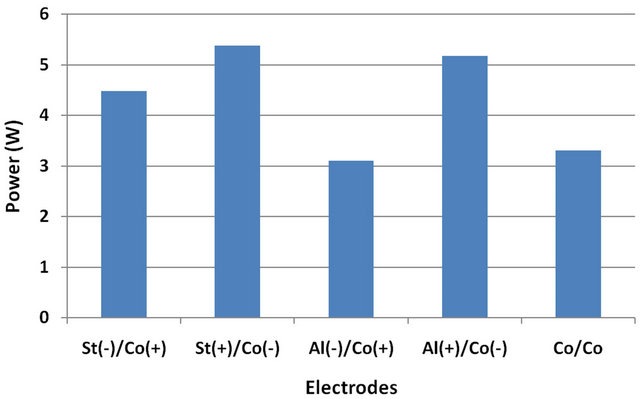
Figure 8. Consumed electric power during electrolysis according to the metal couple of the electrodes. Salted tap water (200 g/l).
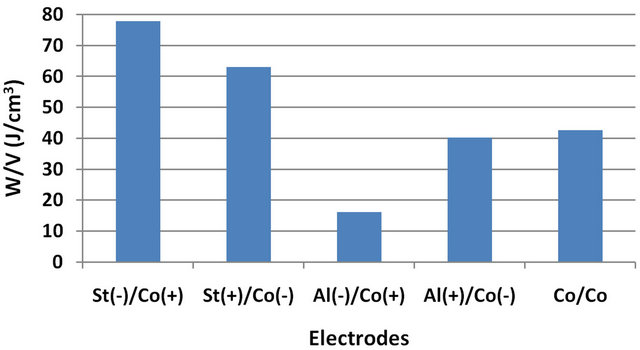
Figure 9. Electric power consumed by the eletrolyser according to the metal of electrode. Tap water (200 g/l).
drogen and oxygen is of 286 kJ/mol, that is to say 12.76 J/cm3.
The results of Figure 9 prove once again that the electrodes couple of Aluminum/copper, with copper anode, is better and even much better than the other couples of studied materials, the performance point of view, and even from the point of view lifespan of the copper anode as that was shown during previous studies.
4. Interpretation
The influence of the electrodes materials nature of electrolysers was shown that it is on the hydrogen production flow, the energetic efficiency, consumed specific energy or their lifespan before deterioration.
Classification according to all these comparison criterions makes it possible to order objectively materials.
However, with heterogeneous electrodes the performances can be still improved; it is the case for the electrodes aluminum/copper, with copper anode to resist at the corrosion. The flow and the efficiency more than doubled. On the other hand, the specific power consumption is in contrary well reduced.
5. Conclusions and Prospects
In the case of electrolysers including electrodes made out of homogeneous materials, the performances concerning the produced hydrogen flow, energetic efficiency and power consumption are better for copper and bronze among studied materials. Lead appears to be interesting, however, the corresponding hydrogen flow is too low. Aluminum is in the same way interesting but its lifespan is too weak. The other tested materials: steel, stainless and graphite are to be drawn aside for their weak performances so much the hydrogen flow, the efficiency and the power consumption.
The tests carried out with heterogeneous materials electrodes in the same way related to the determination of these same performances.
Like the electrodes couple of Aluminum/copper gives the best performances (high flow and efficiency, weak power consumption), we envisages to do better by replacing aluminum by magnesium; this last has indeed an electrochemical potential lower than the aluminum and thus the potential difference with copper is increased.
REFERENCES
- E. Bilgen, “Solar Hydrogen from photovoltaic Eletrolizer Systems,” Energy Conversion and Management, Vol. 42, No. 9, 2001, pp. 1047-1057. doi:10.1016/S0196-8904(00)00131-X
- S. H. Jensen, et al., “Hydrogen and Synthetic Fuel Production from Renewable Energy Sources,” International Journal of Hydrogen Energy, Vol. 32, No. 15, 2007, pp. 3253-3257.
- R. Ben Slama, “Production of Hydrogen by Electrolyse of Water and Photovoltaic Energy,” Proceeding of the 3rd International congress on Renewable Energies and Environment CERE, Mahdia, 6-8 November 2006.
- R. Ben Slama, “Tests on the Solar Hydrogen Production by Water Electrolysis,” Proceeding of the JITH, Albi, 28- 30 August 2007.
- R. Ben Slama, “Solar Hydrogen Generation by Water Electrolysis,” Proceeding of the 1st Francophone Conference on Hydrogen: Energy Vector, Sousse, 9-11 May 2008, pp. 7-13.
- R. Ben Slama, “Génération d’Hydrogène par Electrolyse Solaire de l’Eau,” Proceeding des Journées Annuelles 2008 Société Française de Métallurgie et de Matériaux, Paris, 4-6 June 2008.
- R. Ben Slama, “Influence of Material of the Electrodes on the Solar Water Electrolysers for Production of Hydrogen,” 2nd International Conference on Hydrogen Energy: ICHE10, Hammamet, 9-11 May 2010.
- R. Ben Slama, “Comparaison Entre les Matériaux d’Electrodes d’Electrolyseur Pour la Production d’Hydrogène Solaire,” 1ère Conférence Maghrébine sur les Matériaux et l’Energie, Gafsa, 26-28 Mai 2010.
- F. Jomarda, J. P. Ferauda and J. P. Caire, “Numerical Modeling for Preliminary Design of the Hydrogen Production Electrolyzer in the Westinghouse Hybrid Cycle,” International Journal of Hydrogen Energy, Vol. 33, No. 4, 2008, pp. 1142-1152
- S. A. Grioriev, et al., “Pure Hydrogen Production by PEM Electrolysis for Hydrogen Energy,” International Journal of Hydrogen Energy, Vol. 31, No. 2, 2006, pp. 171-175. doi:10.1016/j.ijhydene.2005.04.038
- P. H. Floch, et al., “On the Production of Hydrogen via Alkaline Electrolysis during Off-Peak Periods,” International Journal of Hydrogen Energy, Vol. 32, No. 18, 2007, pp. 4641-4647. doi:10.1016/j.ijhydene.2007.07.033
- F. Jomard, et al., “Numerical Modelling for Peliminary Design of the Hydrogen Production Elecrolyzer in the Westinghouse Hybrid Cycle,” International Journal of Hydrogen Energy, Vol. 33, No. 4, 2008, pp. 1142-1152.
- L. Solera, J. Macanása, M. Muñoza and J. Casado, “Electrocatalytic Production of Hydrogen Boosted by Organic Pollutants and Visible Light,” International Journal of Hydrogen Energy, Vol. 31, No. 1, 2006, pp. 129-139. doi:10.1016/j.ijhydene.2004.11.001
- M. Cooper and G. Botte, “Hydrogen Production from the Electro-Oxidation of Ammonia Catalyzed by Platinum and Rhodium on Raney Nickel Substrate,” Journal of the Electrochemical Society, Vol. 153, No. 10, 2006, pp. A1894-A1901.
- L. Chatbri, “Traitement des Eaux Usées et Recupération de l’Hydrogène,” ISSATG, Gabes, 2010.
Nomenclatures:
I: Electrical current (A);
U: Voltage (V);
P: Power (W);
PCI: Lower heating value (J/kg);
Qv: Flow rate (m3/s);
V: Volume of the test tube (m3);
t: Tube filling time (s);
W: Electrical energy (J);
ρ: Density of hydrogen (Kg/m3);
Al: Aluminum;
Co: Copper;
St: Steel.
Indices:
a: Absorbed;
u: Useful;
nom: Nominal;
ab: Absorbed.