Open Journal of Endocrine and Metabolic Diseases
Vol.3 No.7(2013), Article ID:39668,8 pages DOI:10.4236/ojemd.2013.37036
Metformin Modulates GLP-1- and GIP-Mediated Intracellular Signaling under Normoglycemic Conditions
1Division of Diabetes, Metabolism, and Endocrinology, Department of Internal Medicine, Showa University School of Medicine, Tokyo, Japan
2Department of Pharmacogenomics, Showa University School of Pharmacy, Tokyo, Japan
3Department of Pathophysiology, Showa University School of Pharmacy, Tokyo, Japan
4Monoclonal Antibodies Unit, Biotechnology Program, Centro Nacional de Investigaciones Oncologicas (CNIO), Madrid, Spain
Email: *tanego@pharm.showa-u.ac.jp
Copyright © 2013 Kyoko Shinmura et al. This is an open access article distributed under the Creative Commons Attribution License, which permits unrestricted use, distribution, and reproduction in any medium, provided the original work is properly cited.
Received October 1, 2013; revised October 25, 2013; accepted October 31, 2013
Keywords: Metformin; GLP-1; GIP; Calcium; cAMP; Insulin Secretion
ABSTRACT
GLP-1 and GIP promote insulin secretion from pancreatic β-cells by inducing intracellular signals such as Ca2+ and cAMP. Metformin primarily acts by inhibiting glucogenesis in the liver and promoting glucose metabolism in the muscle. It is used as a concomitant drug with the incretin in the treatment of T2D. We focused on intracellular signals under various glucose concentrations and assessed the effects of metformin on incretin signaling in MIN6 β-cells. Metformin inhibited incretin-induced [Ca2+]i in the presence of 5.5 mM glucose but not 16.7 mM glucose. In accordance with low [Ca2+]i, insulin secretion from MIN6 cells declined, despite enhanced incretin-induced cAMP production. Abundant expressions of Adcy 6 and 9, which are negatively controlled by Ca2+ signals, were detected in MIN6 cells. Thus, increasing cAMP production was associated with the inhibition of Ca2+ mobilization by metformin. However, we show that metformin controls insulin secretion by inhibiting incretin-mediated [Ca2+]i under normoglycemic conditions.
1. Introduction
Metformin is commonly used in the treatment of type 2 diabetes and improves insulin sensitization and glucose metabolism [1]. Metformin acts mainly by inducing liver and skeletal muscle serine/threonine kinase B1 (LKB1), which activates AMP-activated protein kinase (AMPK) by phosphorylating Thr 172 of the AMPK α chain [2]. However, in cell free assays, metformin activated LKB1 and AMPK by an indirect mechanism, and failed to induce phosphorylation of AMPK [3]. In another study, over expression of AMPK in MIN6 cells, which is pancreatic mouse β cell lines established from insulinomas, inhibited insulin secretion in the presence of high glucose concentrations [4]. The incretin peptides GLP-1 (glucagon-like peptide 1) and GIP (glucose-dependent insulinotropic polypeptide), which are the gut derived hormones secreted by L cells and K cells, respectively, after nutrient ingestion, are blood glucose-lowering hormones that potentiate insulin secretion in response to glucose [5]. Receptors of these incretins, GLP-1R and GIPR are G protein-coupled receptors (GPCR) that activate the classical signaling cascade through Gs and adenylate cyclase (Adcy), leading to increased cAMP production [6,7]. Incretins can also mobilize stored Ca2+ in intracellular organelles by activating ryanodine (RYR) [8] and inositol 1, 4, 5-trisphosphate receptors (IP3R) [9]. These two small molecules, cAMP and Ca2+, are critical for incretin signaling. Reportedly, metformin can inhibit the activities of liver Adcy enzymes [10], which include 9 membrane proteins (Adycs 1 to 9) and one soluble protein (Adcy 10) and produce cAMP from ATP at the plasma membrane. Several signaling molecules, such as Ca2+, calmodulin, protein kinase C (PKC), calcineurin (CaN), and G proteins, participate in the regulation of Adcys. Adcys 5 and 6 are directly inhibited by Ca2+ [11,12], whereas Adcys 1 and 8 are activated by Ca2+-CaM binding [13,14]. As a regulator of endoplasmic reticulum (ER) Ca2+ mobilization, cAMP promotes insulin granule exocytosis [9,15]. Protein kinase A (PKA) and cAMP-activated exchange proteins (EPAC), which are cAMP binding signal proteins, play central roles in these mechanisms [15-17]. Hence, Ca2+ and cAMP can mutually regulate each other under various conditions. In the present study, we examined the responses of these two small molecules to incretins and assessed the actions of metformin against incretin signaling. In addition, we assessed the expression of the key metformin responsive protein LKB1.
2. Material and Methods
2.1. Maintenance of the MIN6 β Cell Line
MIN6 cells were provided by Dr. J. Miyazaki and were cultured in high-glucose (25 mM glucose) DMEM containing 10% fetal bovine serum (FBS), streptomycin, and penicillin according to the provider’s procedure [18].
2.2. Measurement of cAMP Production
MIN6 cells were transfected with 3 µg of pGloSensor™ 20F cAMP plasmid (cAMP sensor protein expression vector; Promega KK., WI, USA) per 2 × 10⁶ cells using Neon™ Transfection System (Life technologies Co., CA, USA), and 3 × 10⁵ transfected cells were seeded into 96 well white plates. Cells were incubated in DMEM containing 0.1% bovine serum albumin (BSA) at 37˚C for two days, and the medium was replaced with medium containing indicated concentrations of metformin. After culturing for 2 h, the medium was replaced with CO2- independent equilibration medium (Life Technologies Co, Carlsbad, CA) containing 6% v/v GloSensor™ cAMP reagent (Promega) and 0.1% BSA according to the manufacturer’s instructions. Cells were incubated at room temperature for a further 2 h and stimulated with 10 nM GLP-1 or GIP in HEPES-buffered saline (HBSS) containing 107 mM NaCl, 6 mM KCl, 1.2 mM MgSO4, 2 mM CaCl2, 1.2 mM KH2PO4, 20 mM HEPES, and 5.5 or 16.7 mM glucose at pH 7.4. Luminescence was sequentially measured using a Varioskan Flash (Thermo Fisher Scientific Inc., MA, USA). Data were corrected for basal luminescence and mean ± standard deviation (SD) luminescence per well were calculated and presented.
2.3. Measurement of Intracellular Ca2+ Concentrations
Two glass coverslips (3 × 10 mm, thickness 0.12 - 0.17 mm; Matsunami Glass Inc., Osaka, Japan) were set on 24 well plates before seeding and culturing MIN6 cells in DMEM supplemented with 10% FBS in a humidified atmosphere with 5% CO2 at 37˚C overnight. Medium was then replaced with DMEM containing 0.1% BSA and indicated concentrations of metformin, and cells were incubated at 37˚C for 2 h. Subsequently, the calcium indicator Fura-2 AM (5 µM) was added and cells were incubated for 40 min in DMEM supplemented with 1% FBS. Cells on coverslips were washed and perfused with HBSS containing 10 nM GLP-1 and GIP. Cytosolic Ca2+ concentrations were measured using a 2-wavelength excitation method (340 nm/380 nm) according to the previous report [19] and mean background was subtracted from each value. Data are presented as mean ± SD peak delta ratios.
2.4. Insulin Secretion Analysis
MIN6 cells were seeded into 48 well plates and were cultured to 60% - 70% confluence. Prior to treatment, medium was replaced and supplemented with 0.1% BSA, and cells were incubated at 37˚C overnight. Subsequently, the medium was replaced with fresh medium containing 0.1% BSA and indicated concentrations of metformin, and cells were incubated for 2 h at 37˚C. Medium was then replaced with HBSS containing 8 mM glucose and 0.1% BSA, and the cells were incubated for 40 min at 37˚C. After washing with PBS, cells were incubated in 2 mM Ca2+ buffer containing 5.5 or 16.7 mM glucose, 0.1% BSA, and 10 nM GLP-1 or GIP for 60 min at 37˚C. Supernatants were collected for insulin analysis and cells were lysed for total protein determinations. Supernatant insulin concentrations were measured using a Mouse Insulin ELISA KIT (TMB; AKRIN-011T, Shibayagi, Gunma, Japan). Data were expressed relative to total protein concentrations of lysates.
2.5. Western Blotting
MIN6 cells were seeded into 12 well plates and were cultured to 60% - 70% confluence. Prior to treatment, the medium was replaced and supplemented with 0.1% BSA, and cells were incubated at 37˚C overnight. Medium was then replaced with new medium containing 0.1% BSA, and cells were incubated for 10 min. Subsequently, indicated concentrations of metformin were added and cells were incubated at 37˚C for indicated times. Supernatants were removed and treatments were stopped by the addition of 50 µL lysis buffer containing PhosSTOP and Complete (Roche Diagnostics, Mannheim, Germany). Lysates were sonicated and centrifuged for 5 min at 15,000 rpm at 4˚C. Protein concentrations were determined using a BCA protein assay (Thermo Fisher Scientific) and 60 µg of protein/lane were separated by SDSPAGE using e-PAGEL (ATTO Co., Tokyo, Japan) and were electro transferred onto nitrocellulose membranes using a Trans-Blot Turbo Transfer System (Bio-Rad Laboratories Inc., Hercules, CA) for 30 min at 25 V. Membranes were then probed with the following monoclonal antibodies: phospho-LKB1 (Ser 428) rabbit mAb (C67A3; Cell Signaling Tech., Danvers, MA), LKB1 mouse mAb (Ley 37D; CNIO, Madrid, Spain), and β- actin mouse mAb (AC-15; Abcam plc, Cambridge, UK). Immunoreactive bands were visualized using an HRPlabeled secondary antibody and enhanced chemiluminescence. Protein bands were quantitated by densitometric analysis using the GS-800 instrument (Bio-Rad).
2.6. Quantitative PCR
Total RNA was isolated from MIN6 cells using RNAiso Plus reagent (Takara Bio Inc., Shiga, Japan), and 2-µg aliquots were converted into cDNA using an Applied Biosystems High Capacity cDNA Reverse Transcription Kit (Life Technologies Co, Carlsbad, CA). Expression of Adcy 1 (NM_009622.1), Adcy 2 (NM_153534.2), Adcy 3 (NM_138305.3), Adcy 4 (NM_080435.1), Adcy 5 (NM_ 001012765.4), Adcy 6 (NM_007405.2), Adcy 7 (NM_ 001037723.3), Adcy 8 (NM_009623.2), Adcy 9 (NM_ 009624.2), and β-actin (NM_007393.3) mRNAs were determined by real-time PCR using an Applied Biosystems TaqMan Fast Universal Master Mix and gene specific TaqMan primer probe sets (Adcy 1, Mm01187829_ m1; Adcy 2, Mm00467874_m1; Adcy 3, Mm00460371_ m1; Adcy 4, Mm00475491; Adcy 5, Mm00674122_m1; Adcy 6, Mm 00475772_m1; Adcy 7, Mm00545780_m1; Adcy 8, Mm00507722_m1; Adcy 9, Mm 00507743_m1; and β-actin, 4352933E). Fluorophore-based detection using TaqMan probes forms the basis for real-time monitoring. Realtime PCR was performed using an Applied Biosystems STEP ONE thermal cycler. Data were normalized to the expression of β-actin.
2.7. Statistics
Statistical comparisons were performed with simple main effect test, or ANOVA with Bonferroni/Games—Howell post-hoc tests, as appropriate. Results are presented as means ± SD. All statistical analyses were performed using SPSS for Windows (SPSS Inc., Chicago, Ill., USA).
3. Results
3.1. Increasing cAMP Production in Response to Metformin-Induced GLP-1 and GIP
MIN6 cells were treated with 10 nM GLP-1 or GIP in the presence of 5.5 or 16.7 mM glucose, and cAMP production was monitored for 40 min (Figures 1(a) and (b)). Pretreatment with metformin for 2 h significantly enhanced incretin-induced cAMP production by 1.7-fold in the presence of 5.5 mM glucose, but this was not metformin dose-dependent. In contrast, in the presence of 16.7 mM glucose, metformin had no effect on incretininduced cAMP production. These data suggest that metformin positively regulates incretin-induced cAMP production in normoglycemic conditions.
3.2. Modulation of GLP-1-Mediated [Ca2+]i by Metformin
MIN6 cells were stimulated with 10 nM GLP-1 or GIP in the presence of 5.5 or 16.7 mM glucose. Immediate increases in [Ca2+]i were observed (Figure 2), particularly with GLP-1 under both glucose concentrations, whereas in the absence of added glucose, the response was significantly lower (data not shown). Nonetheless, even in the absence of added glucose, glibenclamide induced a Ca2+ delta ratio response of 0.423 ± 0.321 (diffuse SD value caused by the different oscillation timing of individual cells) by binding the sulfonylurea receptor and activating L-type voltage dependent Ca2+ channels (VDCC; data not shown). Given the small Ca2+ response to GIP, we analyzed the mechanisms of GLP-1-induced [Ca2+]i. In the presence of 5.5 mM glucose, GLP- 1-mediated increments of [Ca2+]i were reduced to approximately 20% after pre-treatment with 1 mM metformin (p < 0.05, Figure 2(a)), but were not decreased in the presence of 16.7 mM glucose (Figure 2(b)). Moreover, this decreased depended on pre-incubation time with metformin, with a maximum inhibitory effect after 2 h (p < 0.05, Figure 2(c)). In the presence of 5.5 mM glucose, treatment with 1 mM metformin and 10 nM GLP-1 did not result in decreased [Ca2+]i responses (Figure 2(a)).
3.3. Effects of Metformin on GLP-1- and GIP-Induced Insulin Secretion
Treatment with 10 nM GLP-1 or GIP enhanced insulin secretion in the presence of 5.5 mM glucose (Figure 3), whereas 2 h-pretreatment with >100 μM metformin blocked this effect in the presence of 5.5 mM glucose, no effect of metformin was observed in the presence of 16.7 mM glucose (Figure 3(a)). Furthermore, 2 h-pretreatment with >10 μM metformin significantly reduced GIPinduced insulin secretion in the presence of 5.5 mM glucose, but not in the presence of 16.7 mM glucose (Figure 3(b)). These data corroborate the inhibition of Ca2+ responses by metformin and suggested that Ca2+ plays a more critical role in insulin secretion than cAMP.
3.4. Activation of LKB1 by Metformin
Metformin is known to induce phosphorylation of LKB1 at Ser 428. Thus, we determined LKB1 phosphorylation following treatment with metformin and observed peak LKB1 phosphorylation after treatment with >10 µM metformin for 60 min (p < 0.05; Figures 4(a) and (b)). Vehicle alone (None) induced LKB1 phosphorylation but
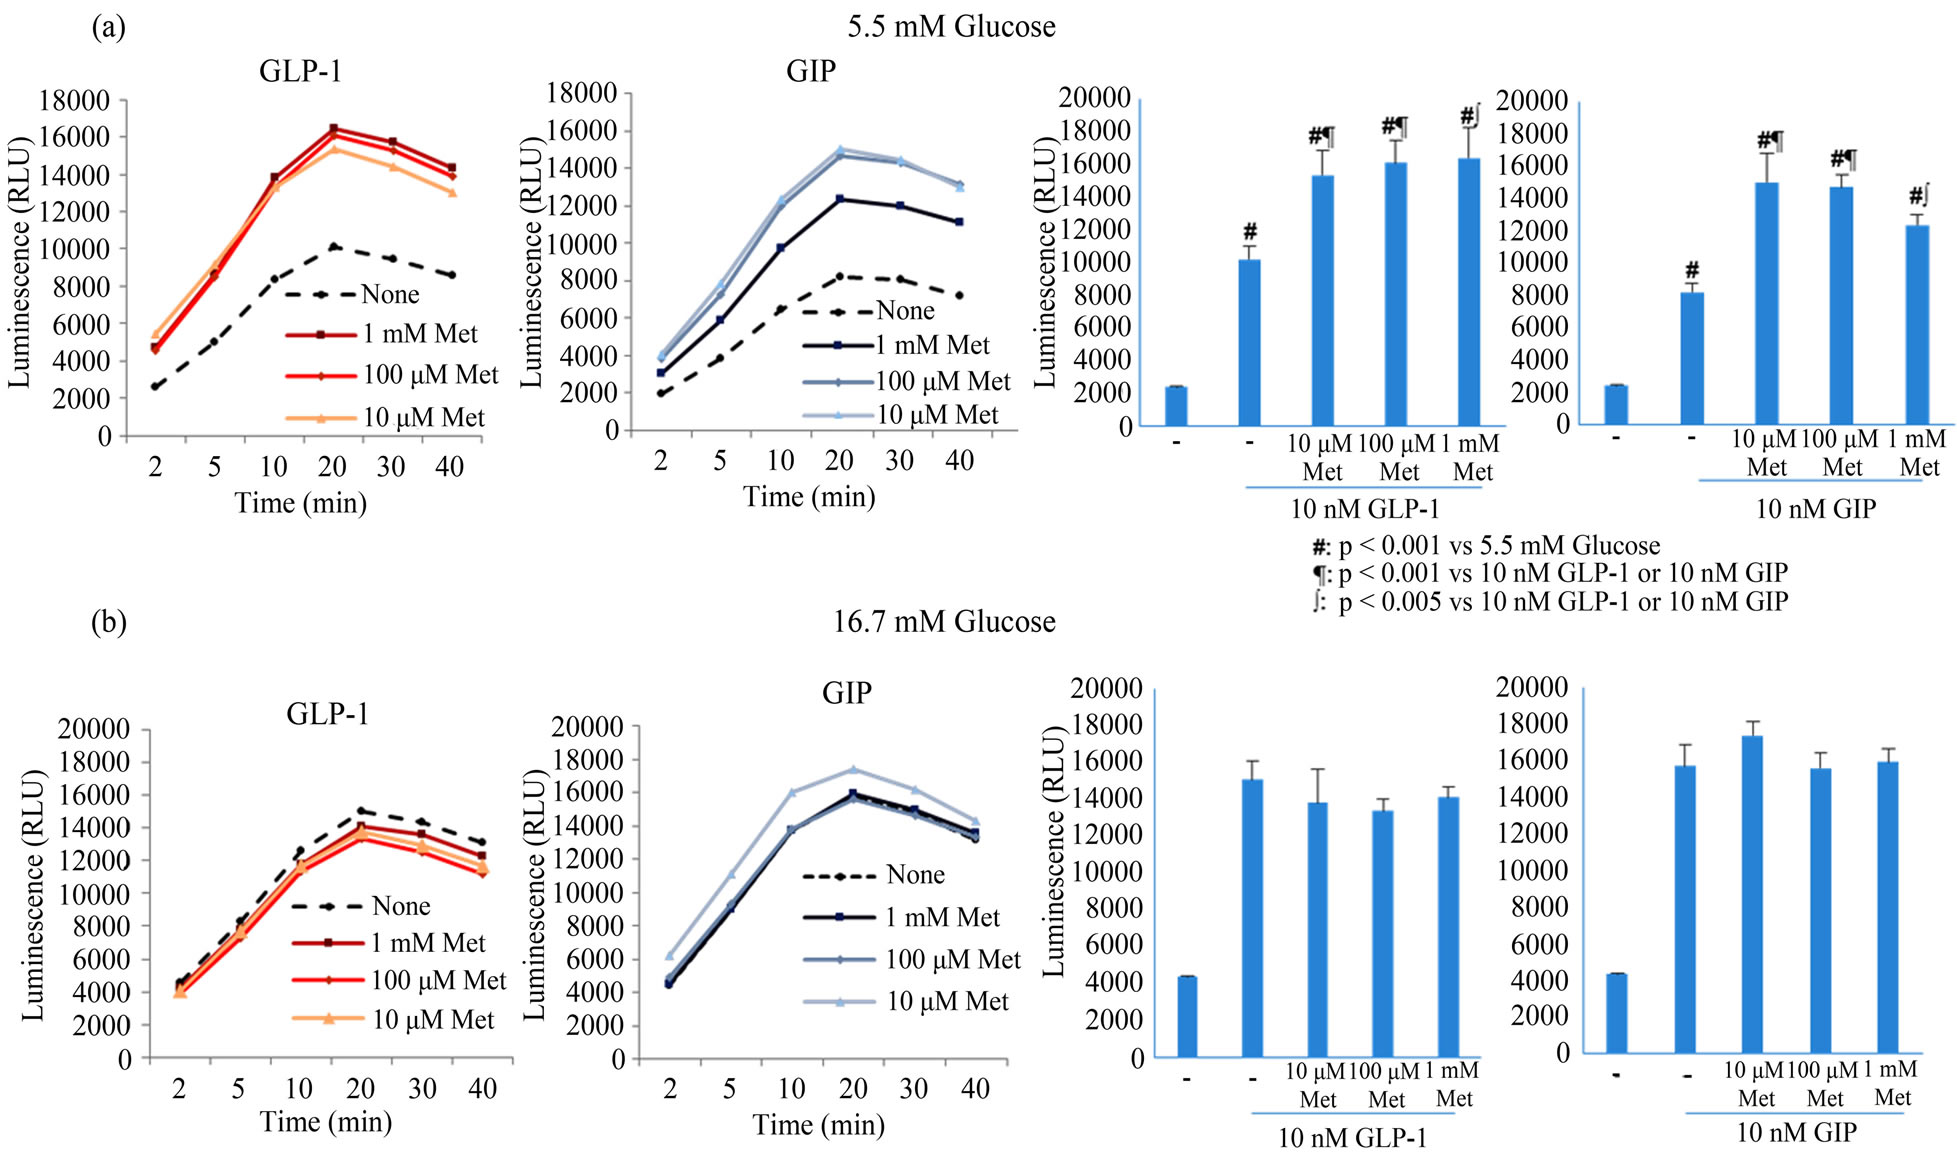
Figure 1. The influence of metformin on cAMP production in MIN6 cells treated with 10 nM GLP-1 or GIP in the presence of 5.5 (a) or 16.7 mM glucose (b). MIN6 cells were stimulated with 10 nM GLP-1 or GIP in HBSS after 2 h-pretreatments with 0 μM (circle), 10 µM (triangle), 100 µM (rhombus), or 1 mM metformin (square), and luminescence was measured for 40 min. Luminescence at 20 min is shown in bar graphs. All data were reproduced in 3 - 5 independent experiments. Data are presented as mean ± SD and differences were identified using ANOVA with Bonferroni post-hoc test. Met; metformin.
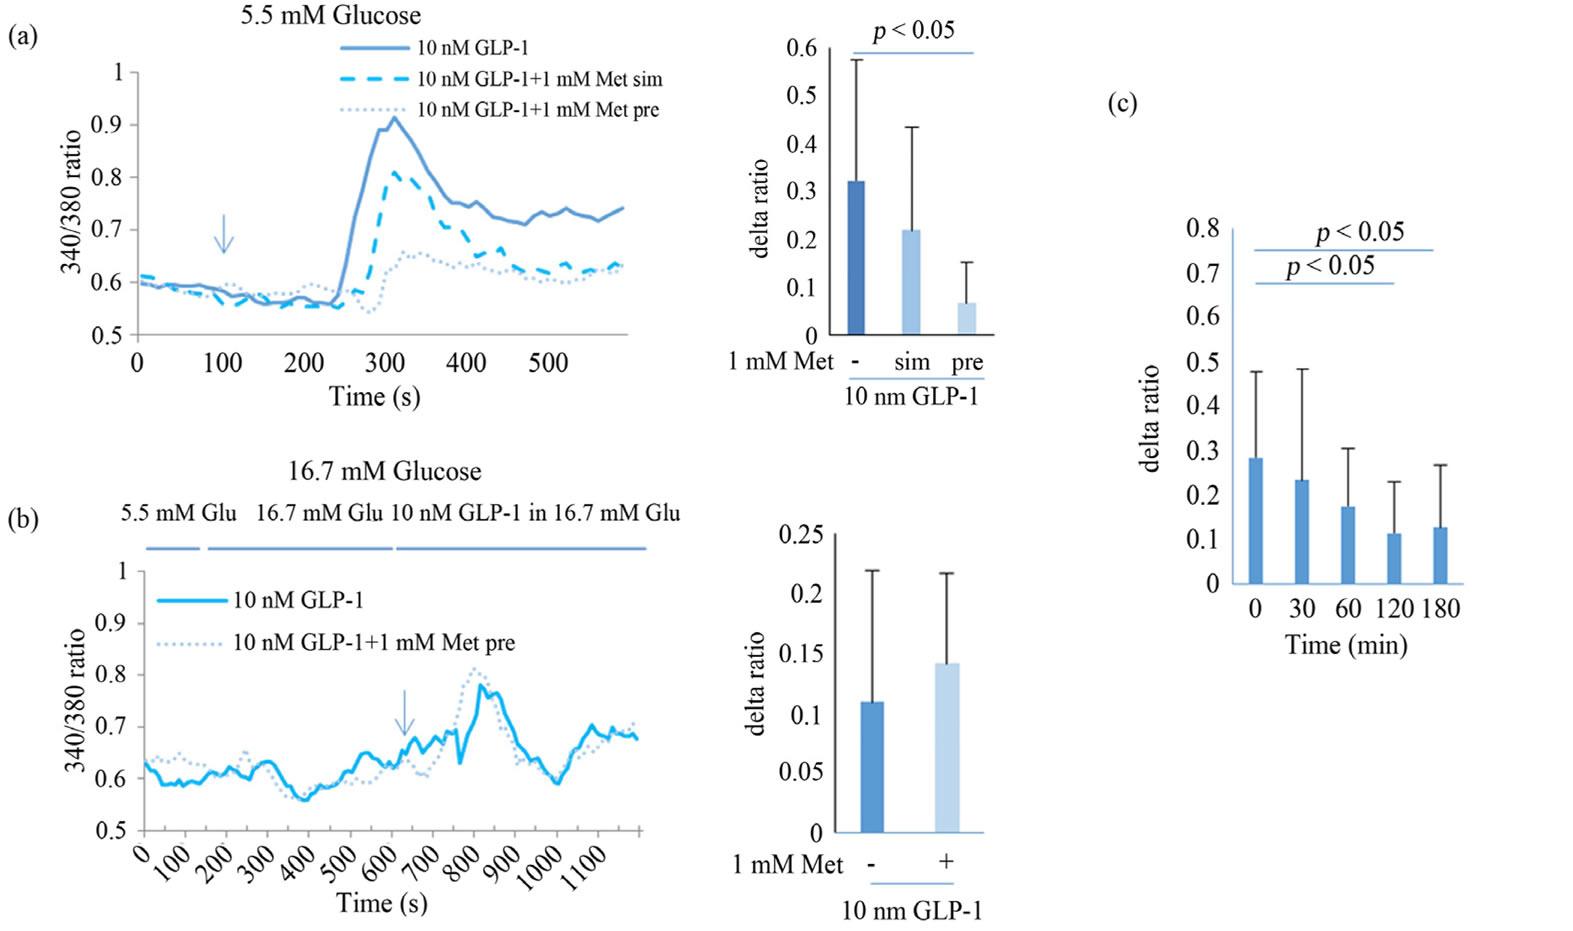
Figure 2. Effect of metformin on Ca2+ responses to 10 nM GLP-1 in MIN6 in the presence of 5.5 (a) or 16.7 mM glucose (b). MIN6 cells were perfused with HBSS containing 10 nM GLP-1, and cytosolic Ca2+ concentrations were measured using a 2- wavelength excitation method (340/380) for 10 min (solid line of left panel). MIN6 cells were pretreated with 1 mM metformin for 2 h (thin dotted line of left panel) or simultaneously with 10 nM GLP-1 (thick dotted line of left panel). Delta ratios of each peak are presented in bar graphs. The effects of pretreatment with metformin from 30 - 180 min were analyzed (c). Data are presented as mean ± SD of 2 - 3 independent experiments and differences between treatment groups were identified using ANOVA with Games-Howell test. Met, metformin; sim, simultaneously; pre, pretreatment; Glu, glucose.
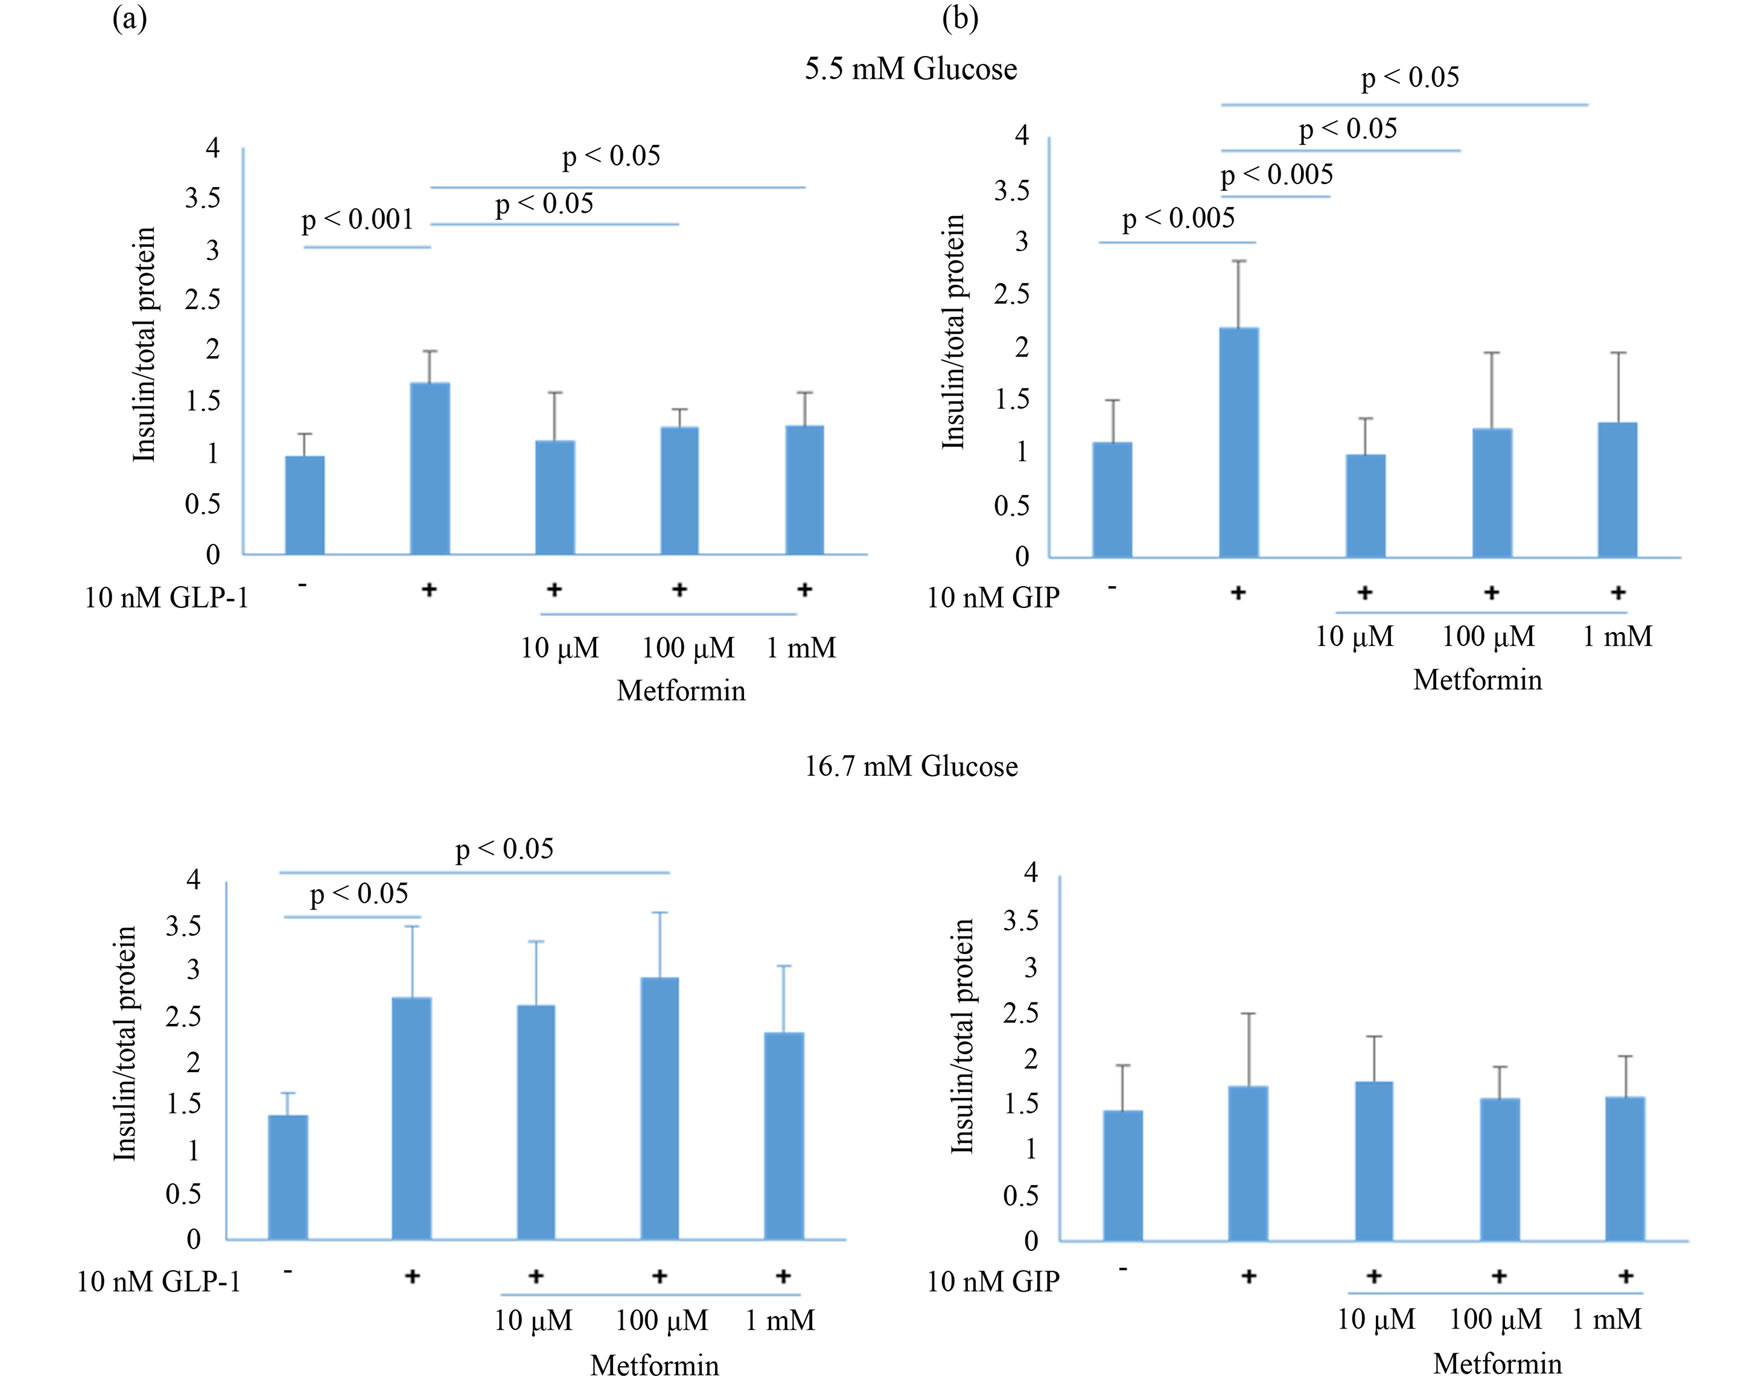
Figure 3. Effect of metformin on insulin production in MIN6 cells treated with GLP-1 (a) or GIP (b) in the presence of 5.5 or 16.7 mM glucose. After 2 h-pretreatment with metformin at 0, 10, 100, or 1000 μM, culture medium was changed to HBSS containing 8 mM glucose, and MIN6 cells were incubated for a further 40 min. Medium was then removed and MIN6 cells were stimulated with 10 nM GLP-1 or GIP in HBSS for 60 min. Data are presented as mean ± SD of 3 - 4 independent experiments. Differences between treatment groups were identified using ANOVA with Games-Howell (a) or Bonferroni (b) post-hoc tests.
the peak response was at 120 min. It suggested that vehicle lacking nutrition caused ATP production through activating LKB1-AMPK pathway and metformin could enhance the signaling.
3.5. Quantification of Adenylate Cyclase mRNA Expression
Adenylate cyclases synthesize cAMP from ATP; therefore, we analyzed mRNA expression of adenylate cyclases (1 to 9) in MIN6 cells. Real-time PCR data showed that Adcy 6 and 9 were expressed at much higher levels in MIN6 cells than the other isoforms (Figure 4(c)).
4. Discussion
Metformin is widely used as concurrent treatment for type 2 diabetes mellitus and causes few serious adverse reactions, even at high doses. Its pharmacological actions on glucose metabolism involve the LKB1-AMPK pathway, which appears to activate ataxia-telangiectasia mutants and activation-induced cytidine deaminase (ATM) [20]. Several other actions of metformin that are independent of glucose metabolism have been reported. Specifically, metformin attenuates neointimal hyperplasia by inhibiting smooth muscle cell proliferation and migration through the insulin-signaling pathway by inhibiting the expression of advanced glycation end product (AGEs) receptors, which are related to cancer mortality through AMPK [21,22]. A recent report demonstrates that administration of metformin increased mRNA expression of the receptors GLP-1R and GIPR in mice. Moreover, in vitro metformin treatments enhanced GLP-1R and PPAR-α expression in INS-1 rat β-cells [23]. In this study, GLP-1R expression increased with that of peroxisome proliferator-activated receptor-α (PPAR-α). However, our in vitro analysis in MIN6 cells showed that expression of PPAR-α, GLP-1R, and GIPR were reduced after 24-h treatments with 1-mM metformin in the presence of 5.5 mM glucose (data not shown). MIN6 and
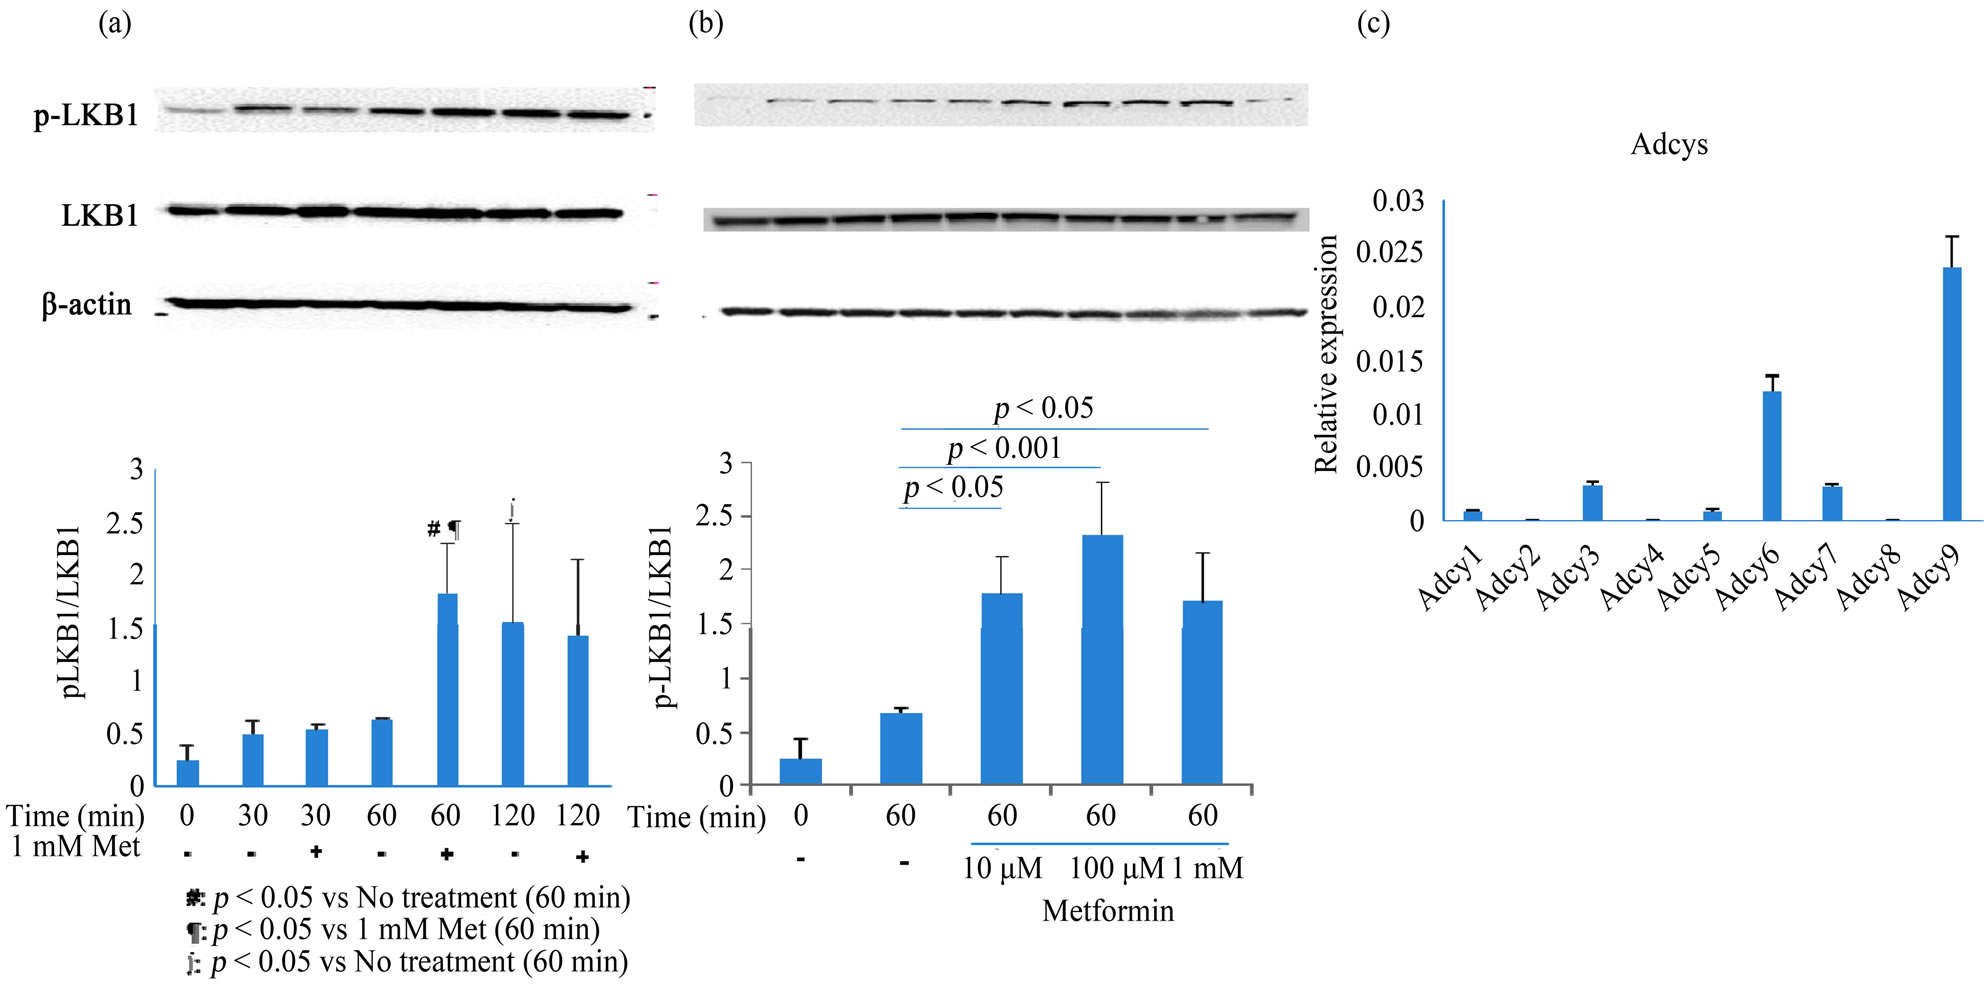
Figure 4. Analysis of LKB1 activation and Adcys mRNA expression in metformin-treated MIN6 cells. (a) MIN6 cells were treated with 1 mM metformin for 30, 60, or 120 min. After treatment with metformin, cell lysates (60 μg/lane) were electrophoresed and blotted, and protein bands were visualized using chemiluminescence. Typical blots from 2 - 3 independent experiments are presented, and bar graphs show the mean ± SD of 2 - 3 independent experiments; (b) Metformin dose-dependency was analyzed at 0, 10, 100, and 1000 μM; (c) Adcys 1 - 9 were quantified by real-time PCR using the TaqMan method. Data are presented as the mean ± SD of 2 experiments conducted in triplicate. Differences between treatment groups were identified using simple main effect test (a) and ANOVA with Bonferroni post-hoc test (b). Met, metformin; Adcy, adenylate cyclase.
INS-1 cells are commonly cultured in high glucose medium (25 and 11.1 mM, respectively). Differences between INS-1 and MIN6 cells may reflect their respective glucose requirements.
GLP-1 facilitates Ca2+-induced Ca2+ release (CICR), which is mediated by opening of IP3R and RYR cell membrane channels. Holz et al. clearly demonstrated that GLP-1-stimulated cAMP was required for activation of CICR by the cAMP binding proteins PKA and EPAC. Moreover, CICR requires continual activation of VDCCs by Ca2+ within intracellular microdomains, but not by robust Ca2+ influx from extracellular spaces [8,15,17,24]. Accordingly, the Ca2+ efflux response to GLP-1 was lower than that induced by glibenclamide, presumably because glibenclamide induces robust Ca2+ influx by opening VDCCs. In the present study, metformin pretreatment inhibited GLP-1-induced CICR and inhibited Ca2+ mobilization and consequent insulin secretion under normoglycemic conditions. However, under hyperglycemic conditions, metformin did not affect either Ca2+ or cAMP responses to incretin signals. In contrast, metformin enhanced cAMP production by GLP-1 and GIP under normoglycemic condition. Although cAMP is generally considered a positive signal for Ca2+ mobilization, the present data indicated that elevated [Ca2+]i is indispensable for insulin secretion. Since submicromolar Ca2+ inhibits the functions of Adcys such as Adcy 5, 6, and 9 [25], cAMP production by these Adcys is enhanced when intracellular Ca2+ is depleted. Real-time PCR data showed that the major isoforms expressed in MIN6 cells are Adcy 6 and 9, suggesting that low intracellular Ca2+ levels block inhibition of Adcys. Moreover, metformin enhanced cAMP production and inhibited incretin-induced CICR signaling. Kitaguchi et al. showed that extracellular Ca2+ influx-activated Adcy 1 played an important role in insulin secretion following stimulation with 25 mM glucose [26]. High concentrations of glucose activate the KATP-VDCC axis by increasing ATP production, and subsequent Ca2+ influx possibly activates Adcy 1. Figure 4(c) shows that Adcys 6 and 9 were the dominant isoforms in MIN6 cells and that Adcy 1 expression was very low. We speculated that incretin-induced cAMP production was dependent on Adcys 6 or 9 under normo-glycemic conditions.
Treatment with metformin activated LKB1 with a peak response at 60 min. Pretreatment with metformin for 2 h also inhibited the Ca2+ response to incretin, with weak inhibition at 60 min. Temporal differences between activation of LKB1 and inhibition of the incretin-induced Ca2+ response were observed after treatments with metformin, suggesting that activation of LKB1 precedes downstream signals. However, the regulatory mechanisms of Ca2+ mobilization by metformin remain obscure, and further investigations are required to confirm the causal relationship with LKB1. Nonetheless, the present data support mimicry of the physiological function of circulating adiponectin by metformin, which controls incretin-mediated hypoglycemic episodes.
5. Conclusion
Metformin has been proven efficacy in the treatment of type 2 diabetes mellitus. Our data indicate a novel function of metformin as a modulator of incretin-mediated insulin secretion. Using in vitro analyses, we initially demonstrated incretin-induced insulin secretion under normoglycemic conditions and showed that suppression of this cascade by metformin is blocked in hyperglycemic conditions. We assert that this effect of metformin should be taken into consideration during incretin treatments for the control of blood glucose concentrations.
6. Acknowledgements
Private University High Technology Research Center Project matching fund subsidy from MEXT of Japan, 2010-2012. The authors would like to thank Enago (www.enago.jp) for the English language review.
REFERENCES
- J. B. Clifford, M. R. C. Path and R. C. Turner, “Metformin,” New England Journal of Medicine, Vol. 334, No. 9, 1996, pp. 574-579. http://dx.doi.org/10.1056/NEJM199602293340906
- B. Viollet, B. Guigas, J. Leclerc, S. Hebrard, L. Lantier, R. Mounier, F. Andreelli and M. Foretz, “AMP-Activated Protein Kinase in the Regulation of Hepatic Energy Metabolism: From Physiology to Therapeutic Perspectives,” Acta Physiologica, Vol. 196, No. 1, 2009, pp. 81-98. http://dx.doi.org/10.1111/j.1748-1716.2009.01970.x
- D. G. Hardie, “Neither LKB1 nor AMPK Are the Direct Targets of Metformin,” Gastroenterology, Vol. 131, No. 3, 2006, p. 973. http://dx.doi.org/10.1053/j.gastro.2006.07.032
- X. G. Da Silva, I. Leclerc, A. Varadi, T. Tsuboi, K. Moule and G. A. Rutter, “Role of AMP-Activated Protein Kinase in Glucose-Stimulated Insulin Secretion and Preproinsulin Gene Expression,” Biochemical Journal, Vol. 371, No. 3, 2003, pp. 761-774. http://dx.doi.org/10.1042/BJ20021812
- L. L. Baggio and D. J. Drucker, “Biology of Incretins: GLP-1 and GIP,” Gastroenterology, Vol. 132, No. 6, 2007, pp. 2131-2157. http://dx.doi.org/10.1053/j.gastro.2007.03.054
- B. Thorens, “Expression Cloning of the Pancreatic Cell Receptor for the Gluco-Incretin Hormone Glucagon-Like Peptide 1,” Proceeding of National Academy of Sciences USA, Vol. 89, No. 18, 1992, pp. 8641-8645. http://dx.doi.org/10.1073/pnas.89.18.8641
- T. B. Usdin, E. Mezey, D. C. Button, M. J. Brownstein and T. I. Bonner, “Gastric Inhibitory Polypeptide Receptor, a Member of the Secretin-Vasoactive Intestinal Peptide Receptor Family, Is Widely Distributed in Peripheral Organs and the Brain,” Endocrinology, Vol. 133, No. 6, 1993, pp. 2861-2870. http://dx.doi.org/10.1210/en.133.6.2861
- G. G. Holz, C. A. Leech, R. S. Heller, M. Castonguay and J. F. Habener, “cAMP-Dependent Mobilization of Intracellular Ca2+ Stores by Activation of Ryanodine Receptors in Pancreatic Beta-Cells,” Journal of Biological Chemistry, Vol. 274, No. 20, 1999, pp. 14147-14156. http://dx.doi.org/10.1074/jbc.274.20.14147
- O. Dyachok and E. Gylfe, “Ca2+-Induced Ca2+ Release via Inositol 1,4,5-Trisphosphate Receptors Is Amplified by Protein Kinase A and Triggers Exocytosis in Pancreatic Beta-Cells,” Journal of Biological Chemistry, Vol. 279, No. 44, 2004, pp. 45455-45461. http://dx.doi.org/10.1074/jbc.M407673200
- R. A. Miller, Q. Chu, J. Xie, M. Foretz, B. Viollet and M. J. Birnbaum, “Biguanides Suppress Hepatic Glucagon Signalling by Decreasing Production of Cyclic AMP,” Nature, Vol. 494, No. 7436, 2013, pp. 256-260. http://dx.doi.org/10.1038/nature11808
- B. Hu, H. Nakata, C. Gu, T. DeBeer and D. M. Cooper, “A Critical Interplay between Ca2+ Inhibition and Activation by Mg2+ of AC5 Revealed by Mutants and Chimeric Constructs,” Journal of Biological Chemistry, Vol. 277, No. 36, 2002, pp. 33139-33147. http://dx.doi.org/10.1074/jbc.M112373200
- J. L. Guillou, H. Nakata and D. M. Cooper, “Inhibition by Calcium of Mammalian Adenylyl Cyclases,” Journal of Biological Chemistry, Vol. 274, No. 50, 1999, pp. 35539- 35545. http://dx.doi.org/10.1074/jbc.274.50.35539
- N. Masada, A. Ciruela, D. A. Macdougall and D. M. Cooper, “Distinct Mechanisms of Regulation by Ca2+/ Calmodulin of Type 1 and 8 Adenylyl Cyclases Support Their Different Physiological Roles,” Journal of Biological Chemistry, Vol. 284, No. 7, 2009, pp. 4451-4463. http://dx.doi.org/10.1074/jbc.M807359200
- C. Gu and D. M. Cooper, “Calmodulin-Binding Sites on Adenylyl Cyclase Type 8,” Journal of Biological Chemistry, Vol. 274, No. 12, 1999, pp. 8012-8021. http://dx.doi.org/10.1074/jbc.274.12.8012
- G. Kang, O. G. Chepurny, M. J. Rindler, L. Collis, Z. Chepurny, W.-H. Li, M. Harbeck, M. W. Roe and G. G. Holz, “A cAMP and Ca2+ Coincidence Detector in Support of Ca2+-Induced Ca2+ Release in Mouse Pancreatic b Cells,” Journal of Physiology, Vol. 566, No. 1, 2005, pp. 173-188. http://dx.doi.org/10.1113/jphysiol.2005.087510
- N. Ozaki, T. Shibasaki, Y. Kashima, T. Miki, K. Takahashi, H. Ueno, Y. Sunaga, H. Yano, Y. Matsuura, T. Iwanaga, Y. Takai and S. Seino, “cAMP-GEF2 Is a Direct Target of cAMP in Regulated Exocytosis,” Nature Cell Biology, Vol. 2, No. 11, 2000, pp. 805-811. http://dx.doi.org/10.1038/35041046
- G. Kang, O. G. Chepurny and G. G. Holtz, “cAMPRegulated Guanine Nucleotide Exchange Factor 2 (Epac2) Mediates Ca2+-Induced Ca2+ Release in INS-1 Pancreatic Cells,” Journal of Physiology, Vol. 536, No. 2, 2001, pp. 375-385. http://dx.doi.org/10.1111/j.1469-7793.2001.0375c.xd
- J. Miyazaki, K. Araki, E. Yamato, H. Ikegami, T. Asano, Y. Shibasaki, Y. Oka and K. Yamamura, “Establishment of a Pancreatic b Cell Line that Retains Glucose Inducible Insulin Secretion,” Endocrinology, Vol. 127, No. 1, 1990, pp. 126-132. http://dx.doi.org/10.1210/endo-127-1-126
- T. Hiroi, T. Wajima, T. Negoro, M. Ishii, Y. Nakano, Y. Kiuchi, Y. Mori and S. Shimizu, “Neutrophil TRPM2 Channels Are Implicated in the Exacerbation of Myocardial Ischemia/Reperfusion Injury,” Cardiovascular Research, Vol. 97, No. 2, 2013, pp. 271-281. http://dx.doi.org/10.1093/cvr/cvs332
- M. H. Sherman, A. I. Kuraishy, C. Deshpande, J. S. Hong, N. A. Cacalano, R. A. Gatti, J. P. Manis, M. A. Damore, M. Pelleqrini and M. A. Teitell, “AID-Induced Genotoxic Stress Promotes B Cell Differentiation in the Germinal Center via ATM and LKB1 Signaling,” Molecular Cell, Vol. 39, No. 6, 2010, pp. 873-885. http://dx.doi.org/10.1016/j.molcel.2010.08.019
- J. Lu, J. Ji, H. Meng, D. Wang, B. Jiang, L. Liu, E. Randell, K. Adeli and Q. H. Meng, “The Protective Effect and Underlyin Mechanism of Metformin on Neointima Formation in Fructose-Induced Insulin Resistant Rats,” Cardiovascular Diabetology, Vol. 12, 2013, p. 58. http://dx.doi.org/10.1186/1475-2840-12-58
- Y. Ishibashi, T. Matsui, M. Takeuchi and S. Yamagishi, “Metformin Inhibits Advanced Glycation End Products (AGEs)-Induced Growth and VEGF Expression in MCF- 7 Breast Cancer Cells by Suppressing AGEs Receptor Expression via AMP-Activated Protein Kinase,” Hormone and Metabolic Research, Vol. 45, No. 5, 2013, pp. 387-390.
- A. Maida, B. J. Lamont and C. D. Drucker, “Metformin Regulates the Incretin Receptor Axis via a Pathway Dependent on Peroxisome Proliferator-Activated Receptor in Mice,” Diabetologia, Vol. 54, No. 2, 2011, pp. 339- 349. http://dx.doi.org/10.1007/s00125-010-1937-z
- J. Selway, R. Rigatti, N. Storey, J. Lu, G. B. Willars and T. P. Herbert, “Evidence that Ca2+ within the Microdomain of the L-Typer Voltage Gated Ca2+ Channel Activates ERK in MIN6 Cells in Response to Glucagon-Like Peptide-1,” PLoS One, Vol. 7, No. 3, 2012, p. e33004. http://dx.doi.org/10.1371/journal.pone.0033004
- F. A. Antoni, A. A. Sosunov, A. Haunso, J. M. Paterson and J. Simpson, “Short-Term Plasticity of Cyclic Adenosine 3',5'-Monophosphate Signaling in Anterior Pituitary Corticotrope Cells: The Role of Adenylyl Cyclase Isotypes,” Molecular Endocrinology, Vol. 17, No. 4, 2003, pp. 692-703. http://dx.doi.org/10.1210/me.2002-0369
- T. Kitaguchi, O. Manami, Y. Wada, T. Tsuboi and A. Miyawaki, “Extracellular Calcium Influx Activates Adenylate Cyclase 1 and Insulin Secretion in MIN6 Cells,” Biochemical Journal, Vol. 450, No. 2, 2013, pp. 365-373. http://dx.doi.org/10.1042/BJ20121022
Abbreviations
GLP-1: glucagon-like peptide 1 GIP: glucose-dependent insulinotropic polypeptide
[Ca2+]i: intracellular Ca2+ concentrations Adcy: adenylate cyclase CICR: Ca2+-induced Ca2+ release T2D: type 2 diabetes mellitus
NOTES
*Corresponding author.