Open Journal of Endocrine and Metabolic Diseases
Vol.3 No.2(2013), Article ID:31627,4 pages DOI:10.4236/ojemd.2013.32015
Are Lipid Panels Altered by a Large Lunch Meal in Type 2 Diabetes?
1University of New Mexico School of Medicine, Albuquerque, USA
2University of Texas Health Sciences Center, Houston, USA
Email: evaldez@salud.unm.ed
Copyright © 2013 Elizabeth Duran-Valdez et al. This is an open access article distributed under the Creative Commons Attribution License, which permits unrestricted use, distribution, and reproduction in any medium, provided the original work is properly cited.
Received April 12, 2013; revised May 6, 2013; accepted May 20, 2013
Keywords: lipid profile; type 2 diabetes; fed vs. fasting state
ABSTRACT
Introduction: Recently, analyses of large heterogeneous databases have suggested that there are no differences whether “lipid panels” are drawn in the fed or fasted state, even in diabetic individuals. Whether this is true for individual diabetic patients is unknown. Methods: We studied eight type 2 diabetic individuals and measured serial lipid panels to determine the effect of a large lunch meal. A “Big Mac” equivalent meal was fed to each volunteer and blood for lipid assays was obtained at baseline and hourly for five hours following the meal. Results: The meal induced a significant elevation of glucose, insulin, and c-peptide in each volunteer. In addition, the following lipid parameters significantly changed from baseline concentration during the meal: total cholesterol, non-HDL cholesterol, LDL-cholesterol and triglycerides. Furthermore, the timing of the blood draw post meal also was a determinant of the lipid concentration. No significant concentration change occurred in HDL-cholesterol. Conclusions: In type 2 diabetic patients, lipid panels should be drawn in the fasting state unless the only lipid parameter of interest is HDL-cholesterol.
1. Introduction
Because cardiovascular disease is the primary cause of death in patients with diabetes, close monitoring (and often treatment) of lipids is paramount to minimizing risk. Current treatment guidelines with statins rely on measured levels of LDL cholesterol and treatment with fibrates depends upon monitoring levels of triglycerides. In addition, an assessment of “cardiovascular risk” depends on levels of HDL cholesterol and non HDL cholesterol [1]. Therefore, accurate lipid profile data are vital to providing “best practice” care for diabetic individuals. For this reason, the American Diabetes Association recommends that lipid profiles be obtained in the fasting state [2]. However, there are no individual studies in the literature to support this statement. In addition, a fasting state may be difficult for diabetic patients to maintain in rural areas because of long distances that must be traveled to obtain medical care and the ever present threat of hypoglycemia as a consequence of diabetes therapy.
Recently, statements have been made in the medical literature that lipid profiles are similar whether performed in the fed or fasted state. In the largest database examined which includes 112 prospective studies and 302,430 individuals, there is no difference in the lipid values between samples obtained in the fed or fasted state [3]. This is also true for a diabetes database when an overall risk assessment is examined [4]. These data obscure the risk assessment of individual diabetic patients following a meal. Therefore, we explore the effect of feeding a large, high carbohydrate, high fat lunch on standard lipid parameters in type 2 diabetic individuals.
2. Methods
Eight subjects with type 2 diabetes treated with diet plus a maximum of two oral diabetes medications were studied. Subjects were healthy without significant hyperlipidemia (i.e., serum LDL > 160 mg/dL or serum triglycerides > 300 mg/dL). Each person had a hemoglobin A1C < 9%, a c-peptide stimulation test of at least 6 ng/mL following a Sustecal challenge (Mead Johnson, Evansville, IN), and normal hematological and chemistry profile values. The study protocol was approved by the UNM Human Research Review Committee and all volunteers gave written informed consent prior to participation. The data were derived from an ongoing larger study of vitamin C in diabetes [5].
On the day of study, all antidiabetic medications were withheld. At 8:00 am in the morning, all participants were given a bagel with cream cheese (to prevent hypoglycemia before lunch). A continuous intravenous infusion of regular insulin was administered for several hours to achieve euglycemia. Approximately five hours later, when blood glucose was being maintained between 80 and 120 mg/dl, the insulin was stopped, and a new catheter placed in the contralateral arm. One hour later (i.e. after approximately six hours of fasting), the participant was fed a high caloric meal equivalent to McDonald’s® Big Mac meal and milk shake containing 1539 kcal [6]. Arterialized venous blood was drawn for analysis twice before the meal and hourly during the 5 hours post meal. A lunch test meal was chosen for two reasons. First, for the purpose of circumventing the insulin resistance variably induced by the Dawn phenomenon at breakfast [7] and second, because a diabetic patient coming from a significant distance for medical care would frequently ingest lunch before an afternoon blood draw.
All blood samples were processed immediately and frozen at −70 degrees centigrade until assay. Plasma glucose was determined with the ACE glucose assay from Alfa Wassermann Diagnostic Technologies, LLC (West Caldwell, NJ) [8]. Plasma insulin was measured with a chemiluminescent assay from Diagnostic Products (Los Angeles, CA) [9]. Plasma triglycerides and cholesterol were assayed colorimetrically with ACE reagents from Alfa Wassermann (West Caldwell, NJ) [10,11]. HDL cholesterol was measured utilizing a kit from Alfa Wassermann (West Caldwell, NJ). Non HDL cholesterol was calculated from total cholesterol minus HDL cholesterol. LDL-cholesterol was calculated utilizing the Friedewald equation (total cholesterol minus HDL-cholesterol minus triglycerides divided by five) [12]. Data were analyzed utilizing an analysis of variance for repeated measures [13]. Tukey-Kramer Multiple Comparison Test was utilized for post hoc testing as recommended [14].
3. Results
As shown in Table 1, plasma glucose rose to hyperglycemic levels following the ingestion of the meal. Endogenous insulin and c-peptide also became elevated but not sufficiently to prevent hyperglycemia. Plasma lipids demonstrated a variable response. No significant change was observed for HDL cholesterol. A significant increase was observed for triglycerides throughout the post meal period. In contrast, a significant decrease was observed for total cholesterol, non HDL cholesterol, and LDL cholesterol.
Individual lipid data for triglycerides and LDL-cholesterol are shown in figure 1. The Big Mac meal altered these lipid parameters in all eight diabetic volunteers to

Figure 1. The changes in triglycerides and LDL-cholesterol following a meal in type 2 diabetic individuals. Changes (compared to the baseline at 0 time) were observed in all volunteers, although the pattern of lipid changes was variable. The hypertriglyceride response for volunteer #2 (open squares) demonstrates the difficulty of calculating an accurate LDL cholesterol concentration using the Freidewald Equation (12).
varying degrees (indicating that this effect is very common in type 2 diabetes). Of interest is the hypertriglyceride response of volunteer #2 (open squares). Since the triglyceride concentration is used in the formula to calculate the LDL-cholesterol, unrealistic values of LDLcholesterol are obtained as shown in the bottom panel of figure 1. However, even if this individual’s data are removed from the calculation, a significant meal induced change was still observed for both triglyceride and LDLcholesterol as shown in Table 1 (seven subjects as indicated).
Of particular interest was the observation that the change in each volunteers’ concentration of triglycerides and LDL-cholesterol depended on the period of time post meal (Figure 1). For triglycerides, some individuals demonstrated a transient increase followed by a decrease whereas other individuals demonstrated a continuous increase in concentration. For LDL cholesterol, just the opposite response was observed. This observation would suggest that there is no set time period post meal that a predictable change in triglyceride or LDL-cholesterol could be predicted.
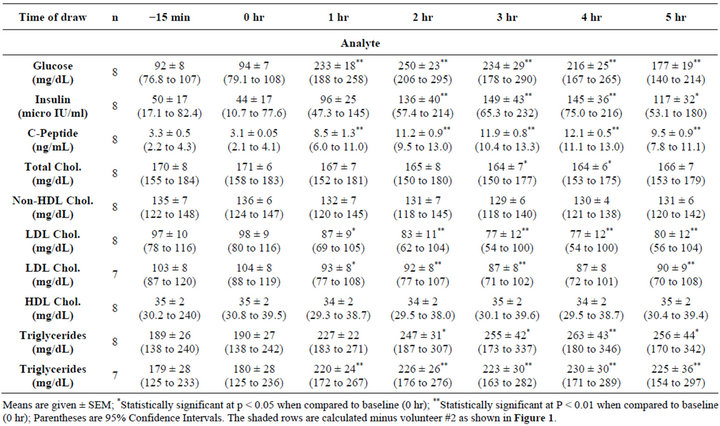
Table 1. Changes following a high fat/high carbohydrate meal.
4. Conclusions
Obtaining valid lipid values in patients with diabetes is critical to achieving lipid goals and adjusting antihyperlipidemic therapy.
To achieve this end, it is customary to order a lipid profile which usually includes total cholesterol, HDL cholesterol, triglycerides, and a calculated LDL-cholesterol. From these values non HDL cholesterol can be calculated plus various lipid ratios. Traditionally, these are done in the fasting state although recent published data suggest that this restriction may not be necessary [4]. Although a fasting sample is preferred, this can be problematic for many diabetic patients either because they need to treat hypoglycemia or they must travel significant distances to obtain medical care.
As reviewed by Mora, studies in non-diabetic individuals reveal minimally if there are any changes in lipid profiles except for triglycerides [15]. However, data obtained from non-diabetic individuals concerning the effects of “fed versus fasting” on the lipid profile cannot be applied to the diabetic individual. The reason for this limitation is that in contrast to non-diabetes, the diabetic individual often becomes hyperglycemic and hyperinsulinemic after a meal. Both of these bioactive molecules have major effects on lipid metabolism. In addition, our data indicate that there is no specific time after a meal in which lipid values are predictable for all individuals. Thus, our study strongly suggests that blood samples drawn in the non-fasting state are very difficult to interpret.
A potential limitation of our study is the fact that we have studied only eight individuals. However, as is shown in figure 1, all eight diabetic volunteers exhibited changes in their lipid panels post meal. Therefore, even if we had studied many more diabetic volunteers, many if not all of these individuals would also have meal induced changes in their lipid profile. Another limitation is that the magnitude of the lipid changes that we observed would likely be less if we had fed a smaller meal. However, there is no way that a physician can be certain of the number of calories his/her patient consumes or what the rate of gastric emptying is. Patients frequently underestimate the amount of food that they consume [16].
Non fasting lipid panels may be appropriate for assessment of risk in population studies in which food induced changes may be obscured by the heterogeneity inherent in these types of studies [3,4,14]. However, our results suggest that most lipid parameters are significantly altered by the fed state in individuals with diabetes. Furthermore, if LDL cholesterol or triglyceride levels are being monitored for assessment of statin or fibrate therapy, an accurate assessment of lipid concentration is essential. If, as is currently recommended, non HDL cholesterol is being measured to assess individual cardiovascular risk; a fasting sample should be obtained. The fact that significant lipid changes occurred in our limited population of eight diabetic volunteers indicates that food induces changes in lipids is very common in type 2 diabetes. Our data also suggest that undisclosed food intake may account for some of the variability in lipid panel measurements in individual patients between medical visits. Whether the same results would be observed in type 1 diabetes will require further study.
5. Acknowledgements
This research was supported by the University of New Mexico CTSC, #1UL1RR031977-01 and by the American Diabetes Association Grant # 7-04-CR-4.
REFERENCES
- B. Eliasson, J. Cederholm, K. Eeg-Olofsson, et al., “Clinical Usefulness of Different Lipid Measures for Prediction of Coronary Heart Disease in Type 2 Diabetes,” Diabetes Care, Vol. 35, No. 5, 2011, pp. 2095-2100. doi:10.2337/dc11-0209
- “American Diabetes Association 2012 Executive Summary: Standards of Medical Care in Diabetes,” Diabetes Care, Vol. 35, No. 1, 2012, pp. S4-S10.
- “Emerging Risk Factors Collaboration, Major Lipids, Apolipoproteins, and Risk of Vascular Disease,” Journal of the American Medical Association, Vol. 302, No. 18, 2009, pp. 1993-2000. doi:10.1001/jama.2009.1619
- S. Van Dieren, U. Nothlings, A. M. Van der Schouw, et al., “Non-Fasting Lipids and Risk of Cardiovascular Disease in Patients with Diabetes Mellitus,” Diabetologia, Vol. 54, No. 1, 2011, pp. 73-77. doi:10.1007/s00125-010-1945-z
- A. D. Gutierrez, E. Duran-Valdez, I. Robinson, D. Gonzalez de Serna and D. S. Schade, “Does Short-Term Vitamin C Reduce Cardiovascular Risk in Type 2 Diabetes?” Endocrine Practice, 2013, in press.
- S. Gregersen, D. Samocha-Bonet, L. K. Heilbronn and L. V. Campbell, “Inflammatory and Oxidative Stress Responses to High-Carbohydrate and High-Fat Meals in Healthy Humans,” Journal of Nutrition and Metabolism, Vol. 2012, 2012, Article ID: 238056. doi:10.1155/2012/238056
- M. F. Carroll and D. S. Schade, “The Dawn Phenomenon Revisited: Implications for Diabetes Therapy,” Endocrine Practice, Vol. 11, No. 1, 2005, pp. 55-64. doi:10.4158/EP.11.1.55
- R. J. Bondar and D. C. Mead, “Evaluation of Glucose-6- Phosphate Dehydrogenase from Leuconostoc Mesenteroides in the Hexokinase Method for Determining Glucose in Serum,” Clinical Chemistry, Vol. 20, No. 5, 1974, pp. 586-590.
- L. Andersen, B. Dinesen, P. N. Jorgensen, et al., “Enzyme Immunoassay for Intact Human Insulin in Serum or Plasma,” Clinical Chemistry, Vol. 39, No. 4, 1993, pp. 578-582.
- P. Fossati and L. Prencipe, “Serum Triglycerides Determined Colorimetrically with an Enzyme That Produces Hydrogen Peroxide,” Clinical Chemistry, Vol. 28, No. 10, 1982, pp. 2077-2080.
- C. C. Allain, L. S. Poon, C. S. Chan, et al., “Enzymatic Determination of Total Serum Cholesterol,” Clinical Chemistry, Vol. 20, No. 4, 1974, pp. 470-475.
- W. T. Friedewald, R. I. Levy and D. S. Fredrickson, “Estimation of the Concentration of Low-Density Lipoprotein Cholesterol in Plasma, without Use of the Preparative Ultracentrifuge,” Clinical Chemistry, Vol. 18, 1972, pp. 499-502.
- J. Hintze, “NCSS and PASS Number Cruncher Statistical System,” Jatsvukke Utah, 2001.
- M. R. Stoline, “The Status of Multiple Comparisons: Simultaneous Estimation of All Pairwise Comparisons in One-Way ANOVA Designs,” The American Statistician, Vol. 35, No. 3, 1981, pp. 134-141.
- S. Mora, N. Rifai, J. E. Buring, et al., “Fasting Compared with Nonfasting Lipids and Apolipoproteins for Predicting Incident Cardiovascular Events,” Circulation, Vol. 118, No. 10, 2008, pp. 993-1001. doi:10.1161/CIRCULATIONAHA.108.777334
- J. H. M. deVries, P. L. Zock, R. P. Mensink, et al., “Underestimation of Energy Intake by 3-d Records Compared with Energy Intake to Maintain Body Weight in 269 Nonobese Adults,” American Journal of Clinical Nutrition, Vol. 60, No. 6, 1994, pp. 855-860.