Modern Mechanical Engineering
Vol.3 No.3(2013), Article ID:35734,6 pages DOI:10.4236/mme.2013.33016
Measurement of Effective Reading Distance of UHF RFID Passive Tags
Department of Mechanical and Electrical Engineering, National Taipei University of Technology, Chinese Taipei
Email: yuan@ntut.edu.tw, flag.liu@gmail.com
Copyright © 2013 Yuan-Ping Luh, Yin-Chang Liu. This is an open access article distributed under the Creative Commons Attribution License, which permits unrestricted use, distribution, and reproduction in any medium, provided the original work is properly cited.
Received April 21, 2013; revised June 19, 2013; accepted June 28, 2013
Keywords: RFID; Turn-On Power; Passive Tag; Performance
ABSTRACT
Currently, for manufacturing UHF RFID passive tags, the online inspection mechanism is very simple. This mechanism tries to read tag IDs in the near field, and hence validates tag’s usability. For UHF RFID applications, tag usability is a very rough indicator and cannot characterize the performance of a tag accurately. In practice, effective reading distance is the key performance index of a tag. This study proposes chip’s turn-on power approach to characterize the effective reading distance of UHF RFID passive tags. The experimental results presented in this paper demonstrated the feasibility of this approach. Moreover, in comparison with the large-scale setup, this mini-scale setup produces a smaller error in the estimation of the effective reading distance. Using a mini anechoic chamber, the mini-scale setup can be adopted in practice for online tag performance inspection to grade tag’s compliance with effective reading distance.
1. Introduction
Most tag machinery manufacturers, such as Muehlbauer and Bielomatik [1], provide fundamental online mechanism that tries to read tag IDs in the near field, and hence validates tag’s usability. For UHF RFID applications, tag usability is a very rough indicator and cannot characterize the performance of a tag accurately. In practice, effective reading distance is the key performance index of a tag because most online proofed tags are inadequate for implementation due to the insufficient reading distance.
For tag manufactures, to characterize the effective reading distance of an UHF RFID passive tag, the simplest approach is to gradually position the sampled RFID tag away from interrogator’s antenna in a large space until 50% or less of signal is received. However, such approach implies low productivity because it is a time consuming process. Moreover, in an opening area, environmental electromagnetic interference may significantly influence the measurement accuracy on effective reading distance [2-4].
To eliminate the environmental electromagnetic interference, the present state-of-the-art approach is to measure the effective reading distance inside a large anechoic chamber [5-7]. However, the use of large anechoic chamber implies high capital investments. In addition, such approach is still a time consuming process.
Since current approaches to characterize the effective reading distance of UHF RFID passive tags are costly and time consuming, an economic approach to accelerate the characterization process is needed. To propose such an innovative approach, this study reviews the traditional approach and the fundamental background of electromagnetic wave propagation in advance. Afterward, the theoretical equations for this innovative approach are derived. Finally, an experimental study is conducted to demonstrate the feasibility of this innovative approach.
2. Theoretical Background of Current Approach
The template is used to format your paper and style the text. All margins, column widths, line spaces, and text fonts are prescribed; please do not alter them. You may note peculiarities. For example, the head margin in this template measures proportionately more than is customary. This measurement and others are deliberate, using specifications that anticipate your paper as one part of the entire journals, and not as an independent document. Please do not revise any of the current designations. To characterize the effective reading distance of an UHF RFID passive tag, the current approach is shown in Figure 1. In this approach, the power of interrogator output (PT) is the same as the setup during operations, and the initial distance between RFID tag and interrogator’s antenna is 0.9 meter. After setup, the interrogator transmits electromagnetic (radio frequency) signal to energize the tag every 500 msec for 30 times in a reading cycle, and therefore receives the ID number returned by the tag. In a reading cycle, if more than 50% of returned signal is received by the interrogator’s antenna, the distance between RFID tag and interrogator’s antenna will be increased by 0.1 meter for next cycle, until 50% or less of signal is received. The final distance between RFID tag and interrogator’s antenna is the effective reading distance of a tag. Note that the approach in Figure 1 is a time consuming process.
In an opening area, the multi-path propagation effects may be caused by electromagnetic interference reflection. Therefore, the effective reading distance may not be corrected measured [8]. To eliminate the environmental electromagnetic interference and measure the effective reading distance correctly, the RFID tag and interrogator’s antenna are better installed inside a large anechoic chamber. The environment inside an anechoic chamber is so-called an ideal free space. Note that the use of large anechoic chamber implies high capital investments. The strength of electromagnetic (RF) signal will be attenuated with the distance through wave propagation [9]. After long distance propagation, the power of electromagnetic (RF) signal may be too weak to energize RFID tags. This causes the failure of reading tag’s ID numbers. Theoretically, the amount of power attenuation can be calculated. In an ideal free space, the relation between power attenuation (in dB, PLoss) of electromagnetic (RF) signal with propagation distance (in meter, d) is as follows:
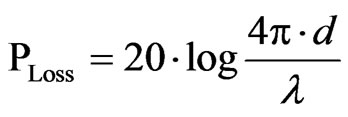 (1)
(1)
where λ = the wavelength of electromagnetic (RF) wave (in meter) [10].
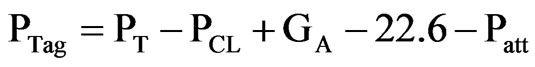
The transmission path of electromagnetic (RF) signal from an interrogator to a tag is shown in Figure 2. The power of electromagnetic (RF) signal received by the tag (PTag) can be estimated from the power of interrogator output (PT) as follows:
 (2)
(2)
where PCL = the cable loss GA = the interrogator’s antenna gain PLoss = the path loss as calculated by Equation (1).
Additionally, the electromagnetic (RF) signal strength returned from the tag to the interrogator’s antenna, as characterized by the Received Signal Strength Indicator (RSSI), can be estimated theoretically as follows:
 (3)
(3)
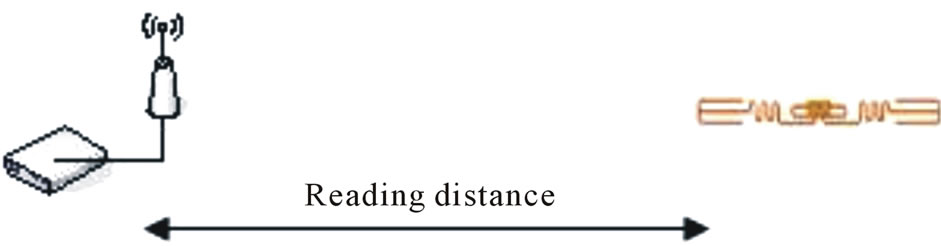
Figure 1. The setup of the traditional inspection.
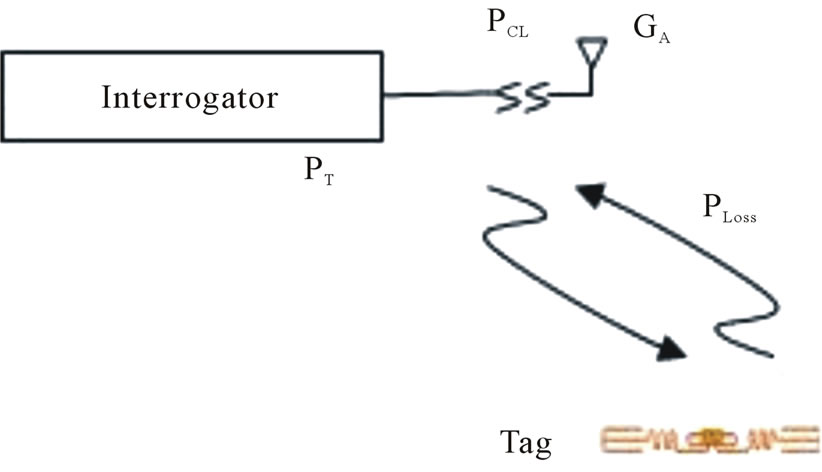
Figure 2. RF propagation path of the RFID UHF Tag. Note. That under the circumstance of reading rate nearly 50% and more, the power of electromagnetic (RF) signal received by a tag is defined as the minimum turn-on power of a tag (PTurn-on).
Equation (3) shows the value of RSSITag is reduced through wave transmission. Therefore, the RSSI is often used to estimate the distance between a tag and a interrogator’s antenna practically [11,12]. As illustrated in this section, the traditional approach to characterize the effective reading distance of tags is a time consuming process. In addition, the use of large anechoic chamber for characterization implies high capital investments. These two shortcomings result in the traditional approach not suitable for routine inspection. For developing online inspection equipment, space reduction and process simplification are the key issues.
3. Theoretical Background of This Approach
To propose this approach to characterize effective reading distance of a tag, the required space for measurement should be minimized, and the characterization process should be simplified. For space reduction, the static test method prepared by EPCglobal [13] gives enlightenment. Theoretical study in previous section shows that when the distance between RFID tag and interrogator’s antenna equals “effective reading distance”, the power of electromagnetic (RF) signal received by a tag is approximately PTurn-On. To determine the value of PTurn-On, EPCglobal publishes the static test method as the industrial standards. In accordance with the EPCglobal static test standard, a tag is placed on the platform and facing to the interrogator antenna, as shown in Figure 3. Specially, rather than gradually positioning the RFID tag away from interrogator’s antenna, a power attenuator is used to simulate the power loss caused by transmission distance.

Figure 3. The setup of EPCglobal static test method.
Hence, the distance between tag and interrogator’s antenna is fixed to 0.9 meter during experiment. Even though 0.9 meter is still not small enough for building on-line inspection equipment; however, the use of power attenuator seems to be a feasible way for space reduction.
Physically, a tag can be placed on any location as close to interrogator’s antenna as possible. However, if the distance between tag and interrogator’s antenna is too short, the phenomenon of near field electromagnetic interference will be occurred. On the basis of distance to radiation source, the electromagnetic field is classified into three regions: reactive near field, radiating near field and far-field [14]. Theoretically, the radiation wavelength (λ) and the antenna width (D) determine the range of near field. For the distance to radiation source less than λ/2π or 2D2/λ, the near field reactive or radiating effects will occur. Practically, to avoid the near field interference, the distance to radiation source longer than one wavelength is suggested. The relation between wavelength (λ) and frequency (f) is as follows:
 (4)
(4)
where c = the speed of light (3 × 10⁸ m/sec).
In most cases, the frequency of 915 MHz is adopted by the UHF RFID passive applications. The wavelength for 915 MHz RF signal is 0.32 meter. Therefore, to avoid the near field interference, the distance between UHF RFID tag and interrogator’s antenna should be more than 0.32 meter. In this study, 0.35 meter is selected for further study. Such size is smaller enough for building on-line inspection equipment. To characterize the effective reading distance of tags in such mini space, a power attenuator is used to simulate the power loss caused by long transmission distance. The power gap (Pgap) induced by transmission distance and power attenuator can be expressed as follows:
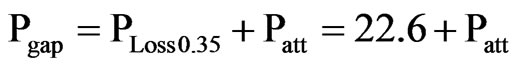 (5)
(5)
where PLoss0.35 = the path loss for d = 0.35 meter = 22.6 dB by Equation (1).
Patt = the magnitude of power attenuation.
With power attenuator, by modifying Equations (2) and (3), the PTag and RSSI can be estimated theoretically as follows:
 (6)
(6)
 (7)
(7)
Note. That under the circumstance of reading rate nearly 50% and more, the power of electromagnetic (RF) signal received by a tag is defined as the minimum turn-on power of a tag (PTurn-On). Based on Equation (6), the circumstance of PTurn-On is achieved by adjusting Patt, and the corresponding Pgap can be calculated from Equation (5). By substituting Pgap to PLoss in Equation (1), the equivalent distance (d) for Pgap is obtained. Such equivalent distance is the tag’s effective reading distance as characterized in 0.35 meter (RD0.35 m).
Even though the size for characterization is reduced with the assistance of using attenuator, it is still a time consuming process to adjust power attenuation, Patt, to achieve the circumstance of reading rate nearly 50% and more. Therefore, for on-line inspection, the value of Patt has to be unchanged. Such setup is feasible for online characterization because customers only care about the effective reading distance guaranteed by manufacturers instead of the maximum reading distance exactly. For the declared effective reading distance by a manufacturer, the value of Patt is assigned in prior to tag production. Theoretically, an interrogator can send electromagnetic (RF) signal 1000 times per second, and can energize a tag within 0.1 second. Therefore, the inspection time for a tag can be reduced to less than 1 second practically.
In this section, the minimum required space for measuring effective reading distance is determined, and the simplified characterization process is also specified. Such approach is proposed for developing on-line inspection equipment. However, the correctness of using power attenuator in such limited space to measure effective reading distance is not confirmed yet. Hence, further experimental study is designed for verification.
4. Design of Experimental Study
To verify the feasibility of proposed innovative approach, an experimental study has been designed. In the experimental study, the effective reading distance of a tag will be characterized by two setups. One uses the large-scale setup, as shown in Figure 1. The other uses the miniscale setup with a power attenuator, as shown in Figure 3. All experimental works are performed in an anechoic
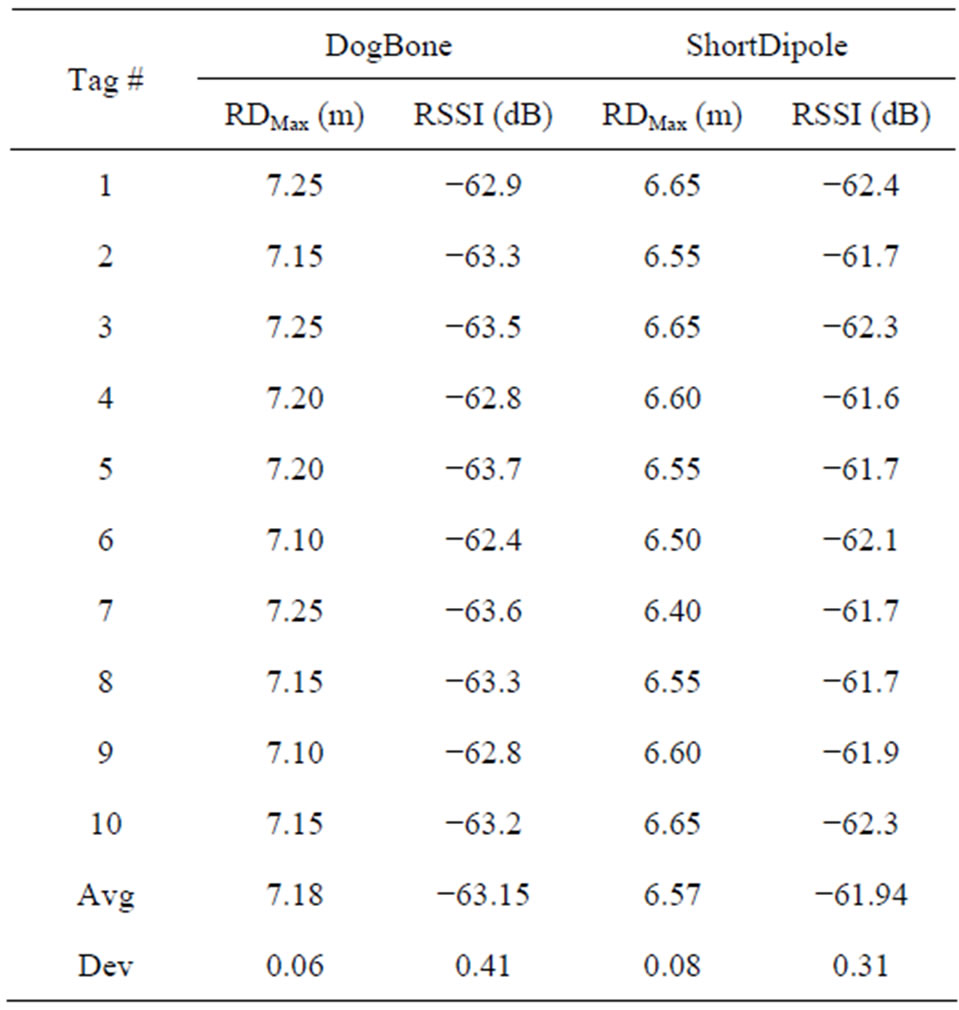
Table 1. Traditional test in large-scale.
chamber to eliminate the environmental electromagnetic interference. If the effective reading distances of a tag as determined by different setups are close enough, the feasibility of proposed innovative approach can be approved.
In the experimental study, two different types of UHF RFID passive tags are chosen for testing. One is the UPM DogBone and the other is the UPM ShortDipole. Both types use the Impinj Monza 3 chip. The minimum sensitivity of the Impinj Monza 3 chip is −15 dB [15]. The maximum reading distance declared by UPM is 9.2 meters for DogBone, and is 8.8 meters for ShortDipole [16,17]. The quantity of each tag type for experiment is 10. The adopted RFID UHF interrogator for experiment is Alien9780 [18]. The power of interrogator output (PT) is set to 30 dB throughout the experiment. The interrogator antenna used in experiment is Alien ALR9610-BC [19]. The antenna gain (GA) of Alien ALR9610-BC is 5.73 dB. The cable length to connect interrogator and antenna for experiment is 3 meter, and the power loss induced by cable transmission (PCL) is 2.55 dB approximately.
By the large-scale setup, the effective reading distance of a tag and the associated RSSI are measured directly. The initial distance between RFID tag and interrogators antenna is 2 meters. After setup, the interrogator transmits electromagnetic (radio frequency) signal to energize the tag every 500 msec for 30 times in a reading cycle, and therefore receives the ID number returned by the tag. In a reading cycle, if more than 50% of returned signal is received by the interrogator’s antenna, the distance will be increased by 0.5 meter for next cycle, until 50% or less of signal is received. After attaining such critical condition, the effective reading distance can be further determined by reducing the distance by 0.05 meter per cycle, until almost exact 50% of signal is received. By the mini-scale setup, the distance between RFID tag and interrogator’s antenna is fixed to 0.35 meter. In addition, the power attenuation of attenuator (Patt) is set to 25 dB initially. The adopted attenuator for experiment is KAY 1/839 [20]. After initial setup, the interrogator transmits electromagnetic (radio frequency) signal to energize the tag every 500 msec for 30 times in a reading cycle, and therefore receives the ID number returned by the tag. In a reading cycle, if more than 50% of returned signal is received by the interrogator’s antenna, the power attenuation of attenuator (Patt) will be increased by 1 dB for next cycle, until 50% or less of signal is received. After attaining such critical condition, the final value of Patt can be further determined by reducing the power attenuation by 0.1 dB per cycle, until almost exact 50% of signal is received. With Patt, the Pgap and PTurn-On are determined by Equations (5) and (6). Moreover, the effective reading distance of a tag and the associated RSSI are derived by Equation (1) with Pgap and Equation (7), respectively.
5. Experimental Results and Analysis
The traditional test results are shown in Table 1. The experimental results for two different types of UHF RFID passive tags are shown in Tables 2 and 3. As shown in Table 1, the effective reading distance of a tag (RDMax) and the associated RSSI are measured directly by the large-scale setup. Differently, by the mini-scale setup, the effective reading distance of a tag (RD0.35 m) and the associated RSSI (RSSI0.35 m) are derived from the measured power attenuation of attenuator (Patt) by Equations (1), (5) and (7).
In Tables 2 and 3, the mean value of RD0.35 m is 7.13 meters for the tags of UPM DogBone type, and is 6.50 meters for the tags of UPM ShortDipole. Furthermore, the mean value of RSSI0.35 m is −64.36 dB for the tags of UPM DogBone type, and is −62.74 dB for the tags of UPM ShortDipole. In comparison with the large-scale setup, the results by the mini-scale setup only have less than 0.7% error on RDMax and less than 1.9% error on RSSI for DogBone type. And in comparison with the large-scale setup, the results by the mini-scale setup only have less than 1.1% error on RDMax and less than 1.3% error on RSSI for ShortDipole type. The experimental result shows the correctness of proposed innovative mini-scale setup can be approved. It is noteworthy that the RD0.35 m and RSSI0.35 m has less deviation than RDMax and RSSI, as shown in Tables 2 and 3. Such consequence implies that the measurement consistency is better by the mini-scale setup than by the large-scale setup.
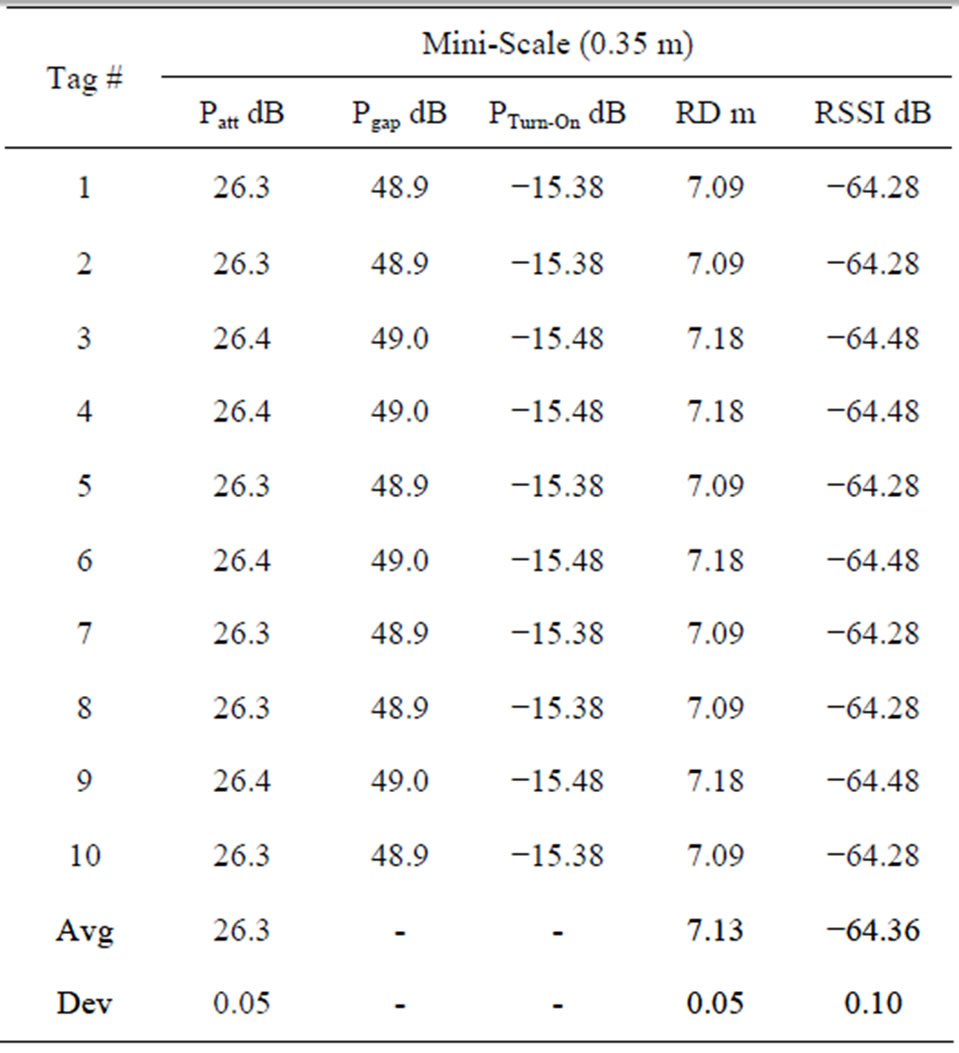
Table 2. Experimental results for DogBone tags.
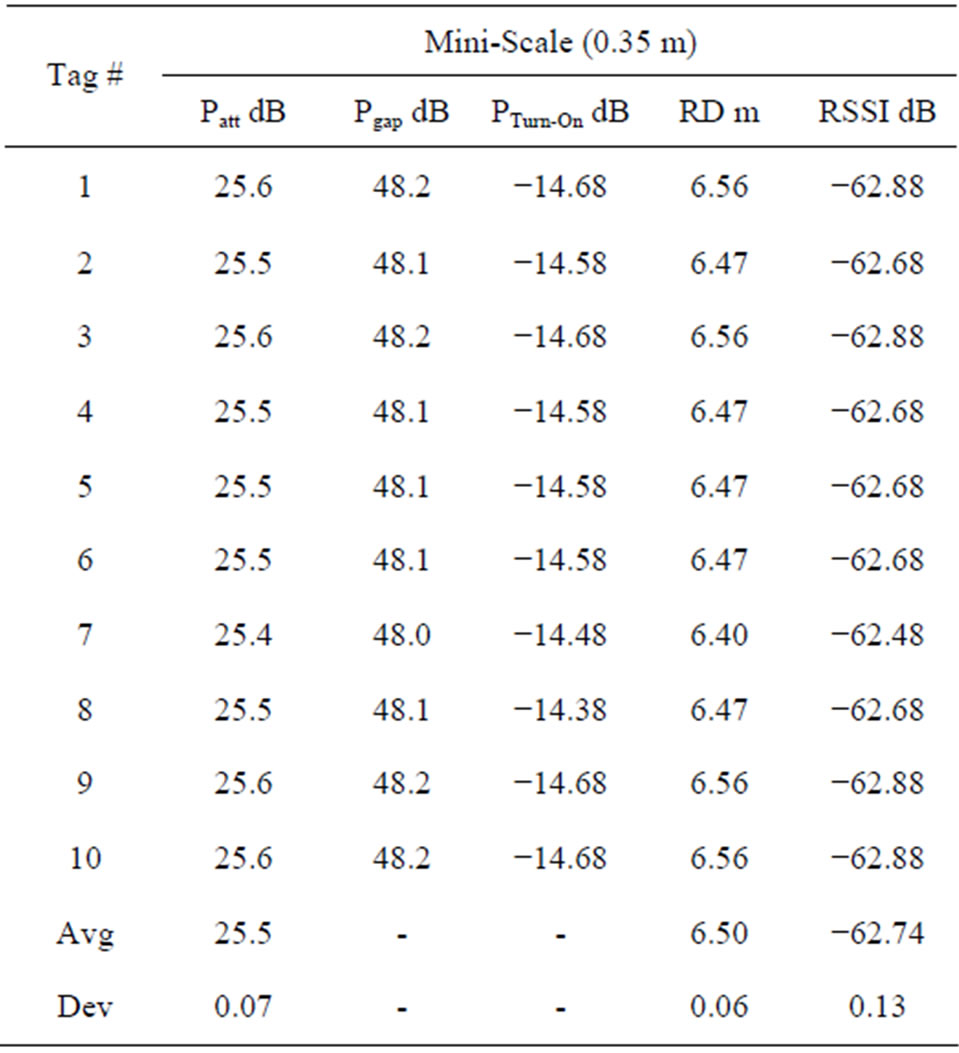
Table 3. Experimental results for ShortDipole tags.
By the mini-scale setup, the minimum turn-on power of a tag (PTurn-On) is derived from the measured power attenuation of attenuator (Patt) by Equation (6). Theoretically, the power magnitude to energize a tag is limited by the sensitivity of the chip used inside a tag. Due to some tag package limitations, such as material impedance and characteristic differently, the power magnitude to energize a tag will be higher than the chip’s sensitivity in general. Hence, for UPM ShortDipole cases in Table 3, it seems reasonable that the calculated PTurn-On are slightly higher than the chip’s sensitivity (−15 dB). In Table 2, the calculated PTurn-On are slightly lower than the chip’s sensitivity (−15 dB). Nevertheless, such experimental result is still reasonable since tag’s antenna gain effect and bonding loss are not considered for calculating the PTurn-On in this study. Tag’s antenna gain can enlarge the transmitted power form interrogator to energize a tag. In general, the designed antenna gain of tag is from 0.8 dB to 1.2 dB.
6. Conclusions
To measure the effective reading distance of an UHF RFID passive tag, the present state-of-the-art approach is to gradually position the RFID tag away from interrogator’s antenna in a large anechoic chamber until 50% or less of signal is received. However, such approach is costly and time consuming. This study proposes a new approach to accelerate the characterization process. In this approach, rather than gradually positioning the RFID tag away from interrogator’s antenna, a power attenuator is used to simulate the power loss caused by transmission distance. With power attenuator, this study claims that the distance between tag and interrogator’s antenna can be reduced to 0.35 meter. Also, by experimental study, the equilibrium between mini-scale setup and large-scale setup is verified. Therefore, the feasibility of proposed new approach is confirmed. Using a mini anechoic chamber associated with the simplified characterization process, this mini-scale setup can be adopted in practice for online tag performance inspection to grade tag’s compliance with effective reading distance. The miniscale layout setup is shown in Figure 4.
The IOT network in the future, there will be many passive sensors need to build. These sensors in the manufacturing and assembly process will face the read performance QC issues. Great potential in this study can be
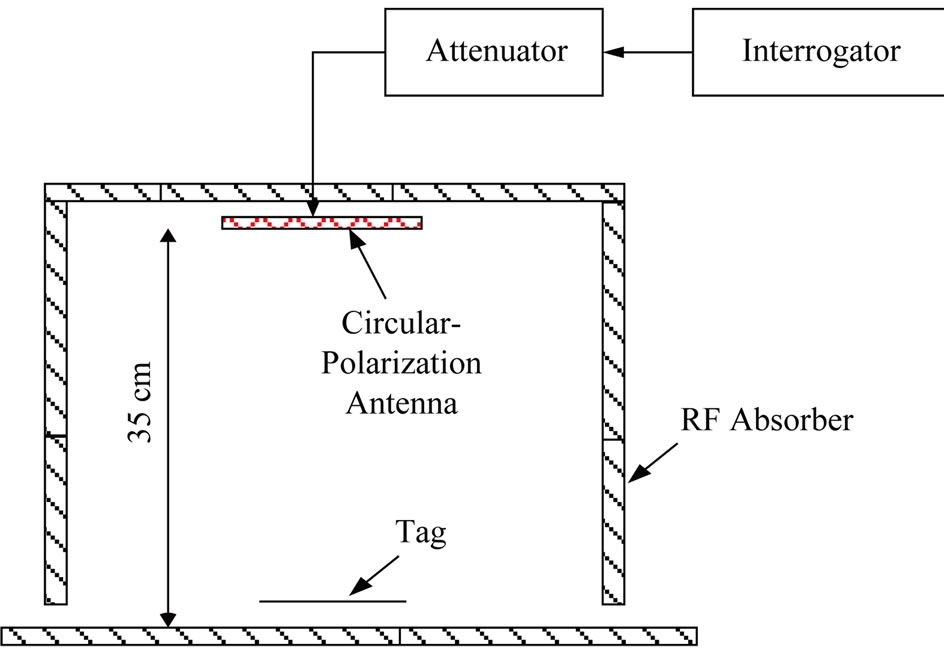
Figure 4. The setup of the inspection.
used to assist the industry to solve such problems.
REFERENCES
- ABI research, “The RFID Passive Label Market,” 2007, pp. 1-8.
- X. M. Qing, C. K. Goh and Z. N. Chen, “Impedance Characterization of RFID Tag Antennas and Application in Tag Co-Design,” IEEE Transactions on Microwave Theory and Techniques, Vol. 57, No. 5, 2009, pp. 1268- 1274. doi:10.1109/TMTT.2009.2017288
- F. Fuschini, C. Piersanti, L. Sydanheheimo, L. Ukkonen and G. Falciasecca, “Electromagnetic Analyses of Near Field UHF RFID Systems,” IEEE Transactions on Antenna and Propagation, Vol. 58, No. 5, 2010, pp. 1759- 1770. doi:10.1109/TMTT.2009.2017288
- K. Weigelt, M. Hambsch, G. Karacs, T. Zillger and A. C. Hubler, “Labeling the World: Tagging Mass Products with Printing Processes,” IEEE Pervasive Computing, Vol. 9, No. 2, 2010, pp. 59-63. doi:10.1109/MPRV.2010.37
- L. Cabria, J. A. Garcia, E. Malaver and A. Tazon, “A PHEMT Frequency Doubling Active Antenna With BPSK Modulation Capability,” IEEE Antennas and Wireless Propagation Letters, Vol. 3, 2004, pp. 310-313. doi:10.1109/LAWP.2004.838821
- A. Cataldo, G. Monti, E. D. Benedetto, G. Cannazza, L. Tarricone and L. Catarinucci, “Assessment of a TDBased Method for Characterization of Antennas,” IEEE Transactions on Instrumentation and Measurement, Vol. 58, No. 5, 2009, pp. 1412-1419. doi:10.1109/TIM.2008.2009199
- G. Cerri, V. M. Primiani, C. Monteverde and P. Russo, “A Theoretical Feasibility Study of a Source Stirring Reverberation Chamber,” IEEE Transaction on Electromagnetic Compatibility, Vol. 51, No. 1, 2009, pp. 3-11. doi:10.1109/TEMC.2008.2009530
- X. H. Cao and H. B. Xiao, “Propagation Prediction Model and Performance Analysis of RFID System under Metallic Container Production Circumstance,” Microelectronics Journal, Vol. 42, No. 2, 2011, pp. 247-252. doi:10.1016/j.mejo.2010.12.004
- C. Floerkemeier and S. Sarma, “RFIDSim—A Physical and Logical Layer Simulation Engine for Passive RFID,” IEEE Transactions on Automation Science and Engineering, Vol. 6, No. 1, 2009, pp. 33-43. doi:10.1109/TASE.2008.2007929
- T. Rappaport, “Wireless Communications,” Prentice Hall, Upper Saddle River, 1996.
- C. C. Chen, D. C. Mao and C. Lee, “ART: A Novel Localization Method for Managing Uncertainty Region in Wireless Fading-Signal Sensor Networks,” Ubiquitous Computing and Communication Journal, Vol. 2, No. 3, 2007, pp. 30-41.
- H. S. Ahn and W. Yu, “Environmental-Adaptive RSSIBased Indoor Localization,” IEEE Transactions on Automation Science and Engineering, Vol. 6, No. 4, 2009, pp. 626-633. doi:10.1109/TASE.2008.2009126
- EPCglobal Inc., “Static Test Method for Applied Tag Performance Testing Rev 1.9.4,” 2008.
- H. Fan, “Using Radiating near Field Region to Sample Radiation of Microstrip Traces for Far Field Prediction by Genetic Algorithms,” IEEE Microwave and Wireless Components Letters, Vol. 19, No. 5, 2009, pp. 272-274. doi:10.1109/LMWC.2009.2017586
- Impinj Inc., “UHF Gen 2 RFID Tag Chip Monza™ 3 Product Brief,” 2008.
- UPM Raflatac Inc., “DogBone EPC Class 1 Gen 2 Data Sheet: 3001571,” 2010.
- UPM Raflatac Inc., “ShortDipole EPC Class 1 Gen 2 Data Sheet: 3001488,” 2010.
- Alien Technology Corp., “ALR-9780 Hardware Setup Guide, Rev. D,” 2005.
- Alien Technology Corp., “ALR-9800 Hardware Setup Guide, Rev. B,” pp.3, 2006.
- https://www.valuetronics.com/Used_Kay_1_839.aspx