Open Journal of Biophysics
Vol.3 No.3(2013), Article ID:34495,13 pages DOI:10.4236/ojbiphy.2013.33020
About Holographic (Interferometric) Approach to the Primary Visual Perception
Institute of Acoustics, Laboratory of Imaging and Signal Processing, Moscow, Russia
Email: vsvetd@mail.ru
Copyright © 2013 Victor D. Svet. This is an open access article distributed under the Creative Commons Attribution License, which permits unrestricted use, distribution, and reproduction in any medium, provided the original work is properly cited.
Received March 15, 2013; revised April 22, 2013; accepted April 30, 2013
Keywords: Inverted Retina; Scattering; Primary Vision; Holography; Interferometry
ABSTRACT
The discussed physical model of the primary visual perception is based on the joint consideration of the structural features of the retina and its functioning, namely, inversion of the retina, the presence of micro-oscillations (tremor), high rate of reaction of photoisomerization and its spatial-time coherence. The above model indicates the existence of significant forward light scattering in the layers of the retina. The existence of micro-oscillations and partial time coherence of the first stage of photoisomerization reaction allows proposing a mechanism of image restoration based on the principles of holographic speckle interferometry.
1. Introduction
Since H. Helmholtz the classical theory of primary visual perception is based on the fact that the image of object built by eye refractive system is registered by photoreceptors of the retina in the form of two-dimensional intensity distribution uniquely associated with the image of an object [1]. That is why in the popular and scientific publications functioning of eye is often compared to a camera. At the same time, the neurophysiology and psychology of visual perception had gained many facts that are hard to reconcile with theory of visual perception, and even contradict it.
Some experimental and proved facts are:
1) Our retina is inverted and passing light waves are propagating through intermediate layers of cells and then fixed by photoreceptors [2]. Layer cells have random and different refractive indices which should cause a direct scattering of light [3]. Because of scattering, the unambiguity of projected image can be destroyed. What is the level of direct scattering?
2) Image disappears at the stabilization of high frequency oscillations of the eye (tremor), so called Troxler effect [4]. Why? It’s hard enough to imagine a camera that is “shaking” during shooting.
3) It has been found that the first phase of photo isomerization reaction of rhodopsin has a fantastic rate of 100 - 200 fs [5,6], although the duration of the potentials due to the light stimulus is amounting to tens or hundreds of milliseconds. What could be the physical reason for such a high speed?
4) Due to diffraction of light on the pupil photoreceptors, their small lateral dimensions should detect light waves with very high spatial frequencies (up to 200 lines/mm), but our lateral resolution of vision is significantly less—no more than 10 - 12 lines/mm. Where is the filtering of high spatial frequencies?
5) Human retina has more than 120 × 106 photoreceptors, but optic nerve has only about 106 nerve fibers [2]. Where is the compression of the image?
As follows from this list our eyes have anything similar with a camera. It is quite another “optoelectronic” device and the similarity with the camera is very superficial.
It goes without saying that mentioned amazing features of the visual apparatus separately have been analyzed by many neurophysiologists in detail and they made a lot of hypotheses. However, it appears that if these features are considered together, it is possible to offer a new physical model of visual perception, which helps to explain how such strange visual system can work.
We want to emphasize that the discussed approach to the primary visual perception is a possible physical model and it describes the possible physical principles of primary vision and this model should be confirmed experimentally. From other side, exactly known and proven neurophysiological and psychophysical data are the basis of this model.
2. Forward Light Scattering in Layers of Retina Cells
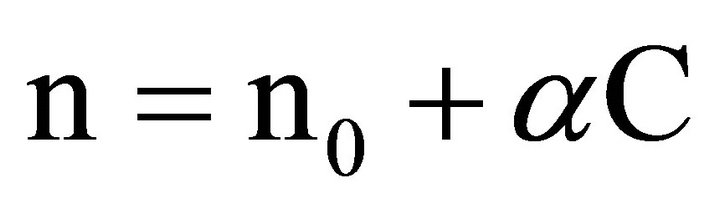
Direct scattering of light in layers of the retina is due to differences of local coefficients of light refraction in the cells and their components, the shapes and locations of which are irregular and random. Numerous experimental measurements performed on the retina and separate cell preparations indicate that the scattering may be strong enough [3,7-12]. Light scattering in biological tissue and cells is discussed in a large number of works, see, for example [7,8,12], because the nature of scattering can be an important diagnostic sign in a variety of diseases. In the majority of works on scattering cell structures are considered as complex dielectric objects subject to a certain law of distribution of the refractive index of light, which usually fluctuates in a fairly wide range from 1.3 to 1.7 [8,9]. Although the biological tissues of internal organs have different structures, morphological structures of cells do not differ. The components of a cell are cytoplasm (its size fluctuates from 10 to 40 microns) and various organelles (their sizes fluctuate from one to tens of microns) [7,8]. The largest organelle is the nucleus with the size of 3 - 10 microns. The sizes of smaller organelles such as mitochondria, lysosomes and others fluctuate from 0.5 microns to 1.5 microns. Volume ratio of different components in the cell can vary greatly depending on the type of tissue but on average it is believed that the cytoplasm is about 45% - 65% of a cell, the nucleus—about 5% - 25%, mitochondria—5% - 15%, while all the other organelles range from 1% to 10% of the total [8]. Refractory indexes of light in the components of cells are determined by the concentration of protein. According to [8], any component of the cell can be considered as a solution of protein with a refractory index of
 (1)
(1)
where  is the refraction index of the fill fluid similar to water and С is the concentration of the solution (g/100 ml). For protein α = 0.0018, although there are cells where α = 0.0016. Table 1 shows some published data on the indexes of refraction for various components of a cell [8]. It allows us to conclude that the layers of cells located before photoreceptors are a fairly complicated optically inhomogeneous medium with a random distribution of local refractory indexes.
Method of calculations of direct scattering of light in retina was published in our works [13-15] and here we shall only present some final results. Since we are interested in the overall picture of the estimated scattering, layers of cells can be regarded as a sequential alternation of random transparent “phase” screens located in a uni-
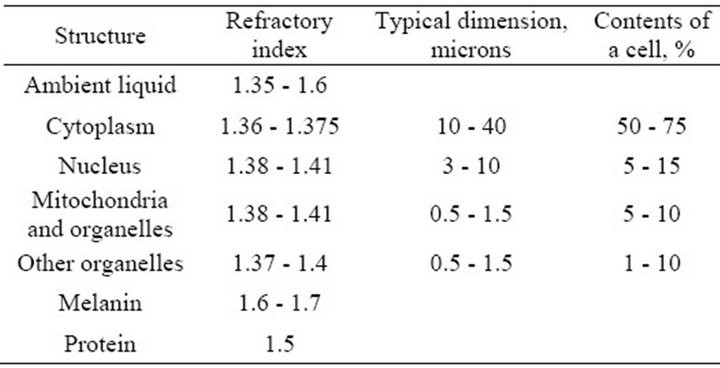
Table 1. Characteristics of the components of a cell [8].
form layer. Each screen can consist of “N” transparent heterogeneities with certain sizes and random values of the refractory indexes of light. To simplify the modeling phase heterogeneities were chosen in the form of spheroids oriented perpendicular to the plane of photoreceptors. In this case, different layers of cells have different thickness and the concentration of heterogeneities in each layer can be arbitrary. Computational model of direct light scattering is shown in Figure 1 where the optical system “cornea + lens” is replaced by a single equivalent lens.
Diffraction theory of constructing an image by lens with inbound aperture is based on the fact that in the focus plane the original image is reproduced by the coherent collaboration of complex amplitudes of waves diffracted on the diaphragm (pupil), up to a phase. Even a rough estimate of phase distortion of the wave front indicates that the layer of wave thickness Lsl = λ with a difference in the refractory indexes of Δn = 0.06 can create big phase variations of Δφ, namely Δφ = (2π/λ) dΔn ≈ 22˚. Conversely, when the length of the layer Lsl reaches the order of thickness of retina (≈200 μm) phase shifts will be very large.
The value of diffraction focal spot ΔZ along the longitudinal axis plays the important role in scattering, since it is a quadratic function of the ratio of the focus to the diameter of the pupil [16].
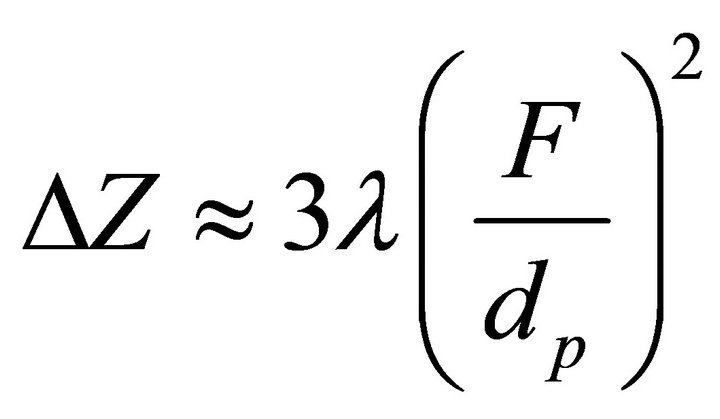 , where F—focal length, dp—diameter of pupil, λ—wavelength The larger the pupil, the smaller the size of the longitudinal spots
  and the greater the light scattering. Some models of the cell layers of cells with various sizes are shown in Figures 2(a)-(c). Here, on three-dimensional images of cells, “heights” of the phase heterogeneities are proportional to the value of phase incursion beam passing through a local non-uniformity. The values of phase shifts were calculated on the basis of the range of a random local spread of the refractory indexes of light in the range of nmin = 1.35 up to nmax = 1.5, and a given thickness of the layer for the chosen screen type.
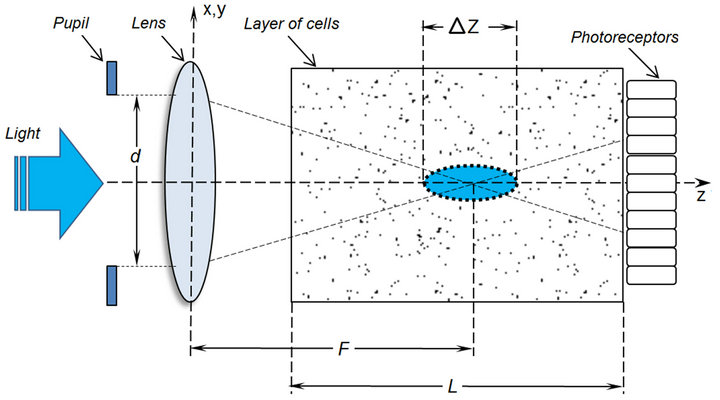
Figure 1. Computational model of direct light scattering in retina layers.
The combination of these screens made it possible to simulate the thickness of any layer of the nerve cells of the retina, putting them closer or apart.
Now let’s consider some examples of direct scattered fields in retina layers [14]. Figure 3 shows two images of the intensity distribution of the light field calculated for the plane of photoreceptors where the cells’ layers are homogenous and have the same constant index of refraction. The two-dimensional image is the distribution of the intensity of a projected image of a point source along the axial coordinate Z and the transverse coordinate X. The center of the bright spot is at 23 mm with crystalline lens’ focal distance F = 20 mm and the size of the pupil dр = 1 mm. The right image is the three-dimensional image of the same distribution. The scale is linear throughout and it can be seen that the level of the first side lobe equals 18% - 20%, as it should in the case of monochromatic light diffraction on a round hole in the absence of shadowing.
The next images reflect the situation when the image of a point source was projected through an inhomogeneous layer of cells 50 microns thick, and the diameter of the pupil was equal to dр = 1.0 mm and dр = 1.5 mm, Figures 4 and 5 respectively. The scale on Figures 4-6 is the same as on Figure 3.
Note that despite the small pupil diameter and a small thickness of the layer light scattering is present, though its level is not so high. Nevertheless we can see that even a very thin layer of phase inhomogeneities creates light forward scattering and its level is very sensitive to the size of the pupil.
However, the nature of the scattering drastically changes when the thickness of the cell layer of the retina close to the anatomical value (220 - 250 microns) and pupil diameter varies from 3 to 5 mm, which corresponds to vision in normal lighting conditions, Figures 6 and 7.
The distinctive feature of these images is that for the indicated parameters the image of projected point source is missing. Image on Figure 6 looks like a highly distorted image of a point source with a random shape and some noise, and image on Figure 7 has no regular struc-
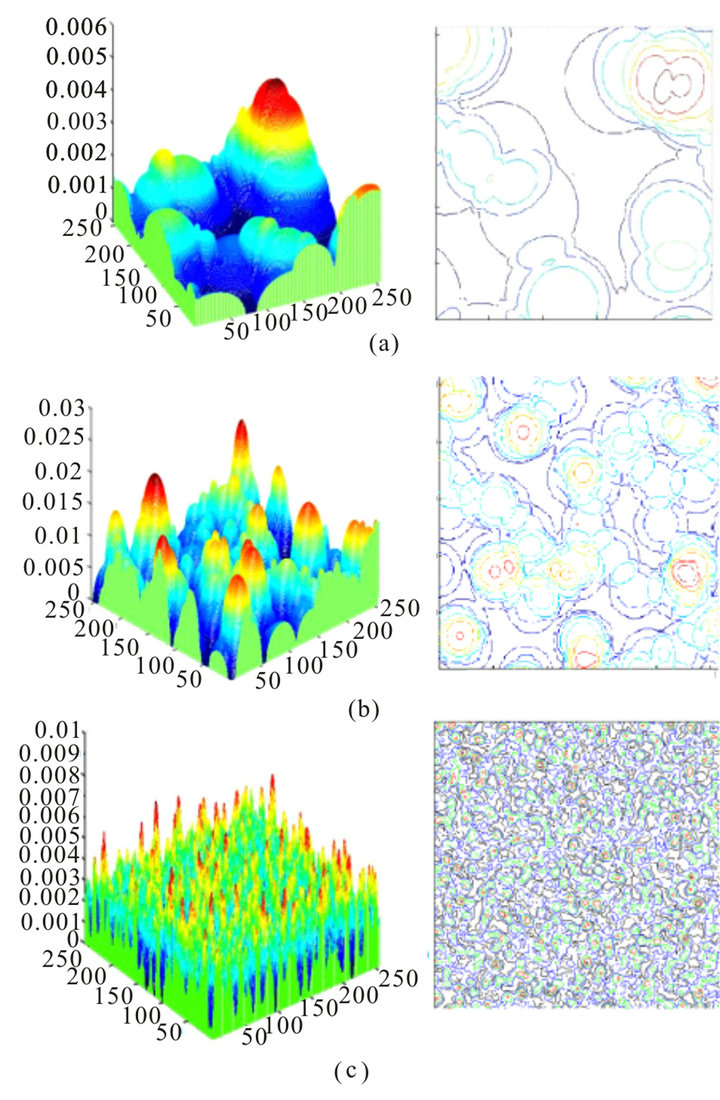
Figure 2. Images of modeled cell layers. (a) Phase screen of the first type. Number of cells 1024, size 0.005 × 0.005 mm, thickness 0.06 mm, concentration K = 0.2. (b) Phase screen of the second type. Number of cells 1024, size 0.0025 × 0.0025 mm, thickness 0.03 mm, concentration K = 0.2. (c) Phase screen of the third type. Number of cells 1024, size 0.0005 × 0.0005 mm, thickness 0.01 mm, concentration K = 0.2.
ture at all and it is very close to noise image.
Note that when similar simulation results of direct scattering in the retina were first published [13] they have caused a wave of criticism and objections from biologists. Critics said (and still say) that “this simply can not be (as we see)”, that in “the macula layers of cells are absent and this region is very thin”, “yes, the light scattering is, but it is very small and does not affect the image quality” and so on. However, with the points of view of wave optics light scattering should be, if the published experimental data on the local refractive indices are correct. Best of our knowledge, no one has refuted these data received by many different authors so far.
Realizing that the direct scattering impairs the quality of the projected image, some researchers have suggested that its impact may be reduced by specific optical properties of Müller glial cells [17,18] which penetrate layers
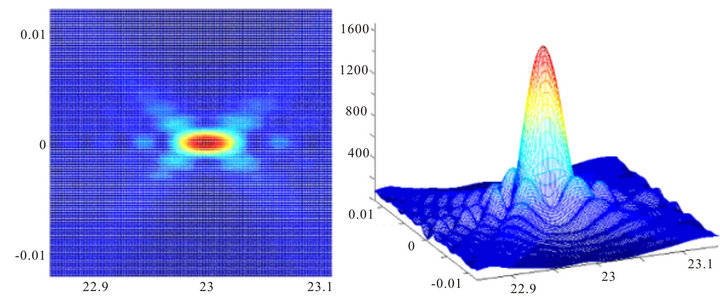
Figure 3. Image of a projected point light source where nerve layers are homogenous.
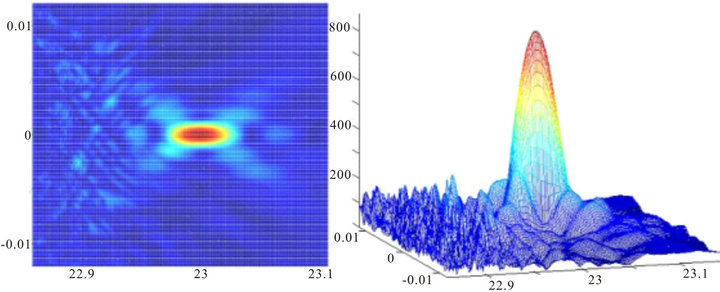
Figure 4. Image of a point source with the diameter of the pupil 1 mm, the width of an inhomogeneous layer L = 50 microns and the type 3 phase screen.
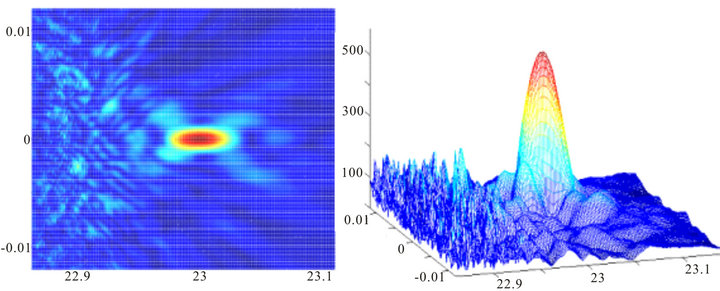
Figure 5. Image of a point source with the diameter of the pupil 1.5 mm, the width of an inhomogeneous layer L = 50 microns and the type 3 phase screen.
of nerve cells of the retina in the longitudinal direction like single mode fibers in a regular optic faceplate. In other words, the image is not distorted because it is projected onto the photoreceptors through a regular “biooptical-fiber” structure.
As we see the image of the point source in transverse
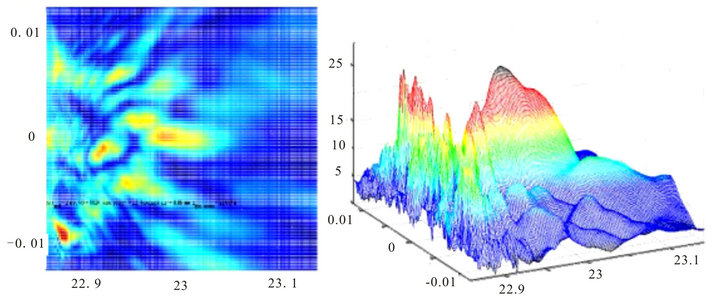
Figure 6. Image of a point source with the diameter of the pupil 3 mm, the width of the inhomogeneous layer at L = 200 microns. The layer consists of three phase screens—two type 2 screens and one type 1 screen.
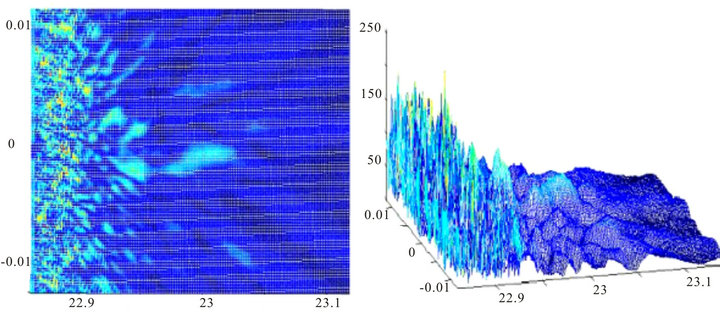
Figure 7. Image of a point source with the diameter of the pupil 5 mm, the width of the inhomogeneous layer L = 200 microns. The layer consists of three phase screens of all types.
coordinates X and Y, the resultant images with different proportions of the pupil diameters and layer widths will look as shown in Figure 8. We should note that each elementary pixel on these images is about size of photoreceptor (3 - 5 microns).
Since our transverse resolution is much worse and is not more than 85 - 100 microns, the grey scale images on Figure 8 after the spatial high frequency filtering will look closely, as shown on Figure 9.
Note that images b-d look like images of random noise. As there is no doubt about the correctness of our calculations and used mathematical methods, the results of modeling suggest the following conclusions:
• Forward light scattering in the layers of the retina should be.
• Its level strongly depends on the size of the pupil—the larger the size of the pupil, the higher scattering.
• Due to scattering the projected image of the object is distorted and can take many random forms, until its transformation into image of noise.
• The image projected on the inverted retina does not match the original image. This is a completely different image.
3. Random Movements of the Visual Apparatus
Another phenomenon of visual perception is associated with the movements of the visual apparatus. These movements have been studied for more than 100 years; however, the role and importance of some types of movements for visual perception are still unclear. In the early 19th century, Troxler discovered that if a motionless object was located in the field of peripheral vision and the viewer fixed their gaze on it, the image would “disappear”. Only in the late 1950s Troxler’s effect was reliably confirmed in laboratory conditions
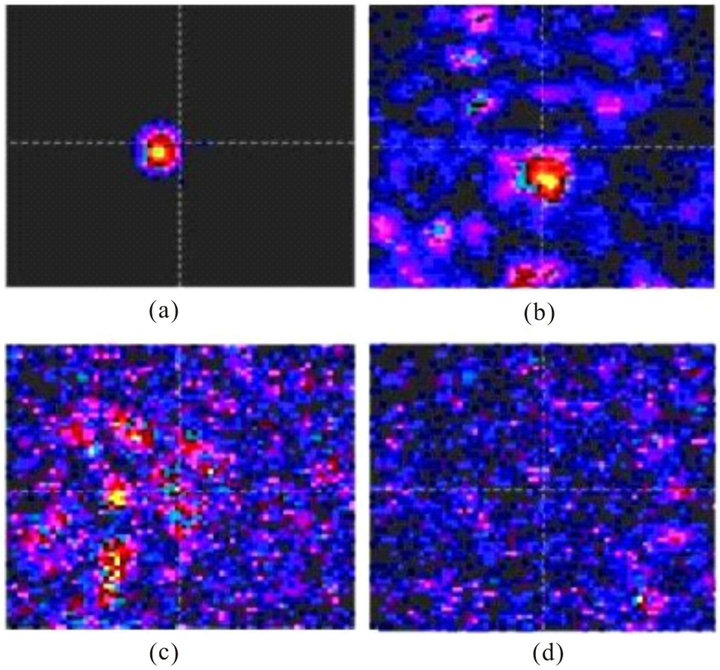
Figure 8. Images of a point source in the XY photoreceptor plane with the width of the layer 200 microns. Pupil diameters 1 mm (a), 2 mm (b), 4 mm (c), и 5 mm (d).
when the image was stabilized on the retina, and, moreover, it was discovered that a similar loss of the image occurred when other, quite small in amplitude, motions such as displacement and tremor took place [4,19-25]. This effect of a “blank field” was also observed and most of the observers noted that they saw “a grey background”, and, sometimes, a non-uniform grey background, but none of them saw the projected images.
One particularly “intriguing” movement in this regard is tremor or physiological nystagmus—casual and highfrequency (up to 120 Hz) random fluctuations in the ocular apparatus with angular amplitudes of no more than 25 - 30 arc seconds. In the first publications [19] it was assumed that the disappearance of an image occurred in a few seconds after these micro movements was stabilized. However, as soon as the measurement technology was improved in the late 90s, it was discovered that an image disappeared even with very short pepriods of stabilization (less than 80 milliseconds) [20-25]. This indicates that there is some other mechanism of disappearance of an image and its reconstruction when stabilization is over which is very fast. Numerous measurements of the time-and-frequency parameters for different types of micro movements in the visual apparatus were summarized in the review [23]. It also discussed various (and sometimes conflicting) hypotheses on the role of such movements in visual perception. So far, we can be sure about one thing only: the stabilization of images on the retina leads to the inability to see and the existing theory of visual perception fails to explain this effect. There is no vision without movements.
Let’s note that the observed “effect of an empty field” or the perception of a motionless image in the form of a
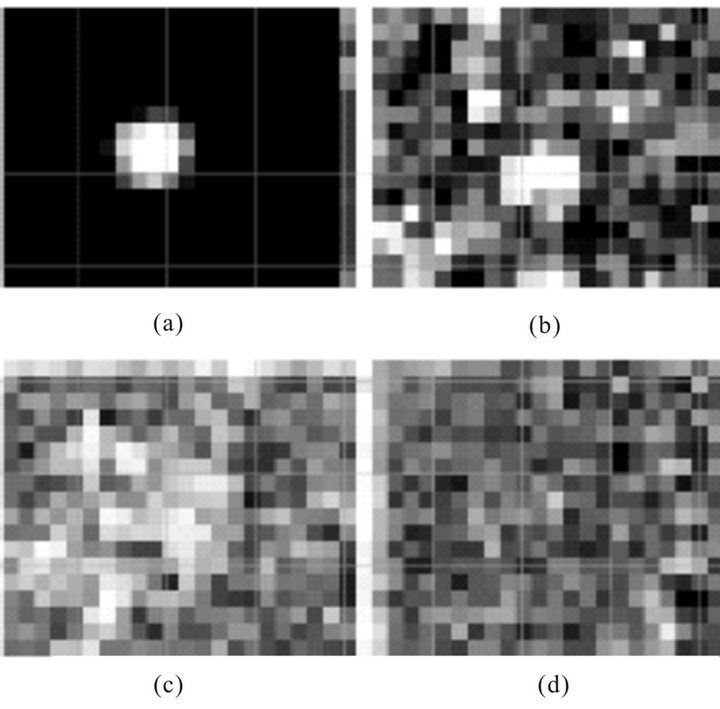
Figure 9. Grey scale images of point source after spatial low frequency filtering. Pupil diameters 1 mm (a), 2 mm (b), 4 mm (c), и 5 mm (d).
non-uniform gray background greatly correlates with the modeled images of a point source, projected on photoreceptors through a layer of nerve cells: when the size of the pupil is normal, the image of a point source by means of the direct scattering of light is transformed into an almost uniform gray background, Figures 9(c)-(d). In other words, the effect of an empty field is an indirect proof of the existence of intense direct light scattering in the cell layers of the retina.
4. Rhodopsin Photoisomeration Reaction
In the mid 80’s with the advent of lasers with very short pulses it was found that the initial reaction of photoisomerization of rhodopsin runs for a fantastic short time— 100 - 200 femtoseconds [5,6,26]. Rhodopsin photoisomerization reaction is a biochemical reaction, which transforms optical excitation of photoreceptors into electrical pulses which passed through the optic nerve to brain.
This reaction in the photoreceptor consistently implemented the conversion of different proteins in each other (6 types), and with increasing deceleration time. The scale of time varies from hundreds of femtoseconds to tens of milliseconds. The latest product of the reaction leads to the appearance of the electric potential in output of photoreceptor. The most important fact is that the reaction of rhodopsin photoisomerization is a coherent chemical reaction, i.e., all the successive conversions of various proteins (reaction products) occur simultaneously in time and space [26]. To oversimplify, we can say that this coherence means that if two photoreceptors got two photons at the same time, the resulting electrical potentials occur simultaneously, albeit with a huge time delay. In fact, the potentials may not appear at the same time, and with some time shift, but the coherence of the response indicates that this shift is not random.
This high conversion rate suggests the existence of the temporal coherence of the light, because time of 100 - 200 fs corresponds to only a few dozen periods of light wave. One train of atom radiation contains million wavelengths. What can be the role of the temporal coherence of light in image processing, considering that this coherence is preserved in the output electrical potentials?
5. Lateral Resolution of Vision
We have already mentioned that the angular resolution of a normal eye is about one angular minute, although the potential angular resolution is much higher and is determined by the wave size of the pupil. If we consider that the refractive system of the eye is an ideal thin lens the diffraction angular resolution (in degrees) by the level of intensity (−3 dB) will be equal to
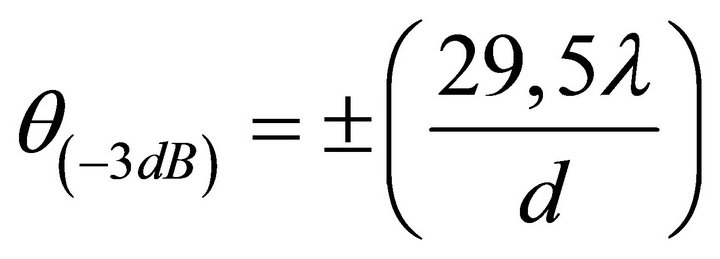 . (2)
. (2)
In (2), λ is the wavelength of light, and d the diameter of the pupil. In particular, if λ = 0.63 um, and d = 3 mm, then θ ~ 22”, and if d = 6 mm, θ ~ 10”. Dimensions of the photoreceptor constitute 3 - 6 um and they in particular determine the maximum possible linear resolution. However, psychophysical measurements have shown that an average person sees objects with dimensions of no less than 100 microns (0.1 mm) [27], i.e., almost by an order of magnitude worse. However, in order to see objects with a resolution of 100 microns one does not necessarily have photoreceptors with the size of 5 - 7 microns. In other words, from the “technical” point of view, the number of photoreceptors in the retina is redundant - instead of the matrix of 3500*3500 reception elements we could have 10 times less of these. Why do we not use the ability to see in a much higher resolution, built in by nature itself, having all the necessary “technical” preconditions in the primary visual apparatus?
Specialists on visual perception explain low angular resolution by evolutionary features of human development and the abundant number of photoreceptors by the high reliability of the retina. It is obvious that these arguments are not devoid of sense. However, another fact should be recalled—the number of nerve fibers in the optic nerve is less than the number of photoreceptors by about two orders of magnitude, i.e., in the process of visual perception compression (and perhaps some kind of processing?) of information by 100 times occurs. In other words, the ability to distinguish details of an image at about 100 microns or more is a result of processing the input image by the entire system of visual perception— photoreceptors, retinal cells and visual cortex. But due to the diffraction of light on the pupil aperture, components of the light field with high spatial frequencies must be presented in the primary photoreceptor field and be recorded by it. In this case the question of how and at what stage these more high-frequency components are “filtered” by the primary visual apparatus in the resulting image arises.
6. Proposed Physical Model of Primary Visual Perception
So, in our scheme the following sequence of events occurs when observing a point source of light:
• The image of the source is projected by the refractive system of the eye in a certain scale through a scattering medium—the nerve cells of retinal layers.
• The scattering medium transforms the original distribution of the optical field into a random distribution and it is displayed on the photoreceptors.
• Photoreceptors record this spatial distribution of intensity.
• Some time later (digits and tens of milliseconds after the primary photochemical reaction) the spatial distribution of electric potentials arises at the synapses of photoreceptors.
• These potentials are processed in the layers of nerve cells of the retina and then this information, processed and compressed by approximately one hundred times, enters the visual cortex through the optic nerve where a visual image of a point source is recognized.
• All these transformations are carried out in the presence of high-frequency oscillations of the visual apparatus in the absence of which the projected image is lost.
How could this visual apparatus work?
From the physical point of view, this problem is very similar to the imaging objects through scattering media and, therefore, it is only possible to find a solution on the basis of coherent wave optics, which involves consideration of possible diffraction and interferential phenomena in the visual apparatus and determines the possibility of registration full optical field that keeps all the amplitude-phase information. If conditions for registering the full field do exist in the visual apparatus, a number of methods that would handle and restore the original image of an object located behind an inhomogeneous scattering layer of cells can be proposed. Since the photoreceptors are quadratic receivers, the registration of the full optical field is only possible if the interference pattern of scattered fields on the photoreceptors is formed for some time, namely the time of coherence, and during this time they are able to register it. This interference pattern of scattered optical fields can be also called a hologram.
The holographic or interference approach to visual perception is not new and it has been hotly debated in biophysics for more than 40 years. Many of these works appeared after the publication of the famous book by D. Bohm [28] on the “holonomic” principles of the universe. However, many authors have applied this approach in a very abstract way. Discussing the fact that our vision is similar to holography, none of them asked: “But, indeed, how are the holograms or interference structures formed, and how can they be extracted from visual information?” Apart from a number of speculative and often simply incorrect assumptions, in discussing “holographic eyes and brain” we can mention a number of physiologists, for example, K. Pribram [29,30], Glazer [31,32] and others, who put forward several experimentally-based holographic concepts, although they were directly related to models of visual perception as a whole. In particular, K. Pribram [30] did not even doubt that the hologram, which was originally used as a metaphor or an analogy to explain some of the abnormalities in the work of the nervous system, has become an accurate model of the natural forms of its work. The inventor of holography D. Gabor also talked about the “similarity of holographic registration with the human memory” [33].
In Glazer’s works [28,29], which have been largely stimulated by Hubel’s and Wiesel’s earlier work [34] on the existence of fields of neurons which respond to the specific features of images, the concept of spatial frequency of filtering visual information by the neurons of the visual cortex was proposed. Hubel’s and Wiesel’s work [34] showed that in the axis of any module of the visual cortex neurons can be connected to the same field of the retina, each of which gives a maximum response only to its own grid, i.e., a well-defined spatial frequency. Glazer believed that the entire space of the retina was “divided” by cortex neurons into a multitude of spatial-frequency fields, and the image is analyzed for each local field with a given value of spatial frequency or a set of spatial frequencies.
All of these hypotheses and assumptions have led researchers to the logical conclusion that in the primary visual apparatus some spatial transformations of images are implemented, which are similar to a Fourier transformation, and the visual cortex already “works” with the signals of different spatial frequencies of the resultant angular spectrum. The idea of Fourier analysis of images has become so popular among professionals in the field of physiology of vision that in many works allegations that “the human eye performs a Fourier transformation of the original image” have appeared.
Physicists have also turned their attention to a number of contradictions in the visual apparatus related to the inverted retina. However, unlike physiologists they tried to simulate possible “optical” schemes of hologram formation at the stage of primary visual perception [35-39]. We should in particular mention the works of [35,36], where nerve layers of the retina were simulated as a group of regular diffractive grids following one another. The authors of [36] dubbed their retina model a “trichromatic four-dimensional optical correlator”, noting that apart from the determination of color it allowed to mark out the directions of emission sources. However, the authors did not describe any processing algorithms in detail.
In [37,38], it was hypothesized that a dynamic hologram may appear on the retina as a result of double refraction of light on the nerve fibers in the area of the yellow spot, as in this area of the retina the fibers are almost parallel to each other. Moreover, in [38] the authors hypothesized that depending on accommodation the appearance of dynamic holograms can happen in different areas of the retina in the vicinity of the yellow body, which in turn suggests the possibility of extracting information about the depth of field in monocular vision.
The suggested models are plagued by a number of “inconsistencies” and even contradictions. For instance, the model of [36] is based on the assumption that cell layers form regular diffractive structures, although morphologically these structures are random. The model of the retina as a positive uniaxial crystal allows constructing dynamic holograms in what practically amounts to white light, but in a very narrow field of vision; at the same time it is unclear what processes happen in the peripheral sections. In the models [37,39] a mistaken view that the diffractive image of an object is its Fourier angular spectrum is expressed.
However, these models ignore some important factors:
• The authors of the cited works did not consider the possible scattering of light in the layers of the retina, and in some works the inverted nature of the retina was ignored altogether.
• The models described above did not consider microoscillations of the eye apparatus at all, although it is necessary to keep them in mind in capturing the field as a hologram.
• The use of the methods of wave coherent optics and holographic approaches by default assumes the presence of the temporal coherence of light in the visual apparatus, and the ability of the visual apparatus to function on the basis of coherence, particularly in the case of white light.
• The reconstruction of image from Fourier angular spectrums is possible only if photoreceptors fix complex, “amplitude-phase” angular spectrum and not an angular spectrum on intensities.
Two physical models are presented on Figure 10 and Figure 11. Scheme on Figure 10 is a classical model of visual perception where the image of a point light source
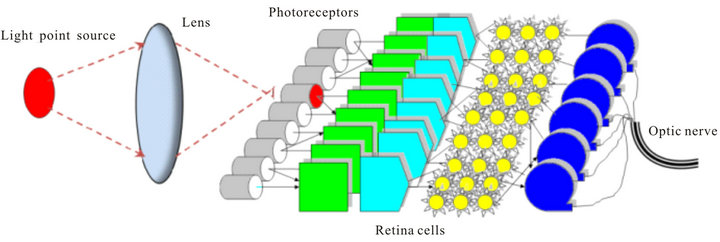
Figure 10. Classical model of visual perception.
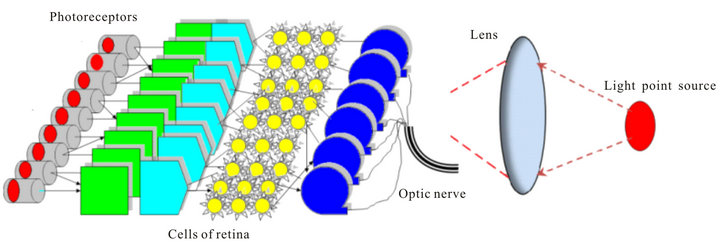
Figure 11. Proposed physical model of visual perception.
is conditionally detected by one photoreceptor. In this scheme inverting of retina and forward light scattering are ignored.
The real physical model of visual perception is presented by Figure 11. Due to light scattering in retina cells many photoreceptors are detected the light field from point source and the projected image does not match the image of a point source and the entire visual system oscillates over the transverse coordinates.
Restoring the original image in this optical model containing the scattering medium can be achieved by several methods, developed in coherent optics [40], namely, by matched filtering processing (phase conjugation) and nonlinear methods of holographic speckle interferometry [42-46]. Despite the fact that matched filtering processing is the most accurate method of image reconstruction in a heterogeneous environment; the difficulties of its implementation in visual apparatus are obvious. First, it requires the calculations or measurements of all the transmission characteristics of an inhomogeneous medium (with a phase accuracy!), and second, the scattering layer or all optical system must be fixed during processing. Moreover information capacity of such processing must be very large (more than several tens of gigabits per second), while it is known that in optical nerve it is limited to about 50 megabits per second.
Therefore, we consider the use of alternative methods of nonlinear speckle interferometry, which do not require a priori knowledge of the transfer characteristics of an inhomogeneous medium. A detailed description of these algorithms can be found in [42-44], and so here we consider their physical sense and the necessary conditions to implement them.
The conditions are as follows:
• The emitted field must be characterized by partial temporal coherence, τc.
• The model of the object must be described by a system of point sources which randomly change their phases and amplitudes in time.
• Such changes may be caused both by natural physical causes and small shifts in object points or the receiving system.
• The parameters of the inhomogeneous layer must not change during each exposure.
• The time of each exposure must be less than τc.
Image reconstruction can now be represented as follows. Let us assume that the crystalline lens projects an image of some object through an inhomogeneous layer.
The field of the object  represents the sum of scattered waves
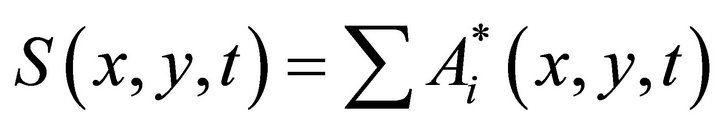 (3)
(3)
where  are complex functions, diffracts on the phase inhomogeneities of the layer
  and transforms into a random field
  which can be recorded as a convolution
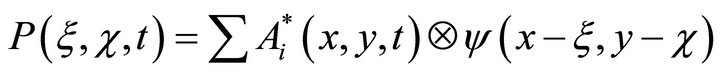 (4)which describes the speckle-structure in which amplitude
  and phase distributions
  are random.
The light field detected by the photoreceptors can be recorded as
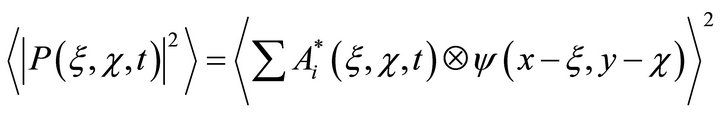 (5)
(5)
where angle brackets denote the averaging of time. From (5) it follows that the detected field contains a multitude of combinative components. They contain all the information about amplitude and phase relations in the optical field, i.e., full optical field.
Although the speckle-structure appears to look like a random collection of spots, in reality its pattern is a result of a coherent combination of many waves, which form such a complicated interferential pattern. This pattern in effect constitutes a diffusive speckle-hologram of an object, that is, a hologram registered through a diffusive scattering screen. Phase information about the light field is encoded in the angular position (inclines) and frequency of interferential bands and the amplitude in their intensity. One of the examples of structure of diffusive speckle hologram is shown on Figure 12 [45].
If we assume that the inhomogeneous cell layer of the retina is similar to an “uneven frosted glass” with a certain average diffraction index “n”, then the average difference in thickness of such a layer because of its uneven surface can be denoted by a certain value δ and introduce a parameter of “average unevenness”:
 (6)
(6)
in this case the condition for choosing two speckle-structures is the following ratio:
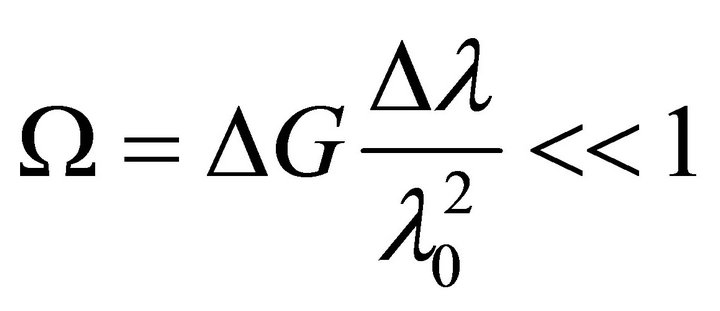 (7)
(7)
it is easy to see that the second multiplier in formula (7) is a value inverse to the duration of temporal coherence.
For photoreceptor’s reaction time of 100-200 fs and the parameter of unevenness of ΔG = 1 the duration of temporal coherence lcoh= 30 - 60 um. Thus, if the maximum shifts between separate speckle structures do not exceed this value, they will remain similar or correlated. If we remember that the amplitudes of tremors are in single digits of microns, the condition () is fulfilled with high precision.
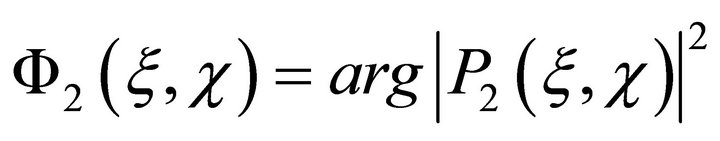
Let us now assume that at a certain point in time t1 we separated a single phase component from the interferen-
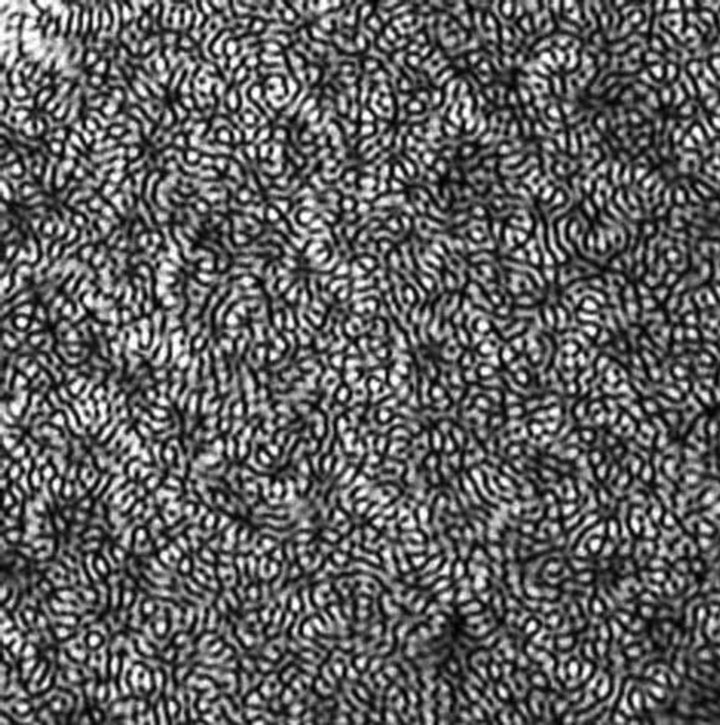
Figure 12. Fragment of diffusive speckle hologram [45].
tial pattern as a whole
 (8)
(8)
and then in a time period t2 = t1 + Δt made a second measurement
 (9)
(9)
during this time the image shifted to a value less than lcoh. Now we form a diminution
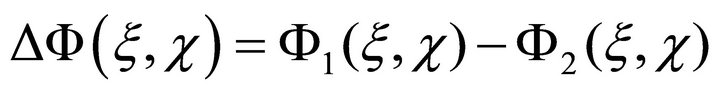 (10)
(10)
and reconstruct the image by this differential hologram. In this case the term “image reconstruction” means that we use a Fourier transformation of (10). The method for separating just the phase component and the transformation itself is discussed in [41,43]. Because the inhomogeneous layer introduces multiplicative noise to the spatial distribution of the signal, the operation (10) subtracts all the constant phase shifts acquired by the signals in passing the inhomogeneous layer.
As we use the convolution of two fields of the initial object in the reconstruction, we will not, of course, obtain its actual image. The reconstructed image will consist of separate points with random distribution and random amplitudes. The number of points will be also random. What is important, however, is that the points will be located only in the area occupied by the initial object. If we will periodically repeat the calculations and average (sum) output dot images, the pattern will be filled with new points and smoothen out; the end result will be the initial image of the object.
Let’s illustrate how this algorithm works on the example of reconstruction of simplest object-point source, Figure 13.
At some moment photoreceptors fix the first speckle hologram of point source through scattering layers of cells. Visually it looks like noise. This hologram contains high spatial frequencies due to diffraction of light waves on a pupil. In some time ∆t due tremor photoreceptors will fix the second speckle hologram. Further, these holograms are compared.
The third hologram is a result of this comparison and it does not contain high spatial frequencies. It can be assumed that such comparison is similar to compression of the visual information about a hundred times which is consistent with information capacity of the optic nerve. Structure of the third hologram is the usual interference fringes, where their slope and the spatial frequency (period) uniquely determine the position of a point source in the plane. Image restoration of extended objects is exactly the same. If we imagine that the object consists of a
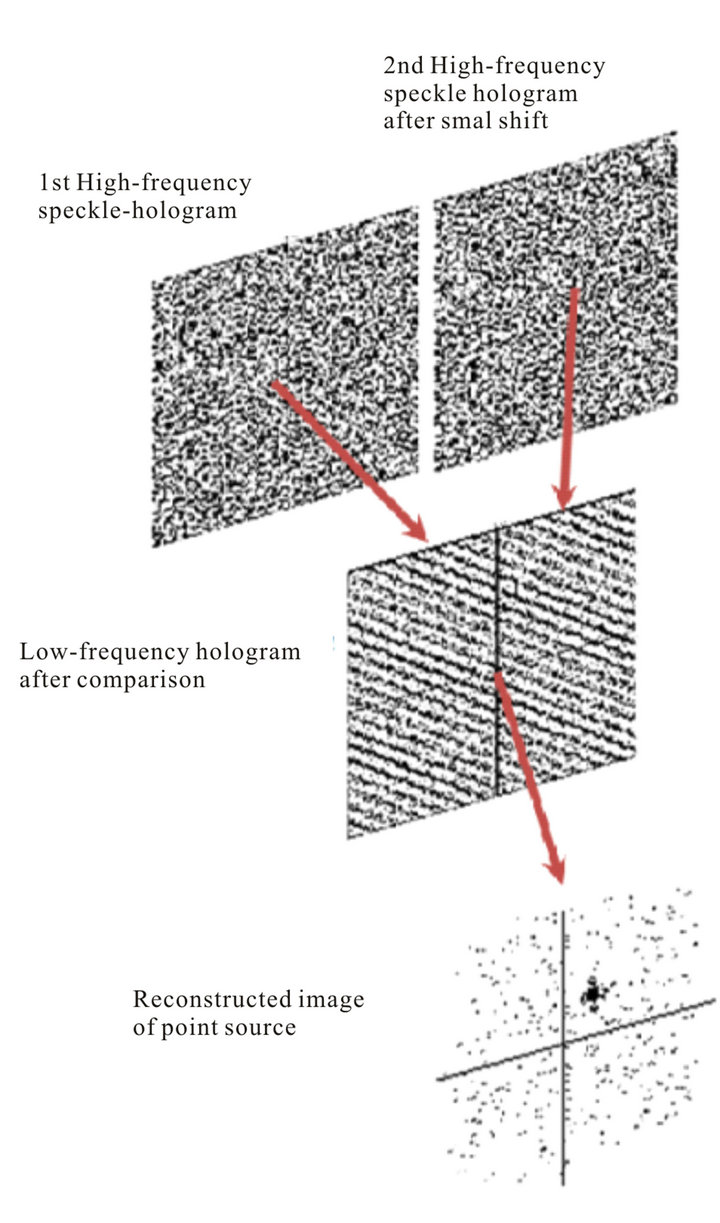
Figure 13. Reconstruction of the image of the point source.
number of independent points, the third hologram after comparison is a superposition of many fringes with different slopes and spatial frequencies and image reconstruction will be the same as for point source.
Some simulation results are presented on Figure 14.
How can “the visual apparatus + the brain” retrieve visual information from the speckle-holograms and perform operations like “comparison” and “reconstruction” so that an image would “appear” in the initial coordinates in the visual cortex?
The described algorithm of “comparison” using calculations of the difference of phase distributions is not the only one possible. Another possible algorithm is a side -by-side correlation procedure of two speckle-structures in their different spatial shifts. Such a correlative algorithm would, firstly, allow evaluating the times of group delays between electrical signals in separate photoreceptors and would therefore be able to work with broadband light waves, rather than just harmonic oscillations. Secondly, as we see, it better corresponds to the principles by which the “computational” cells of the retina operate, as a correlative comparison can be carried out according to the principle of the “concordance of signs”, or sign correlation. As it is known, the sign correlator is only slightly inferior to the linear correlator in terms of noise immunity, but is much simpler in execution and is absolutely insensitive to sharp and non-stationary changes in background intensity. It, as much as the linear correlator, preserves all amplitude ratios in signals, but not absolute and relative. We should note that mathematical descriptions of such two-level correlative circuits are very similar to descriptions of the principles of neural network functionality and the “computational” cells of the retina
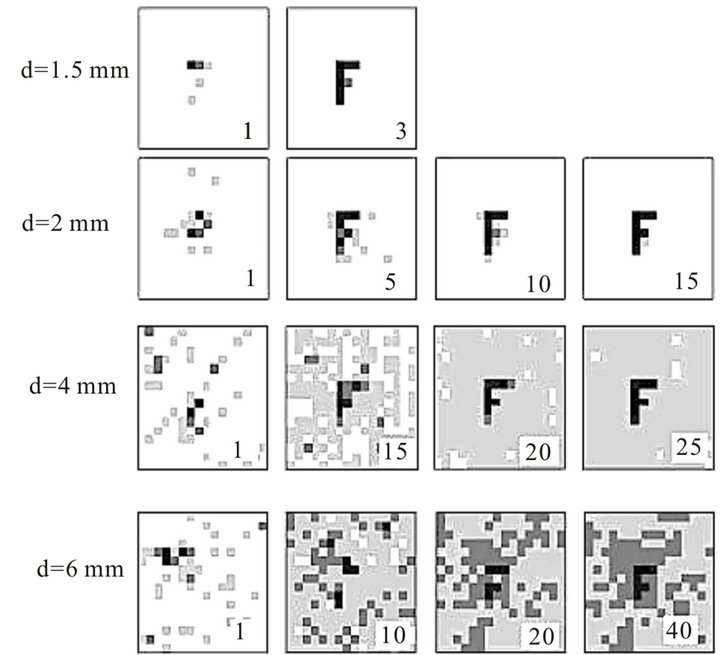
Figure 14. Reconstruction of letter “F” through scattering layer at different diameters of pupil. Digits 1 - 40 represent the number of averaging (iterations).
themselves.
Term “reconstruction” means some kind of processing the space distribution of electric potentials (third hologram) to reconstruct the initial image. From mathematical point of view the most accurate type of processing is a spatial Fourier transformation. It would also be logical to assume that this transformation or its equivalent is performed in the temporal area, as it can be expressed through the sums of temporally shifted correlative responses from many channels (cells) with predetermined laws of addition. Such laws are simply worked-out rules of combining signals to determined addresses, while a strict link between the addresses and the object’s coordinates, can be established by the coherence of the photoisomeration reaction. From a mathematical point of view it makes no difference whether the Fourier transformation is carried out: in the initial coordinate area or in the area of its spatial frequencies.
Since the pulse signals are broadband, it would be more “fair” to introduce time delays, as the phase shifts will be different for different frequencies. It would appear that in biological systems algorithms of the type “combination of signals with certain delays” are more realistic. Such summation of the electric potentials in the time domain by known addresses correlates well with the results of [34].
We should once again note that without micro oscillations it would be impossible to reconstruct the image in inverted retina. Without oscillations image will look like a noise background—“an empty field”.
7. Conclusions
1) Joint consideration of the known features of the visual apparatus, namely, inversion of the retina, the presence of micro-oscillations, the high speed of the first phase of the reaction photoisomerization and coherence of this reaction can provide a new physical model of the primary visual perception based on the possibility of fixing the full optical field as interferometry structures (speckle holograms) and further reconstruction of these holograms on the base speckle interferometry principles.
2) This model allows us to explain many of the phenomena that are found in the visual apparatus, but so far have not received a satisfactory explanation. These phenomena include:
• Inverting the retina.
• Termination of vision at the stabilization of the visual apparatus.
• Discrepancy of two orders the number of photoreceptor to the numbers of nerve fibers in optic nerve.
• Discrepancy of real angular resolution of vision to potential diffraction resolution
• Enormous dynamic range of illumination
• High reliability of vision, because the image can be restored only on a small part of the diffusive hologram.
3) The proposed model is a physical model built on the known principles of coherent optics. Although it is based on proven anatomical and neurophysiological data of different researchers, it is substantially different from existing conception of the primary visual perception. So the eligibility of this approach must be verified experimentally.
REFERENCES
- H. von Helmholz, “Helmholtz’s Treatise on Physiological Optics. Translated From the Third German Edition. Volume III,” New York: Optical Society of America, 1925.
- S. R. Cajal, “The Structure of the Retina,” Charles C. Thomas, Springfield, 1972.
- J. Beuthan, O. Minet, J. Helfman and G. Muller, “The Spatial Variation of the Refractive Index in Biological Cells,” Physics in Medicine and Biology, Vol. 41, No. 3, 1996, pp. 369-382. doi:10.1088/0031-9155/41/3/002
- R. Carpenter, “Movements of the Eyes,” 2nd Edition, Pion, London, 1988.
- H. Kandori1, Y. Shichida and T. Yoshizawa, “Photoisomerization in Rhodopsin,” Biochemistry, Vol. 66, No. 11, 2001, pp. 1197-1209.
- M. A. El-Sayed, I. Tanaka and Y. Molin, “Ultrafast Processes in Chemistry and Photobiology,” Blackwell Science, Hoboken, 1995.
- R. Drezek, A. Dunn and R. Richards-Rortum, “Light Scattering from Cells: Finite Difference Time-Domain Simulations and Goniometric Measurements,” Applied Optics, Vol. 38, No. 16, 1999, pp. 3651-3661. doi:10.1364/AO.38.003651
- A. Dunn, C. Smithpeter, A. Welch and R. Richards-Rortum “Finite-Difference Time-Domain Simulation of Light Scattering from Single Cells,” Journal of Biomedical Optics, Vol. 2, No. 3, 1997, pp. 262-266. doi:10.1117/12.275219
- D. Sardar, R. Yow, A. Tsin and R. Sardar, “Optical Scattering, Absorption, and Polarization of Healthy and Neovascularized Human Retinal Tissues,” Journal of Biomedical Optics, Vol. 10, No. 5, 2005, pp. 501-512. doi:10.1117/1.2065867
- S. Yin, T. Gurder, T. Thomas and K. Kolanda, “Light Scatter Causes the Grayness of Detached Retina,” Archives of Ophthalmology, Vol. 121, No. 7, 2003, pp. 1002-1008.
- H. Hammer, D. Schweitzer, E. Thamm, A. Kolb and J. Strobel, “Scattering Properties of the Retina and the Choroids Determined from OCT-A-Scans,” International Ophthalmology, Vol. 23, No. 4-6, 2001, pp. 291-295.
- S. Abdallah, “Finite-Difference Time-Domain Simulations of light scattering from Retinal Photoreceptors,” Ph.D. Thesis, University of Waterloo, Ontario, 2007.
- V. D. Svet, “About Possible Principles of Image Transformation in Inverted Eye Retina,” Doklady Physics, Vol. 409, No. 7, 2006, pp. 1-5.
- V. D. Svet and V. I. Gelfgat, “About Possible Light Scattering in the Inverted Eye Retina. Actual Problems of Modern Science,” Sputnik Publishing, Moscow, 2007, pp. 23-35.
- V. D. Svet and A. M. Khazen, “About the Formation of an Image in the Inverted Retina of the Eye,” Biophysics, Vol. 54, No. 2, 2009, pp. 193-203.
- M. Born and E. Wolf, “Principles of Optics,” 6th Edition, Pergamon Press, Oxford, 1993
- K. Franze, J. Grosche, S. Skatchkov, S. Schinkinger, C. Foja, D. Schild, O. Uckermann, K. Travis. A. Reichenbach, J. Guck and P. Flechhsig, “Muller Cells are Living Optical Fibers in the Vertebrate Retina,” Proceedings of the National Academy of Sciences, Vol. 104, No. 20, 2007, pp. 8287-8292. doi:10.1073/pnas.0611180104
- B. Vohnsen, I. Iglesias and P. Artal, “Guided Light and Diffraction Model of Human-Eye Photoreceptors,” Journal of the Optical Society of America A: Optics, Image Science, and Vision, Vol. 22, No. 11, 2005, pp. 2318- 2328. doi:10.1364/JOSAA.22.002318
- R. W. Ditchbern and B. L. Ginsburg, “Vision with a Stabilized Retinal Image,” Nature, Vol. 170, No. 4314, 1952, pp. 36-37. doi:10.1038/170036a0
- L. A. Riggs and F. Ratliff, “The Effects of Counteracting the Normal Movements of the Eye,” Journal of the Optical Society of America A, Vol. 42, 1952, pp. 872-873.
- A. L. Yarbus, “The Role of Eye Movements in Vision Process,” Nauka, Moscow, 1965.
- S. Martinez-Conde, S. L. Macknik and D. H. Hubel, “The Function of Bursts of Spikes during the Visual Fixation in the Awake Primate Lateral Geniculate Nucleus and Primary Visual Cortex,” Proceedings of the National Academy of Sciences of the United States of America, Vol. 99, No. 21, 2002, pp. 13920-13925. doi:10.1073/pnas.212500599
- S. Martinez-Conde, S. L. Macknik and D. H. Hubel, “The Role of Fixation Eye Movements in Visual Perception,” Nature Reviews Neuroscience, Vol. 5, 2004, pp. 229-240. doi:10.1038/nrn1348
- D. Coppola and D. Purves, “The Extraordinary Rapid Disappearance of Entoptic Images,” Proceedings of the National Academy of Sciences, Vol. 93, No. 15, 1996, pp. 8001-8004. doi:10.1073/pnas.93.15.8001
- G. M. Agadjanyan, “Role of Tremor and Shift in a Vision Process,” Doklady Biological Sciences, Vol. 370, No. 10- 13, 1999, pp. 455-459.
- O. A. Smitienko, I. V. Shaelaev, F. E. Gostev, T. B. Feldman, V. A. Nadtochenko, O. M. Sarkisov and M. A. Ostrovsky, “Coherent Processes at Formation of Primary Products of Photolysis of a Visual Pigment Rodophsine,” Doklady Biochemistry and Biophysics, Vol. 421, 2008, pp. 277-281.
- S. V. Kravkov, “Eye and Its Functioning: Psychophysiology of Vision and Hygiene of Illumination,” Nauka, Moscow, 1950.
- D. Bohm, “Wholeness and the Implicate Order,” Routledge and Kegan Paul, London, 1980.
- K. Pribram, “Holonomy and Structure in the Organization of Perception,” Stanford University, Stanford, 1976.
- K. Pribram, “Languages of the Brain,” Plenum Press, New York, 1989.
- V. D. Glezer, “Vision and Thinking,” Nauka, Leningrad, 1985.
- V. D. Glezer, “Mechanisms of Recognition of Imaging Patterns,” Nauka, Leningrad, 1966.
- D. Gabor, “Holographic Model of Temporal Recall,” Nature, Vol. 217, No. 5128, 1968, pp. 1288-1289.
- D. H. Hubel and T. N. Wiesel, “Receptive Fields and Functional Architecture in Two Non-Striate Visual Areas (18 and 19) of the Cat,” Journal of Neurophysiology, Vol. 28, 1965, pp. 229-289.
- N. Lauinger, “The Relationship between Brightness, Hue and Saturation When the Inverted Human Retina is Interpreted as a Cellular Diffractive 3D Chip,” SPIE Proceedings, Intelligent Robots and Computer Vision, Vol. 2588, 1995, pp. 208-232.
- N. Lauringer, “Inverted Retina of the Human Eye: A Trichromatic 4D Space-Time Optical Correlator,” SPIE Proceedings, Intelligent Robots and Computer Vision, Vol. 2904, 1996, pp. 344-360.
- V. P. Titar and O. V. Shpachenko, “Holographic Model of Physiological Optics—New Approach in Design of Information Systems,” Interdepartmental Collection on Radio Technique, Vol. 116, No. 2, 2000, pp. 35-39.
- V. P .Titar, T. V. Bogdanova and M. T. Torkatyuk, “Illusions of Vision: Holographic Interpretation Models,” Optics and Spectroscopy, Vol. 93, No. 4, 2002, pp. 686-694.
- G. C. Huth, “A New Explanation for Light Interaction with the Retina of the Eye Based on Nanostructural Geometry: Rethinking the Vision Process,” 2009. www.ghuth.com
- F. Roddier, “Adaptive Optics in Astronomy,” University Press, Cambridge, 1999.
- V. D. Svet, T. V. Kondratieva and N. V. Zuikova, “Trajectory Estimation of Moving Target in the Medium with a Strong Scattering,” Acoustical Imaging, Vol. 23, 1997, pp. 555-562. doi:10.1007/978-1-4419-8588-0_87
- V. D. Svet, T. V. Kondratieva and N. V. Zuikova, “Visualization of Blood Flow by the Method of Ultrasound Speckle-Interferometry,” Acoustical Physics, Vol. 47, No. 5, 2001, pp. 664-670.
- V. D. Svet, T. V. Kondratieva and N. V. Zuikova, “Reconstruction of the Acoustic Images of Dynamic Objects Located under a Non-Uniform Layer,” Acoustical Physics, Vol. 48, No. 6, 2002, pp. 779-789.
- B. B. Gorbatenko, V. P. Ryabukho and L. A. Maksimova, “Reconstruction of Spatial Phase Distribution in Diffracted Speckle Field and Restoration of Image on Intensity,” Optics and Spectroscopy, Vol. 101, No. 5, 2006, pp. 811-815. doi:10.1134/S0030400X06110233
- I. M. Bel’dyugin, I. G. Zubarev and S. I. Mikhailov, “Image Restoration of Object on Its Speckle Structure,” Quantum Electronics, Vol. 31, No. 6, 2001, pp. 539-542. doi:10.1070/QE2001v031n06ABEH001997