Open Journal of Biophysics
Vol.2 No.3(2012), Article ID:21416,8 pages DOI:10.4236/ojbiphy.2012.23008
A Low-Memory-Requiring and Fast Approach to Cluster Large-Scale Decoy Protein Structures
1Department of Molecular Medicine, City of Hope National Medical Center and Beckman Research Institute, Duarte, USA
2The School of Mathematics and Statistics, Hebei University of Economics and Business, Shijiazhuang, China
Email: *holi@coh.org, yingzish@qq.com
Received February 24, 2012; revised April 1, 2012; accepted April 12, 2012
Keywords: Protein Structure Predicition; Protein Structure Cluster; Principal Component Analysis; Low-Momery-Requiring Clustering; Ultra-Fast Clustering
ABSTRACT
This work demonstrates the so-called PCAC (Protein principal Component Analysis Clustering) method, which clusters large-scale decoy protein structures in protein structure prediction based on principal component analysis (PCA), is an ultra-fast and low-memory-requiring clustering method. It can be two orders of magnitude faster than the commonlyused pairwise rmsd-clustering (pRMSD) when enormous of decoys are involved. Instead of  least-square fitting of rmsd calculations and N2 memory units to store the pairwise rmsd values in pRMSD, PCAC only requires N rmsd calculations and N × P memory storage, where N is the number of structures to be clustered and P is the number of preserved eigenvectors. Furthermore, PCAC based on the covariance Cartesian matrix generates essentially the identical result as that from the reference rmsd-clustering (rRMSD). From a test of 41 protein decoy sets, when the eigenvectors that contribute a total of 90% eigenvalues are preserved, PCAC method reproduces the results of near-native selections from rRMSD.
1. Introduction
In ab initio protein-structure prediction, usually a large amount of protein conformations (decoys) are generated. Clustering of similar predicted protein structures is a commonly adopted procedure [1-4]. The clustering procedure simplifies data analysis by reducing the enormous number of decoys generated from the large-scale conformational search and provides information of the distribution of the structures in conformational space. In order to compare clustering results from diversed proteins, an adaptive cluster cutoff method is recommended [5] instead of K-means algorithm. The main drawback of K-means clustering [6,7] is that a pre-determined number of clusters is required, which is not suitable for decoy clustering.
Structural clustering (e.g., leader algorithm [8]) is usually based on the pairwise root-mean-squared distance (pRMSD), which is a more accurate similarity measure than other measures, e.g., distance of internal coordinates [9,10]. The pRMSD requires  least-square fitting of rmsd calculations for N structures. It is timeconsuming when a large amount of decoys are involved. Li et al. have developed a fast decoy clustering method (SCUD) that is based on reference root-mean-squared distance (rRMSD), which only requires N rMSD calculations to a reference conformation [11]. A randomly selected reference conformation is used to remove overall translational and rotational motion for all the decoys and rmsd between any two conformations is determined without further reorientation. From a test of 53 decoy sets of or proteins, the near-native selections of rRMSD is similar to that of pRMSD. SCUD is 8 times faster without significant change in the accuracy of near-native selections. However, both pRMSD and rRMSD methods require N2 memory units to store the rmsd values of each pair of structures in order to speed up calculation, which may exceed the computer’s available memory limit when the number of decoys ranges from 104 to 106 [12].
Principal Component Analysis (PCA) is one of the most valuable results from linear algebra. It can be used to reduce the number of variables from a linear Gaussian data set or to classify them [13]. PCA was first introduced to biosystem analysis by Gower in 1966 [14,15]. It has been successfully implemented to describe molecules’ energy landscape [16-18], nonlinear motions in proteins [19-21], as well as many other bioinformatics fields[22-28]. From a sample data set with p variables and N individuals, there are two ways to build the PCA matrix. One method constructs a p × p matrix to measure the discrepancy of the individuals along principal axes in the p-dimensional space. The other method, i.e., principal coordinate analysis, builds a N × N matrix to analyze the similarity of the individuals [14,29]. Normally, a covariance matrix [19] is constructed, since its eigenvalue is the variance of the N individuals along the corresponding eigenvector. The matrix can also be constructed as a distance matrix [29], in which the eigenvalue is not directly related to the variance of the individuals any more. The elements of the matrix can be calculated either from the Cartesian coordinates, internal coordinates (e.g., pair distances between two atoms [30], bond angles or dihedral angles [31]), their derivations [32], or any other reasonable measures [23].
In this study, we describe that a clustering method based on PCA, which is called PCAC (Protein principal Component Analysis Clustering), is also a powerful tool for clustering the predicted protein structures. PCAC clustering based on Cartesian coordinates is identical to rRMSD clustering when all the eigenvectors are preserved. From a test of 41 proteins 5 with 2000 folding decoys each, PCAC results in similar near-native selections as rRMSD method when the eigenvectors (about 17) that contribute a total of 90% eigenvalues are preserved. The method needs only N least-square fitting of rMSD calculations instead of  in pRMSD. Furthermore, other than N2 memory units needed in pRMSD and rRMSD clustering, PCAC requires only N × P memory units to store the preserved eigenvectors, where P is the number of preserved eigenvectors that is usually a fixed number less than 100 and independent to the number of decoys N. Consequently, it can be hundreds of times faster than pRMSD method when a large number of decoys are studied and the computer cannot store the N2 pairwise rmsd values in memory. PCAC may be implemented to cluster other large-scale database as well, e.g., compound library for virtual screening.
2. Methods
2.1. Constructing Covariance Matrix in Cartesian Coordinates
The covariance matrix [13] of C atoms in Cartesian coordinates is used in the PCA calculation. The element σij (covariance of two coordinates) in the 3p × 3p matrix (p number of C atoms in protein that have a total of 3p Cartesian coordinates) is defined as
 (1)
(1)
where N is the number of decoys for a specific protein, l is the decoy index, i and j are the coordinate indices of a total of 3p Cartesian coordinates, and xi and xj are the average of the conformations along ith and jth coordinates, respectively. Before the covariance matrix is constructed, the decoys are translated and rotated to match a reference conformation: thus the rMSD in between the decoy and the reference is minimized. A total of N rMSD calculations is required to remove the overall rotation.
The eigenvalues are sorted in descending order when the covariance matrix is diagonalized. Only the eigenvectors that have significant eigenvalues are preserved for further analysis. We either preserve eigenvectors with the highest eigenvalues, or set an eigenvalue-percentage-cutoff value (the fraction of the preserved eigenvalues over the total eigenvalues) to select the number of preserved eigenvectors.
2.2. PCAC: Clustering in PCA Space
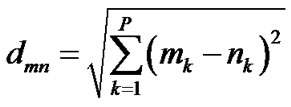
PCAC is based on pairwise distance of decoys in PCA space. The PCA distance, dmn, between structures m and n is defined as
 (2)
(2)
where P is the number of preserved important eigenvectors (P ≤ 3p), and mk and nk are the coordinates of the two decoys projected on the kth eigenvector. During clustering, the projected coordinates of each decoy is stored in N × P memory units.
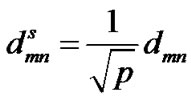
The PCA-distance dmn is normalized to a scaled Cartesian PCA-distance in order to compare it with the rRMSD method
 (3)
(3)
where p is the number of C atoms to build the Cartesian covariance matrix. All the decoys close to each other within a cluster cutoff in PCA space are clustered to one family.
Due to the diversity of protein decoy sets, an adaptive cluster cutoff value is strongly recommended. The cluster cutoff value is calculated when the number of decoys in the top 3 largest clusters includes 5% of the total decoys (T35 value [11]). The top 5 largest clusters are selected as the best prediction for a specific protein and the value of the structure selection listed in tables is the one that has minimum rMSD from native among the 5 selected structures.
3. Discussion
The decoy set to test PCAC method is obtained from the energy-minimization of 41 helical proteins [5]. The number of residues in the proteins ranges from 40 to 124 and the number of helices is from 2 to 6. For each protein, at least 2000 initial structures are produced. The initial structures are constructed with random dihedral angles for the residues in nonhelical regions and native dihedral angles for the residues in helical regions [33,34]. The DFIRE energy function [35], together with improper torsion energy and a simple repulsive potential, are employed to minimize the initial structures in dihedral space to fold the protein. As proved by Equation (5), PCAC generates the exactly same results as rRMSD when all the eigenvalues are preserved, no further decoy sets are needed on test of the new methodology.
3.1. PCA-Distance and rRMSD
The rRMSD value used in SCUD,  , is the directly calculated rMSD of two decoys indexed as m and n when both of conformations minimize their rMSD values to the reference conformation [11],
 (4)
(4)
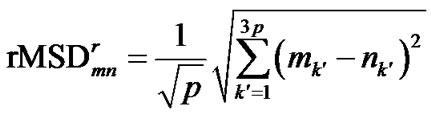
where p is the total number of C atoms involved in calculation, and mk′ and nk′ are the k′th laboratory Cartesian coordinates (after least-square fitting to the reference conformation) of the two decoys.
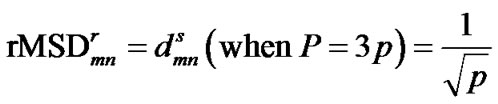
Since the decoy’s coordinates measured in PCA space are the projections of laboratory coordinates on the PCA eigenvectors, the Cartesian distance of any two C atoms remains constant in both laboratory coordinates and PCA coordinates. Thus, from Equations (2)-(4), we have,
 (5)
(5)
Apparently, from the above equation, we can see that the rRMSD value is identical to the scaled PCA-distance when all the eigenvectors resulted from PCA are considered.
3.2. Cluster Cutoff
Normally a pre-determined cutoff value is selected to cluster the structures. However, it is difficult to set one cutoff value for the diverse proteins because this will lead to too few clusters for some proteins and too many clusters for the others [5,36].
Figure 1 depicts the effect of cluster cutoff on the fraction of the number of clusters produced and the number of decoys included in the top 3 largest clusters. We can see that the fraction of the number of clusters strongly depends on the number of decoys, whereas the fraction of the number of decoys included in the top 3 largest clusters is independent. A well-defined cluster cutoff value should be constant as the number of ana-
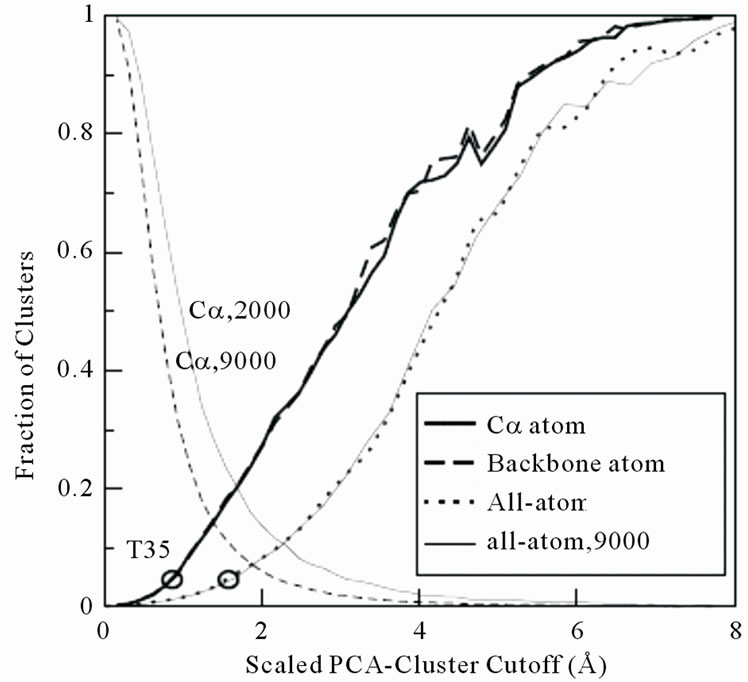
Figure 1. The fraction of decoys in the top 3 largest clusters (two lines end at right-top corner) and number of clusters (two lines start at left-top corner) over the total number of decoys as a function of PCA cluster cutoff value from 1GAB10-51 decoy set (scaled by Equation (3)). The eigenvalue-percentage-cutoff is 70%. The solid lines are from 2000 decoys, whereas the dashed lines are from 9000 decoys. The circle at the left-bottom corner of the figure illustrates the selected cluster cutoff T35 value (see text for detail).
lyzed decoys varies. Hence, we select the cluster cutoff as T35 value, i.e. the number of decoys in the top 3 largest clusters accounts for 5% of the total decoys. T35 value is selected as cluster cutoff based on the fact that a statistically significant amount of decoys are included in the top largest cluster (over 40 for a 2000 decoy set), meanwhile, most of the diverse decoys (about 50%) are conserved. Li et al. have tested the effect of using different cutoffs as 1%, 3%, 5%, 10%, 15% and 20% of all decoy structures contained in top three clusters [11]. It shows that a cutoff between 3% to 5% produces the best near-native selections.
3.3. Eigenvectors to Be Preserved
Only the eigenvectors with highest eigenvalues contribute significantly to determining structure similarity in PCA. The eigenvalue distribution of protein 1GAB10-51 is illustrated in Figure 2. The top 5 and 10 eigenvectors from 1GAB10-51 contain 70% and 85% of the eigenvalues, respectively. We can also see that the curves from 2000 and 9000 decoys are almost identical, implying the eigenvalue distribution is independent to the number of decoys.
As listed in Table 1, the near-native selection result improves steadily as the eigenvalue-percentage-cutoff increases, up to 95%. The 90% eigenvalue-percentage-cutoff value can be sufficient to generate near-native prediction similar to rRMSD, which preserves only 17 eigenvectors on average. Table 2 compares the best structure selection of 41 proteins from rRMSD and PCAC at 90% eigenvalue-percentage-cutoff. The average nearnative selection of top 5 clusters from PCAC is 6.0 Å, which is very close to the 5.9 Å value from rRMSD method. At 99% eigenvalue-percentage-cutoff (on average 51 eigenvetors are preserved), the average near-native selections from the two methods are identical.
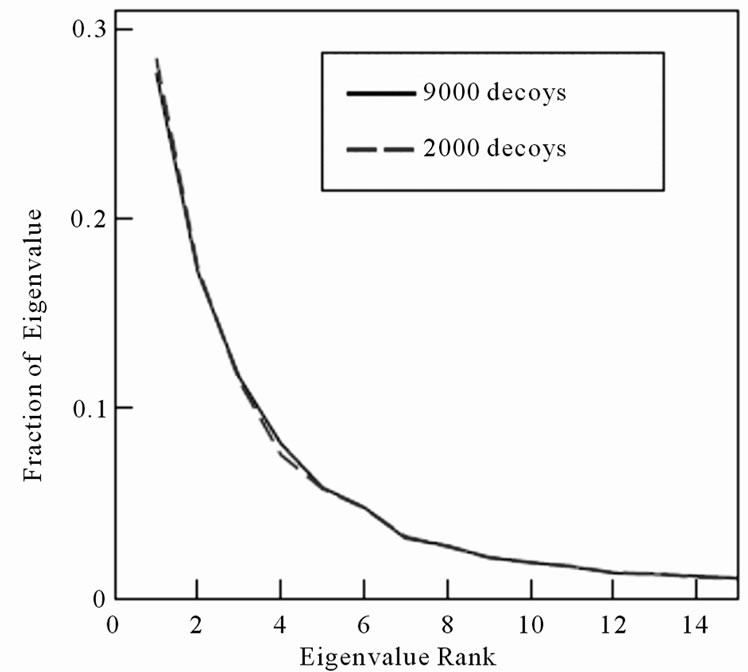
Figure 2. The eigenvalue distribution of protein 1GAB10-51. The solid line and dashed line represent the distribution from 2000 and 9000 decoys, respectively.
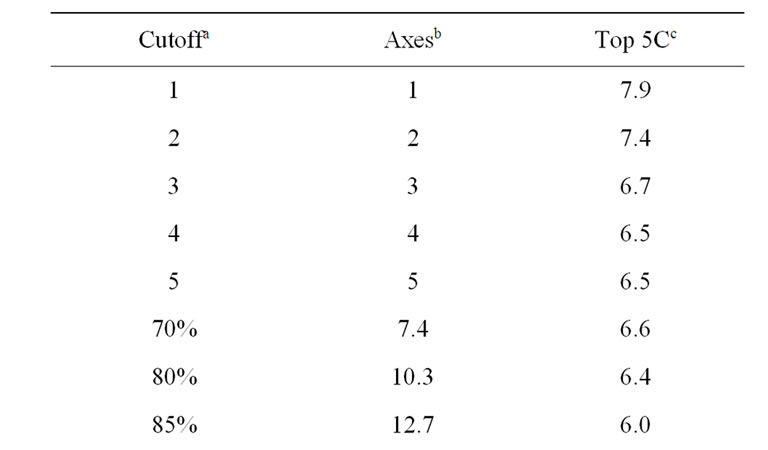
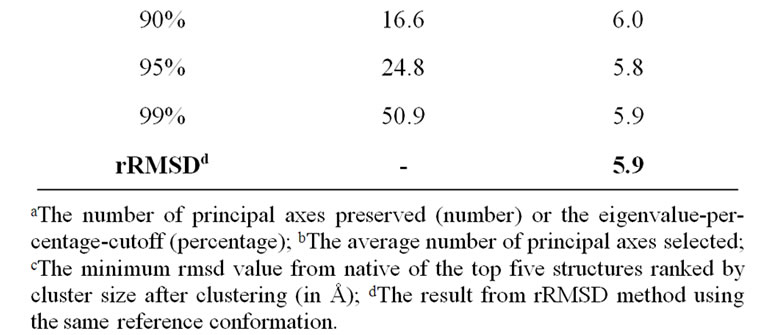
Table 1. Average structure selections of 41 proteins using different numbers of principal axes.

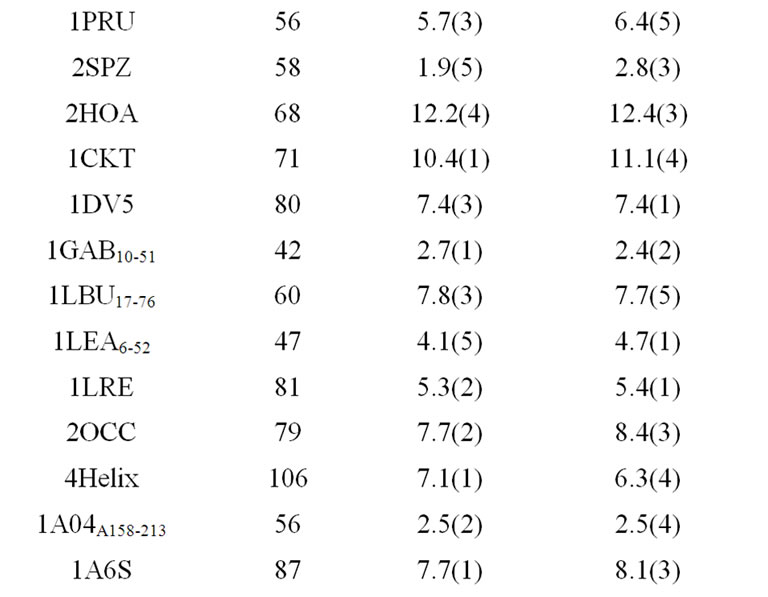
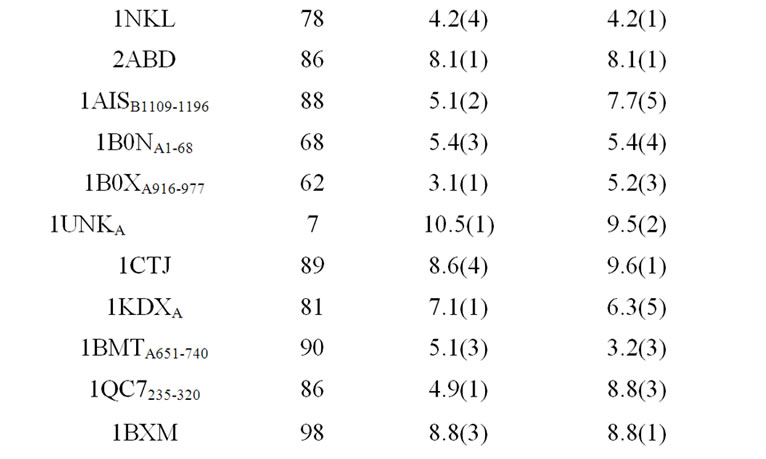
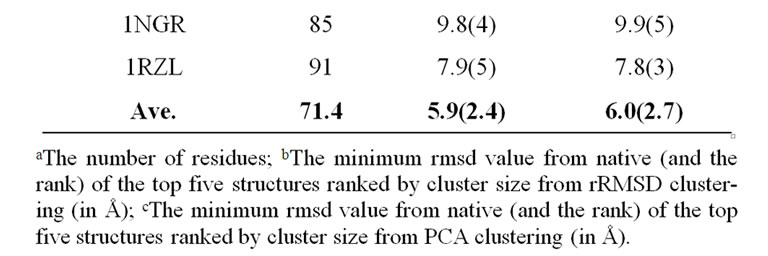
Table 2. Structure selections of 41 proteins from rRMSD method and PCA-clustering.
PCAC method is a sufficient method to cluster structures as rRMSD is further displayed in Figure 3. The figure shows the relationship of the scaled PCA-distance and the least-square fitting rMSD value of protein 1GAB10-51 at different eigenvalue-percentage-cutoffs. The correlation coefficient increases from 0.88 to 0.99 at 47% and 99% eigenvalue-percentage-cutoffs. As the scaled PCA-distances at 99% eigenvalue-percentage-cutoff are almost identical to the rmsd values within the cluster cutoff region, the clustering results from the two methods are expected to be almost identical as well.
3.4. Choose the Reference Conformation
Results from principal component analysis can be af-
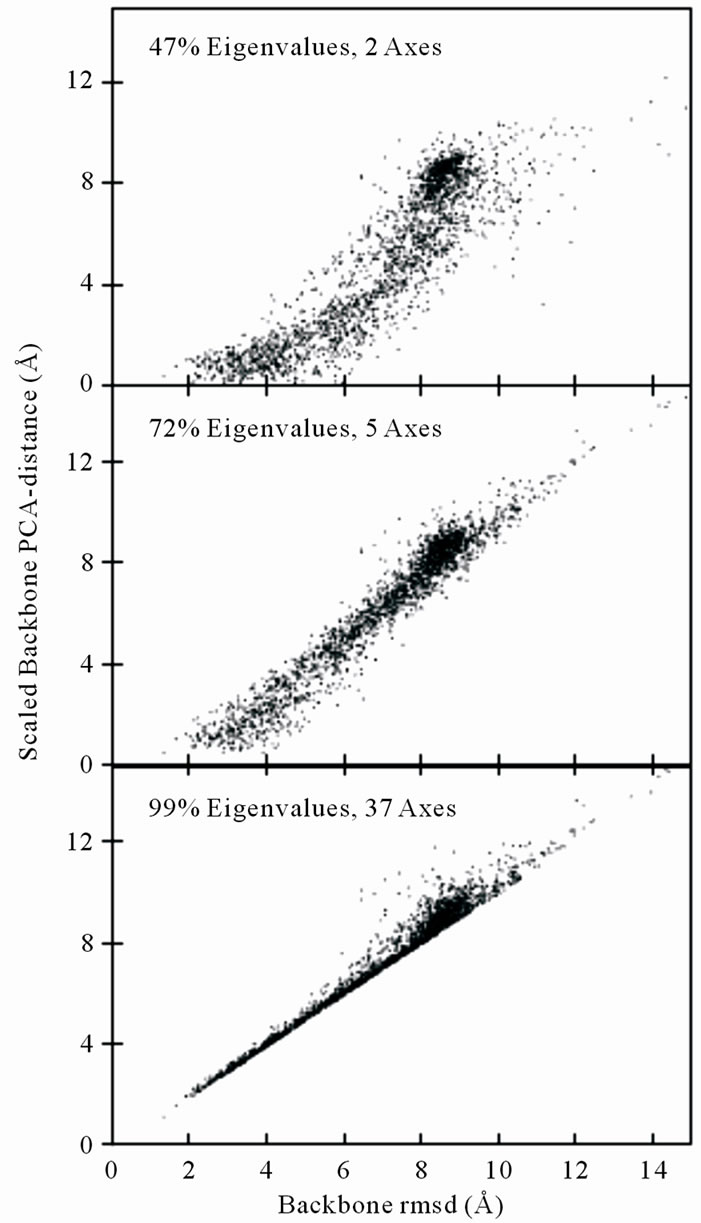
Figure 3. Backbone rmsd from the structure in largest cluster of 2000 1GAB10-51 decoys vs the scaled backbone PCA-distance to that structure at different eigenvalue-percentage-cutoff values. The PCA reference conformation is the random-selected energy-minimized structure. The eigenvalue-overall-cutoff values are of 47% (2 most important principal axes are calculated from a total of 126 axes), 72% (5 axes) and 99% (37 axes) for the three plots, respectively.
fected by the selection of the reference structures [37]. As shown in Table 3, the near-native selection result from using native as reference is artificially enhanced. We must avoid selecting the native as a reference conformation in PCAC. However, it is shown that the average near-native selection result is not sensitive to a randomly selected structure, even if the unfolded initial structure is picked as reference [5]. As listed in Table 3, we tested using 3 randomly selected energy-minimized structures (on average 10 Å rMSD from native) and 2 initial unfolded structures (16 Å from native) as reference states. The resulting near-native selections are similar. Therefore, in terms of near-native structure selections, using any structure that is not close (within the cluster cutoff) to the native (and/or close to any of the top 5 clusters) can produce similar and unbiased results.
3.5. An Ultra-Fast Method
As discussed above, PCAC from covariance matrix in Cartesian coordinates produces essentially the same result as the rRMSD method. Moreover, PCAC can be hundreds of times faster when thousands or more decoys are calculated. The pairwise rmsd clustering requires  calculations of pairwise least-square fitting rmsd values. We also need N2 memory units to store the resulting rmsd values, which can easily surpass computer memory when tens of thousands of decoys are included. For example, upto 1,000,000 loop decoys were generated by Jacobson et al. [12]. On the other hand, PCAC only needs N least-square fitting rmsd calculations and N × P memory units to store the preserved P eigenvectors.
The overhead of PCAC method is the PCA calculation, which includes constructing the covariance matrix (needs one round calculation of N least-square fittings to the reference conformation), diagonalizing the matrix, and
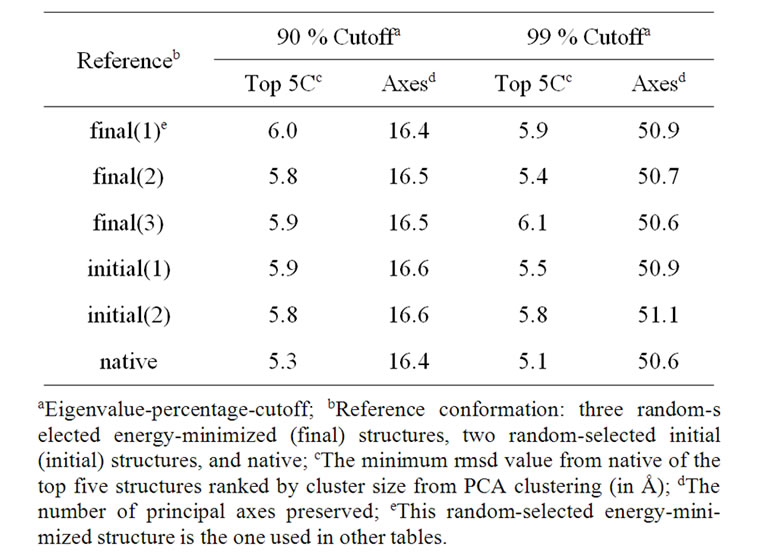
Table 3. Average structure selections of 41 proteins using different reference conformations.
projecting the structures on the preserved eigenvectors.
In the test of clustering on 9000 1GAB10-51 decoys, 324 Mb memory storage is needed for the pairwise rMSD values (each rMSD value occupies 4 bytes storage as a real number). If the required memory storage can not be satisfied, each pair of rMSD values must be recalculated when needed. The computing time for traditional pRMSD method to cluster the 9000 decoy set is 53,500 seconds (including a total of 10 rounds of clustering to search the cluster cutoff T35 value). For PCAC, less than 1 Mb memory storage is required for the clustering of 9000 decoys at 90% eigenvalue-percentage-cutoff. It takes a total of 274 seconds, which includes 102 seconds for PCA calculation and 172 seconds for clustering. PCAC method is almost 200 times faster than pRMSD method when the computer memory can not hold N2 real numbers.
The more decoys analyzed, the faster PCAC method becomes, since the fraction of the overhead PCA calculation drops accordingly. Because the eigenvalue distribution is almost independent to the number of decoys (shown in Figure 2), another way to speed up PCA calculation is analyzing only a small number of decoys (e.g., 2000) to calculate the PCA matrix and implementing the obtained eigenvectors to a large number of decoys. Consequently, the overhead of PCA calculation can be further reduced.
4. Conclusion
This work demonstrates that PCAC is an extremely fast and low-memory-requiring algorithm to cluster largescale predicted protein structures. PCAC method can be over 100 times faster than pairwise-rMSD clustering method. The computer memory requirement also drops from O(N2) to O(N), where N is the size of the dataset. PCAC algorithm may be implemented to cluster other large-scale bioinformatics dataset as well when the dataset can be effectively described in PCA space.
5. Acknowledgements
We thank Ms. Sue Hargrave for proof reading. HL appreciates Dr. Yaoqi Zhou for his deep discussion on this work.
REFERENCES
- O. M. Becker, “Geometric versus Topological Clustering: An Insight into Conformation Mapping,” Proteins: Structure, Function, and Bioinformatics, Vol. 27, No. 2, 1997, pp. 213-226. doi:10.1002/(SICI)1097-0134(199702)27:2<213::AID-PROT8>3.0.CO;2-G
- D. Shortle, K. T. Simons and D. Baker, “Clustering of Low-Energy Conformations near the Native Structures of Small Proteins,” Proceedings of the National Academy Sciences of the USA, Vol. 95, No. 19, 1998, pp. 11158- 11162. doi:10.1073/pnas.95.19.11158
- M. R. Betancourt and J. Skolnick, “Finding the Needle in a Haystack: Educing Native Folds from Ambiguous Ab initio Protein Structure Predictions,” Journal of Computational Chemistry, Vol. 22, No. 3, 2001, pp. 339-353. doi:10.1002/1096-987X(200102)22:3<339::AID-JCC1006>3.0.CO;2-R
- J. B. Holmes and J. Tsai, “Some Fundamental Aspects of Building Protein Structures from Fragment Libraries,” Protein Science, Vol. 13, No. 6, 2004, pp. 1636-1650. doi:10.1110/ps.03494504
- H. Li and Y. Zhou, “Fold Helical Proteins by Energy Minimization in Dihedral Space and a Dfire-Based Statistical Energy Function,” Journal of Bioinformatics and Computational Biology, Vol. 3, No. 5, 2005, pp. 1151- 1170. doi:10.1142/S0219720005001430
- J. Fetrow, M. Palumbo and G. Berg, “Patterns, Structures, and Amino Acid Frequencies in Structural Building Blocks, a Protein Secondary Structure Classification Scheme,” Proteins, Vol. 27, No. 2, 1997, pp. 249-271. doi:10.1002/(SICI)1097-0134(199702)27:2<249::AID-PROT11>3.3.CO;2-X
- O. Sander, I. Sommer and T. Lengauer, “Local Protein Structure Prediction Using Discriminative Models,” BMC Bioinformatics, Vol. 7, 2006, p. 14. doi:10.1186/1471-2105-7-14
- J. Hartigan, “Clustering Algorithms,” John Wiley & Sons, New York, 1975.
- M. J. Rooman, J. Rodriguez and S. J. Wodak, “Automatic Definition of Recurrent Local Structure Motifs in Proteins,” Journal of Molecular Biology, Vol. 213, No. 2, 1990, pp. 327-336. doi:10.1016/S0022-2836(05)80194-9
- F. Cohen and M. Sternberg, “On the Prediction of Protein Structure: The Significance of the Root-Mean-Square Deviation,” Journal of Molecular Biology, Vol. 138, No. 2, 1980, pp. 321-333. doi:10.1016/0022-2836(80)90289-2
- H. Li and Y. Zhou, “Scud: Fast Structure Clustering of Decoys Using Reference State to Remove Overall Rotation,” Journal of Computional Chemistry, Vol. 26, No. 11, 2005, pp. 1189-1192. doi:10.1002/jcc.20251
- M. P. Jacobson, D. L. Pincus, C. S. Rapp, T. J. F. Day, B. Honig, D. E. Shaw and R. A. Friesner, “A Hierarchical Approach to All-Atom Protein Loop Prediction,” Proteins: Structure, Function, and Bioinformatics, Vol. 55, No. 2, 2004, pp. 351-367. doi:10.1002/prot.10613
- L. David, “Linear Algebra and Its Applications,” 3rd Edition, Addison-Wesley, New York, 2002.
- J. C. Gower, “Some Distance Properties of Latent Root and Vector Methods Used in Multivarient Analysis,” Biometrika, Vol. 53, No. 3-4, 1966, pp. 325-338. doi:10.1093/biomet/53.3-4.325
- J. C. Gower, “Adding a Point to Vector Diagrams in Multivariate Analysis,” Biometrika, Vol. 55, No. 3, 1968, pp. 582-585. doi:10.1093/biomet/55.3.582
- K. D. Ball, R. S. Berry, R. E. Kunz, F. Y. Li, A. Proykova and D. J. Wales, “From Topographies to Dynamics on Multidimensional Potential Energy Surfaces,” Science, Vol. 271, No. 5251, 1996, pp. 963-965. doi:10.1126/science.271.5251.963
- J. N. Onuchic, Z. L. Schulten and P. G. Wolynes, “Theory of Protein Folding: The Energy Landscape Perspective,” Annual Reviews of Physical Chemistry, Vol. 48, 1997, pp. 545-600. doi:10.1146/annurev.physchem.48.1.545
- N. Kamiya, J. Higo and H. Nakamura, “Conformational Transition States of a β-Hairpin Peptide between the Ordered and Disordered Conformations in Explicit Water,” Protein Science, Vol. 11, No. 10, 2002, pp. 2297-2307. doi:10.1110/ps.0213102
- T. Ichiye and M. Karplus, “Collective Motions in Proteins: A Covariance Analysis of Atomic Fluctuations in Molecular Dynamics and Normal Mode Simulations,” Proteins: Structure, Function, and Bioinformatics, Vol. 11, No. 3, 1991, pp. 205-217. doi:10.1002/prot.340110305
- A. E. Garcia, “Large-Amplitude Nonlinear Motions in Proteins,” Physical Review Letters, Vol. 68, No. 17, 1992, pp. 2696-2699. doi:10.1103/PhysRevLett.68.2696
- U. Schieborr and H. Ruterjans, “Bias-Free Separation of Internal and Overall Motion of Biomolecules,” Proteins: Structure, Function, and Bioinformatics, Vol. 45, No. 3, 2001, pp. 207-218. doi:10.1002/prot.1141
- N. Kannan and S. Vishveshwara, “Identification of SideChain Clusters in Protein Structures by a Graph Spectral Method,” Journal of Molecular Biology, Vol. 292, No. 2, 1999, pp. 441-464. doi:10.1006/jmbi.1999.3058
- P. Koehl and M. Levitt, “Improved Recognition of Native-Like Protein Structures Using a Family of Designed Sequences,” Proceedings of National Academy Sciences of USA, Vol. 99, No. 2, 2002, pp. 691-696. doi:10.1073/pnas.022408799
- E. G. Emberly, R. Mukhopadhyay, N. S. Wingreen and C. Tang, “Flexibility of α-Helices: Results of a Statistical Analysis of Database Protein Structures,” Journal of Molecular Biology, Vol. 327, No. 1, 2003, pp. 229-237. doi:10.1016/S0022-2836(03)00097-4
- J. C. Liao, R. Boscolo, Y.-L. Yang, L. M. Tran, C. Sabatti and V. Roychowdhury, “Network Component Analysis: Reconstruction of Regulatory Signals in Biological Systems,” Proceedings of National Academy Sciences of USA, Vol. 100, No. 26, 2003, pp. 15522-15527. doi:10.1073/pnas.2136632100
- U. Bastolla, M. Porto, H. E. Roman and M. Vendruscolo, “Principal Eigenvector of Contact Matrices and Hydrophobicity Profiles in Proteins,” Proteins: Structure, Function, and Bioinformatics, Vol. 58, 2005, pp. 22-30.
- K. Ikeda, T. Hirokawa, J. Higo and K. Tomii, “ProteinSegment Universe Exhibiting Transitions at Intermediate Segment Length in Conformational Subspaces,” BMC Structural Biology, Vol. 8, 2008, pp. 37-54. doi:10.1186/1472-6807-8-37
- H. Shen, F. Xu, H. Hu, F. Wang, Q. Wu, Q. Huang and H. Wang, “Coevolving Residues of (β/α)8-Barrel Proteins Play Roles in Stabilizing Active Site Architecture and Coordinating Protein Dynamics,” Journal of Structural Biology, Vol. 164, No. 3, 2008, pp. 281-292. doi:10.1016/j.jsb.2008.09.003
- N. Elmaci and R. S. Berry, “Principal Coordinate Analysis on a Protein Model,” Journal of Chemical Physics, Vol. 110, No. 21, 1999, pp. 10606-10622. doi:10.1063/1.478992
- R. Abseher and M. Nilges, “Are There Non-Trival Dynamics Cross-Correlations in Proteins?” Journal of Molecular Biology, Vol. 279, No. 4, 1998, pp. 911-920. doi:10.1006/jmbi.1998.1807
- D. M. F. V. Aalten, B. L. D. Groot, J. B. C. Findlay, H. J. C. Berendsen and A. Amadei, “A Comparision of Techniques for Calculating Protein Essential Dynamics,” Journal of Computional Chemistry, Vol. 18, No. 2, 1997, pp. 169-181. doi:10.1002/(SICI)1096-987X(19970130)18:2<169::AID-JCC3>3.0.CO;2-T
- Y. Mu, P. H. Nguyen and G. Stock, “Energy Landscape of a Small Peptide Revealed by Dihedral Angle Principal Component Analysis,” Proteins: Structure, Function, and Bioinformatics, Vol. 58, No. 1, 2005, pp. 45-52. doi:10.1002/prot.20310
- M. Nanias, M. Chinchio, J. Pillardy, D. R. Ripoll and H. A. Scheraga, “Packing Helices in Proteins by Global Optimization of a Potential Energy Function,” Proceedings of National Academy of Sciences of the USA, Vol. 100, No. 4, 2003, pp. 1706-1710. doi:10.1073/pnas.252760199
- C. Zhang, J. Hou and S. H. Kim, “Fold Prediction of Helical Proteins Using Torsion Angle Dynamics and Predicted Restraints,” Proceedings of National Academy of Sciences of the USA, Vol. 99, No. 6, 2002, pp. 3581-3585. doi:10.1073/pnas.052003799
- H. Zhou and Y. Zhou, “Distance-Scaled, Finite Ideal-Gas Reference State Improves Structure-Derived Potentials of Mean Force for Structure Selection and Stability Prediction,” Protein Science, Vol. 12, No. 9, 2003, p. 2121. doi:10.1002/pro.122121
- Y. Zhang and J. Skolnick, “Spicker: A Clustering Approach to Identify Near-Native Protein Folds,” Journal of Computional Chemistry, Vol. 25, No. 6, 2004, pp. 865- 871. doi:10.1002/jcc.20011
- J. J. Prompers and R. Bruschweiler, “Dynamic and Structural Analysis of Isotropically Distributed Molecular Ensembles,” Proteins: Structure, Function, and Bioinformatics, Vol. 46, No. 2, 2002, pp. 177-189. doi:10.1002/prot.10025
NOTES
*Corresponding author.