Open Journal of Organic Polymer Materials
Vol.2 No.2(2012), Article ID:18681,10 pages DOI:10.4236/ojopm.2012.22003
Oxidation, Chain Scission and Cross-Linking Studies of Polysiloxanes upon Ageings
1Clermont Université, Université Blaise Pascal, LPMM, UMR CNRS 6505, Clermont-Ferrand, France
2Clermont Université, ENSCCF-LPMM, Clermont-Ferrand, France
Email: *florence.delor_jestin@ensccf.fr
Received February 29, 2012; revised March 28, 2012; accepted April 1, 2012
Keywords: Polysiloxane; Degradation; Thermal Properties; Cross-Linking; Cristallinity
ABSTRACT
The comparison between physical properties and chemical structures of several polysiloxanes was studied at initial state and upon ageings. Techniques such as densimetry, gel permeation chromatography, FTIR spectroscopy, thermogravimetric analysis coupled with IR spectroscopy and the new tool photo-DSC were used to give assessments of average molecular weight, chemical evolution, cristallinity and thermal stability. Different types of ageing such as thermal ageing (60˚C and 100˚C), photo-ageing and acid vapour ageing were performed. After ageing we observed an evolution of chemical structures and physical properties for all samples. The main pathway of degradation is given for each sample. It results in oxidation, chain scission or cross-linking. Cross-linking levels are dependant on the type of ageing, the chemical structure and the initial rate of cristallinity. Cross-linking reactions are favoured after photo-ageing. Oxidation is higher for polysiloxane with aliphatic carbon chain.
1. Introduction
Polysiloxanes are often used as protective coatings for a variety of specialized applications. The resistance at high temperatures to oxidation of the silicone backbone surpasses that of most dienic elastomers. However degradative processes appear when used for long term in outdoor conditions hence, it is important to identify the principal factors involved, so that degradation prevention can be applied.
The photochemical behaviour of polydimethylsiloxane (PDMS) oil has been examined previously [1-4]. Y. Israeli et al. have focussed in particular on the photoreactivity of the main substituent groups used in the silicone field. Photo-oxidations of PDMS oil with various content of hydride SiH, vinyl (in the polymer chain or at the end of the chain), dimethylene -CH2-CH2-, methine -CHCH3-, MePh and Ph2 groups have been studied. In the case of SiH-silicone, hydroperoxides are primarily formed and result from radical attack on the Si-H bonds. These unstable hydroperoxides are transformed essentially into silanols. SiH-PDMS is rather unstable in comparison with PDMS. The behaviour of SiH-PDMS depends weakly on the SiH content but strongly on the position on the SiH group. When SiH groups are located at the end of the chain, the oxidation rate is fairly high probably because of good accessibility of the reactive groups [1]. In the case of vinyl-PDMS the oxidation rates are lower than those observed in the case of SiH-PDMS [2]. Chain scission and direct oxidation of the vinyl group lead to a very complex mixture of photoproducts. The scission of Sivinyl bond seems to be the main reaction. PDMS formed by hydrosilylation reactions containing dimethylene and methine groups [2] have similar oxidation rates of vinylPDMS. Thermal stability up to 200˚C - 250˚C can be further improved by the substitution of methyl groups by phenyl groups [4]. The estimation of cross-linking of crude silicone (i.e. without cross-linking agent) upon photoageing was also investigated with techniques such as densimetry and hardness measurements [5]. The stability towards oxidation was confirmed and unexpected facility to cross-link upon ageing was detected.
N. Grassie et al. have reported on the thermal stability of PDMS to 300˚C under vacuum [6]. G. Deshpande and M. E. Rezac have shown that the decomposition products of vinyl terminated PDMS after inert atmosphere thermal degradation at 364˚C were principally the cyclic oligomers hexamethyltrisiloxane and octamethyltetrasiloxane. The degradation of polydimethyldiphenyl siloxane resulted in the same conditions in the evolution of benzene in the initial stages of the reaction [7]. A kinetic study was proposed on the same materials by thermogravimetric analysis from 300˚C to 925˚C [8]. Thermal degradation of PDMS have also been studied by G. Camino et al. [9,10]. Thermal oxidative degradation in the presence of air gives results much different from the decomposition in nitrogen. Kinetic treatment shows that PDMS thermal volatilization, as rate of heating increases, becomes dominated by rate of diffusion and evaporation of oligomers produced on its decomposition [9]. The products of the thermal degradation are essentially determined by the temperature and the heating rate [10]. The increase in molecular weight upon γ-radiolysis of polydimethylsiloxane with Gel Permeation Chromatography has been reported by Hill et al. [11]. They observed that the total yields for cross-linking predominates over those for scission at all temperatures for radiolysis under vacuum. When radiolysis was carried out in air at 303K cross-linking was predominant but the nett yield of crosslinking was much less than that observed for radiolysis under vacuum. T. Howard Thomas et al. have studied the molecular weight and molecular weight distribution changes taking place during isothermal depolymerization of PDMS [12]. The residue left upon thermal deploymerization had lower molecular weight due to formation of cyclic dimethylsiloxanes and a broader molecular weight distribution as compared to the initial material. Hydroxy end blocked PDMS upon isothermal investigation below the depolymerization temperature have shown an increase in molecular weight due to intermolecular condensation of terminal hydroxy groups leading to crosslinking. Similar studies on molecular weight changes in model linear PDMS at 200˚C in air were minimal upto 310 hours of oxidation, while a significant increase in Mw was measured after 1760 hours [13].
There are few papers in the literature for the properties of crude polysiloxanes (without silica and any additives, uncross-linked). We have focussed our study on several crude polysiloxanes (polydimethylsiloxane with different terminal group, polymethylocta-decylsiloxane and polymethyltetradecylsiloxane) to have a better understanding of structure-property relationships upon ageing. The behaviour under ageings of PMOS and PMTS was not reported previously. We have compared the thermal properties of the different polysiloxanes and the volatile products emitted during thermal degradation. We have given new results on the long term behaviour of these specific elastomers. By using photo-DSC (Differential Scanning Calorimetry) a new technique which allows to measure in-situ the changes in thermal transitions taking place upon photo-ageing in DSC furnace, we report on the crystallization behaviour of polysiloxanes. Complementary approach of DSC, TGA and GPC is discussed. We’ll propose chemical structures and physical properties relationships for polysiloxanes at the initial state and upon ageings.
2. Experimental
2.1. Materials
All polysiloxanes used for this study were provided by SP2 (Scientific Polymer Products). The differences and the initial characterization of seven polysiloxanes are shown in Table 1. Most of samples are PDMS hydroxy or acetoxy terminated. Molecular weights (Mw) were in the range between 9400 and 115,000 g/mol. Two samples PMOS (polymethyloctadecylsiloxane) and PMTS (polymethyltetradecylsiloxane) were chosen for their specific chemical structure.
2.2. Ageings
An accelerated photoageing is carried out using the irradiation device (SEPAP 12/24-ATLAS). The system is characterised by the source, medium pressure Hg lamps filtered with borosilicate envelope (λ > 300 nm) and by careful control of the temperature with a thermocouple in close contact with one of the samples.
Samples are rotated at a constant distance (20 cm) from the sources. The samples were irradiated at 60˚C in a SEPAP chamber equipped with four lamps. Polysiloxanes were mainly liquids and irradiated in small glass tubes. We used an aerated oven (MEMMERT) for thermal exposure at 60˚C or 100˚C. We finally used dessicators to carry out polluted ageings, such as nitric acid vapours or sulphuric acid vapours at room temperature. The photo-DSC system was also used for direct in-situ irradiation (see 2-3). Sulphuric acid (95%), nitric acids (68%) were products purchased from Prolabo (VWR).

Table 1. Analytical data for polysiloxanes, given by SP2.
2.3. Analytical Tools
The chemical changes upon irradiation were followed by FTIR-ATR (Attenuated Total Reflectance) spectroscopy with a Nicolet Impact 400 system. A Thunderdome accessory with germanium crystal was used. We analyze the surface of polysiloxanes upto a few micrometers.
The soluble fraction of crude silicone has been characterised by densimetry. Density measurements were done with an accurate vibrating densimeter tube (Anton Paar DMA 58, accuracy better than 0.00001 g/cm3). Solutions of crude silicone rubber formulation (before and after irradiation) were prepared in cyclohexane with the same ratio mass of polymer/ solvent volume and hermetically sealed during 48 hours (material amount 0.165 g in 5 ml of cyclohexane). After this equilibrium period two milliliters solution was taken from the liquid phase which represents the sol fraction and analysed at 20˚C.
Gel Permeation Chromatography or Size Exclusion Chromatography measurements were carried out using a Viscotek instrument having universal calibration. Two types of detectors were used a viscosimetric detector and a refractive index detector. The mobile phase used was HPLC grade toluene with a flow rate of 1 ml/min and separation was achieved using a GMHxl column. The calibration curve was obtained using polystyrene standards. Solutions were filtered through 0.2 µm filters before being injected into the column.
TGA-FTIR (Mettler Toledo TGA/SDTA851-Nicolet Nexus) was used to study the thermal stability of the materials. The gases coming from TGA are transfered through a heating tube in a gas cell and characterized by FTIR spectroscopy. The temperature programme was a dynamic segment from 25˚C to 700˚C at the rate of 20˚C/minute under oxygen (40 ml/min). The IR experiments were done every minute during the entire thermogravimetric program.
Photo-DSC was then used to characterize the evolution of crystallinity during ageing. A Mettler Toledo DSC822 apparatus, equipped with an Intracooler and a liquid nitrogen cooling set was used. It allows working between 500˚C and –150˚C with a scanning temperature rate from 0.1˚C/h to 50˚C/min. Indium (156.61˚C), zinc (419.58˚C) and heptane (–90.61˚C) were used to calibrate this apparatus. A Hamamatsu light generator equipped with a “Lightningcure LC6” source (Xe/Hg, “medium pressure”) was affixed to the DSC device, described in another paper [14]. The light generator is controlled by the DSC software (STARe) which permits a choice of both the light intensity from 0 to 324 mW/cm2 and the duration of the irradiation. Two identical fiber bundles supply the irradiation light both to sample and reference DSC pans. The source is filtered by sapphire disks to deliver wavelenghts longer than 300 nm, which is representive of outdoor ageing. The different intensities tested were: 16, 31, 68 and 146 mW/cm2. The enthalpies of fusion ΔHth reported in the literature for crystalline linear PDMS are in the range 30 - 36 J·g–1 [15].
3. Results
3.1. FTIR Spectroscopy Results
FTIR-ATR spectroscopy was used to compare polysiloxane and to detect their resistance towards oxidation. The different spectra obtained upon accelerated artificial photo-ageing or thermal ageing are quite similar to the initial spectrum (for unaged sample) even for long time exposure till 10,000 hours in oven or irradiation device. No significant oxidative products can be detected for samples S1, S2, S3, S4 and S5, which are PDMS, see “Figure 1”. The spectra of PMOS (S6) and PMTS (S7) are quite different. The presence of aliphatic carbon chain is clearly detected with specific bands at 2960, 2830 and 1470 cm–1. Oxidation products for S6 and S7 in the carbonyl absorption area were detected after thermal or photochemical ageing. Figures 2(a) and (b) give the detailed results for S6 and S7. The two samples showed very similar IR changes which can be summarized as follows: the formation of two distinct absorption bands at 1710 and 1735 cm–1, which could be mainly assigned to carboxylic acid and ketones. The chemical structure of S6 and S7 allows having a specific behaviour towards ageing and specific properties. The pendant carbon chain on these polysiloxanes reacted like a polyethylene. A comparison of thermo-oxidation kinetics (Figure 2(c)) gives an induction period for S6 and S7 45 hours and 75 hours respectively at 100˚C. No oxidation is detected for upto 400 hours after low temperature thermal ageing (60˚C) and also after photo-ageing (SEPAP) for both S6 and S7. The resistance to oxidation of S6 and S7 upon photo-ageing is high. The difference of induction period for thermal exposure at 100˚C and photo-ageing is quite surprising as compared with polyolefins.
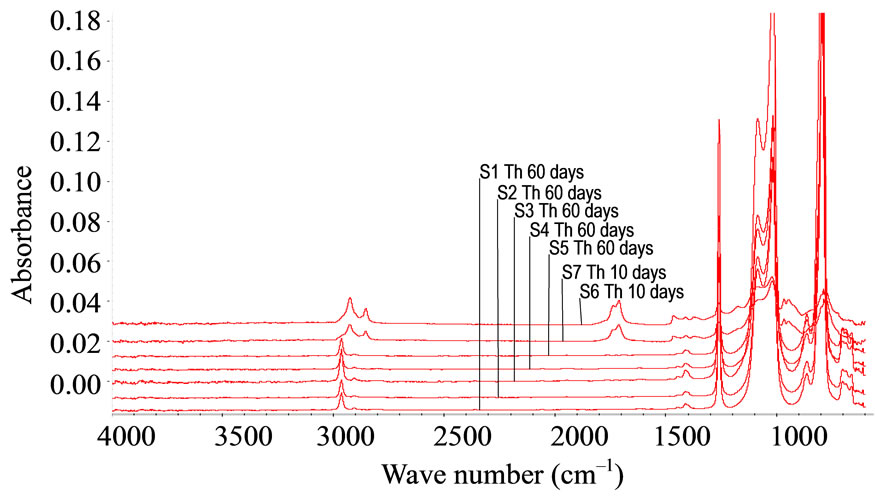
Figure 1. FTIR-ATR spectra for references (S1-S7) after thermal ageing at 100˚C.
 (a)
(a) (b)
(b) (c)
(c)
Figure 2. FTIR-ATR spectra upon thermo-oxidation at 100˚C, (a) Carbonyl absorption area for S6; (b) Carbonyl absorption area for S7 (times: T = 0, 50 hrs, 100 hrs, 150 hrs, 200 hrs, 250 hrs, 300 hrs, 350 hrs); (c) Thermo-oxidation kinetics for S6 and S7.
The behaviour of S6 and S7 was again different under nitric acid vapours. Figure 3 shows the specific results for S6. The appearance of several bands at 1540 and 1650 cm-1 is clearly detected and due to nitration products. There was no oxidation after sulphuric acid vapour exposure. Vapour pressure of nitric acid is 8 mm of Hg at 20˚C while the vapour pressure of sulphuric acid is 1 mm of Hg at 145˚C only. This difference of vapour pressure is probably the reason for the samples reacting easily with nitric acid, as compared with sulphuric acid.
It has been already shown that crude PDMS with alkyl end-groups was not oxidized after photochemical [1-4] thermal ageing or acid treatment (nitric or sulphuric) [16]. We showed that the results were identical for S1, S2, S3, S4 and S5 with other terminal groups. This means that the terminal chain (alkyl, hydroxy, acetoxy or methyldiacetoxy) on PDMS does not affect the unability to oxidize.
3.2. Density Measurements
The densimetry was then used to follow the eventual gel formation. The crude polymer is at the beginning completely soluble in cyclohexane, density is then maximum before irradiation. After a few hours of irradiation we observed the formation of a gel insoluble in cyclohexane. By measuring the density loss of the soluble part in cyclohexane we can follow the branching of silicone formulation particularly before the gel point. Reproducible measurements were made in each case. Figure 4 represents the estimation of density for S3 after photochemical, thermal ageing and acid treatment. The three curves obtained are rather similar and show a rapid decrease of density during the first hours of exposure. No induction period was observed. Similar results were observed for all PDMS.
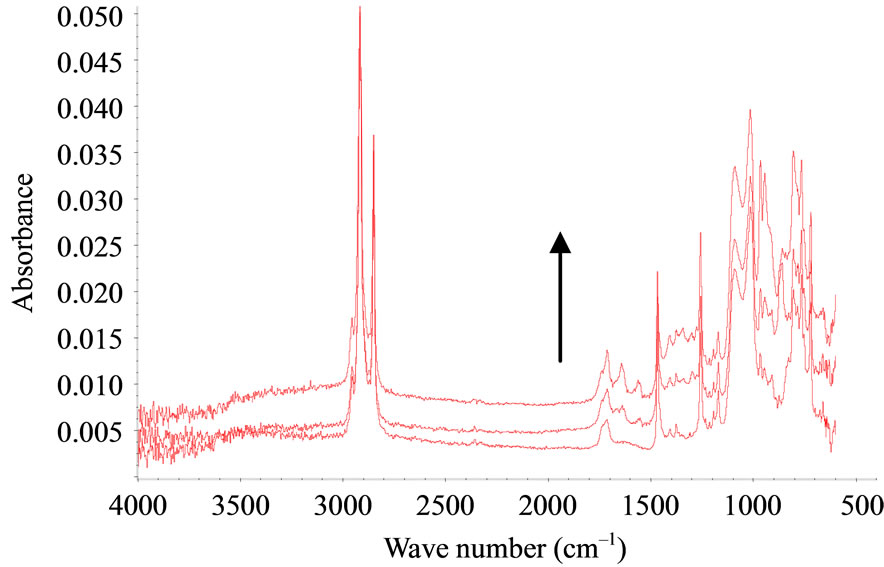
Figure 3. FTIR-ATR spectra upon nitric acid treatment for S6 (PMOS) T = 0; 6 hrs, 18 hrs.

Figure 4. Densimetry results with cyclohexane (0.77858 g/ml) —Comparison of photochemical (SEPAP), thermal ageings (60˚C) and nitric acid treatment for S3.
But no significant decrease of density was observed for S6 and S7 upon irradiation in comparison to other samples. This proves that hydroxy or acetoxy terminated PDMS are quickly cross-linked upon ageing (in absence of curing agent such as peroxide). During the first hours of irradiation a gel fraction is observed, a network has been formed. The chains included in the network gave a gel fraction insoluble in cyclohexane. The density of the soluble part decreased as a consequence. After longer times (20 hours), we can observe a small increase of density, attributed to chain scissions, before reaching a stationary state. With density measurements no difference appears between photochemical and thermal ageings.
3.3. SEC or GPC Results
For all the samples the changes in the molecular weight after various types of ageings were analysed by SEC. All the references showed an increase in molecular weight (weight average molecular weight Mw and number average molecular weight Mn) after photo-ageing and nitric acid vapour exposure after a few hours of exposure. The increase in molecular weight was very rapid and Mw was double after 10 hours (Figure 5). However there was no important change in the molecular weight of soluble part after thermal ageing at 100˚C for 20 to 75 hours. It means that the behaviour of PDMS is different under thermal or photochemical ageing. The increase in molecular weight of soluble parts indicates that photo-ageing and nitric acid vapour exposure lead to the predominance of crosslinking over chain scission. We also observed that the areas of SEC peaks were increased during ageings for the same sample concentration. It means that chain scission mainly operated after 20 hours. Chain scission is favoured upon thermal ageing.
We can also see that the hydroxy and acetoxy terminal groups almost have a similar effect for cross-linking reactions. The changes in molecular weight for S7 and S8 were not significative because of the initial low molecular weight.

Figure 5. GPC results using toluene as solvent—Comparison of changes in molecular weight (Mw) upon various ageing for S2.
This kind of experiments only analyse the soluble fraction (like for densimetry) hence it is possible that a weak part (5% of the initial sample total weight) of the strongly cross-linked material could be left on the filter and hence not analysed. SEC measurements gave more detailed results than density method. For rapid analysis and comparison density was useful to show the cross-linking evolution till 20 hours. SEC was sensitive to changes in chemical structures of all PDMS under photochemical exposure.
3.4. TGA-FTIR Results
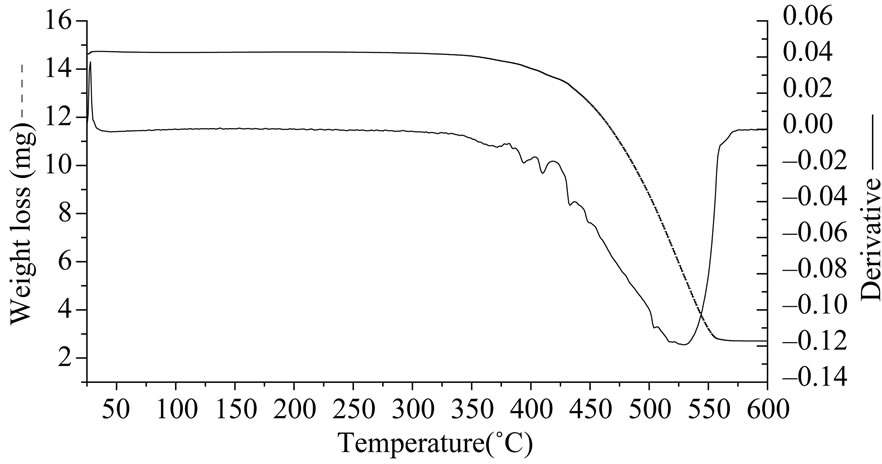
The thermal stability of polysiloxanes has been assessed in oxygen atmosphere. In Table 2 we have summarized the TGA results for all the polysiloxanes. In oxygen atmosphere degradation takes place in two steps (Figure 6(a)). At higher temperatures silicon atom in poly dimethyl siloxane uses its vacant 3d orbitals to form energetically favorable transition states leading to formation of cyclic oligomers and shortening of chains [15]. We observed that the thermal stabilities of samples S1, S2 and S3 were identical as their temperature for onset of degradation and total weight loss were similar. The volatile products emitted during the course of degradation were monitored after every one minute interval using FTIR spectroscopy. Below 340˚C water and carbon dioxide are observed by FTIR while above this temperature oligomers of polysiloxanes passed (four bands between 810 and 1260 cm–1, Figure 6(b)). Oligomers can be linear or cyclic.
The comparison of the 5 PDMS samples was successful. The influence of the initial average molar mass is negligible. The influence of terminal group on the thermal stability was established with the following results. The thermal stabilities of reference S4 and S5 having similar terminations were not identical (Figures 7(a), (b)). Reference S4 having methyldiacetoxy termination gave the highest degradation temperature while reference S5 having acetoxy termination was the weakest PDMS.
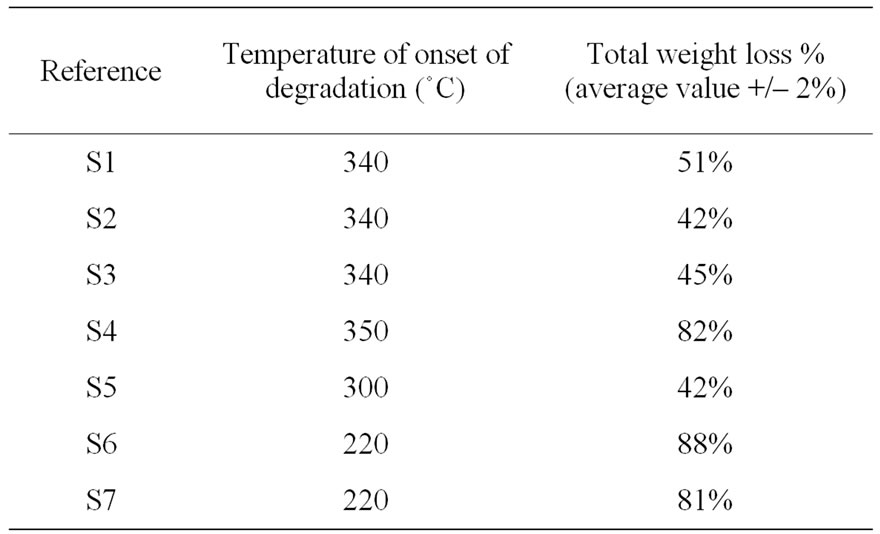
Table 2. Total weight loss after TGA of polysiloxanes (before ageing, under oxygen).
 (a)
(a) (b)
(b)
Figure 6. (a) TGA curves under oxygen for S2 (PDMS hydroxyl terminated); (b) IR spectrum of volatile products after TGA of S2 above 340˚C.
 (a)
(a) (b)
(b)
Figure 7. (a) TGA curve for S4 (PDMS diacetoxy terminated); (b) S5 (PDMS methylacetoxy terminated).
The weight loss for reference S4 was more than S5 indicating that the product formed on its decomposition was thermally unstable. The thermal decomposition of reference S4 takes place in one step while that of S5 takes place in two steps this indicates that the mechanisms of their decompositions are different. Figure 8 gives the IR result after 25 minutes (330˚C).
Formaldehyde (1730, 2900 cm–1) and more carbon dioxide (2340 and 680 cm–1) are detected. The FTIR analysis of volatile products of reference S5 showed acetaldehyde (assigned with the Aldrich Library) as a major product below 330˚C due to which there is a decrease in its thermal stability. Thereafter oligomers of siloxanes were emitted as in other PDMS. In case of reference S4 acetaldehyde is detected and experiments show that the terminal groups have a very important effect on the thermal stabilities of PDMS. Reference S6 and S7 are the thermally weakest poly siloxanes as their decomposition began at 220˚C (Figure 9). This is due to replacement of CH3 group by an alkane chain on the Si atom in the main chain. Reference S6 having a longer alkane chain showed a higher weight loss in presence of oxygen than S7 having a shorter alkane chain. The FTIR spectra of the emitted products of both references S6 and S7 were similar. The IR spectra of S6 show the presence of carbon dioxide, water, siloxane oligomers and hydrocarbons. The thermal stability of polysiloxanes increases when they have a methyl substitution on silicone. Oxygen catalyses the onset of degradation for all the polysiloxanes while a delay in onset temperature of degradation in presence of nitrogen is observed.
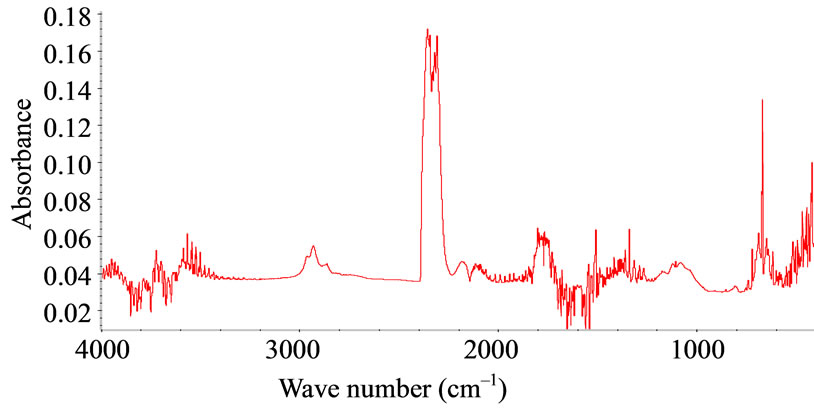
Figure 8. IR spectrum of volatile products after TGA of S5 after 25 minutes.

Figure 9. TGA curve under oxygen for S6.
Complementary TGA experiments under oxygen were carried out after photochemical, thermal ageing at 100˚C or nitric acid treatment. The aged samples of polysiloxanes gave similar curves as initial samples. The temperature of onset of degradation was 325˚C after previous ageing, instead of 340˚C for unaged S2 (see Table 3). There was a decrease (5%) in the weight loss after thermal ageing (100 hours) and 7% after nitric acid exposure (10 hours). Aged samples were more cross-linked, as shown with GPC, hence the decomposition was not favoured.
3.5. DSC and Photo-DSC Results
Crystallinity was estimated for each sample with DSC curves. Figure 10 shows the DSC thermograms obtained for unirradiated S2 and S3. They show an exothermic peak, two endothermic peaks and a glass transition. The glass transition appears around –123˚C for both the samples, thus it does not depend on the molecular weight. However the recrystallisation appears at a slightly lower temperature for S3 (–73˚C) which has lower molecular weight than S2 (–70˚C). This is in agreement with results published earlier [17], the location of the cold crystallization peak (after fast cooling) depends on molecular weight and appears at lower temperature for shorter chains of PDMS. Multiple endothermic peaks are typically exhibited in the measured DSC thermograms of a variety of polymeric materials. Three possible causes of this phenomenon could be given: differences in crystallite size distribution, melting-recrystallization of the original crystallites and their subsequent melting and different crystalline forms of the polymer [15]. In DSC studies of PDMS model networks however, only one crystalline melting peak was observed suggesting that the junction points inhibit the melting-recrystallization of the original crystallites and that is therefore the likely source of the double endothermic peak. This is also consistent with the fact that only one type of crystal structure has been reported for linear PDMS. The crystallinity is measured using the formula:
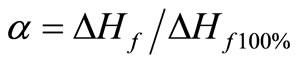
where α is crystallinity, ΔHf is measured melting enthalpy, ΔHf100% is the value for 100 percent crystalline sample (ΔHth = 37.4 J/g).
The crystallinity of S1, S2 and S3, samples with higher molecular weight was between 10% and 20%. S4 and S5 were more crystalline (approx. 50% - 60%). This result is different from other measurements [17], where the ratio of the cold crystallization peak decreases with decreasing molecular weight. Shorter chains have larger mobility and thus they can form more crystals and in large proportion than higher molecular weight PDMS. S6 was amorphous while S7 was semi-crystalline.
The crystallinity ratio could not be determined for S7 because the value of reference enthalpy was not found in litterature. The recrystallisation onset temperature was quite different (12˚C) from other samples, due to the specific chemical structure and the low molecular weight. We used photo-DSC to follow the changes in the peaks of crystallisation of PDMS upon irradiation. All the irradiations were performed at 60˚C, and we used 4 different intensities for it. We also carried out DSC experiments after photo-ageing in SEPAP and thermal exposure in oven for comparison. In figure 11 we have shown the DSC curve of S3. We noticed an increase in the surface area of the recrystallisation peak and its shift towards lower temperature upon irradiation (between –70˚C and –95˚C). We noticed similar phenomena for the recrystallisation peak of S2. The cold crystallisation peak (always observed with S3) decreases gradually with irradiation for 30 minutes and then starts increasing and shifts towards lower temperature. There is no change in the endothermic peak of S2 or S3 after irradiation. The crystallisation temperature is affected by irradiation, this reflects the growth rates and nucleation of the crystallites. The recrystallisation onset temperature for S3 was –74˚C initially, but it changed to it was –102˚C after 180 min of irradiation. The increase of the surface area and the decrease in the temperature of crystallisation peak upon irradiation indicate there is mainly chain scission. The crystallisation behaviour of polydimethylsiloxane depends on the molecular weight and the chemical structure. There is a rapid increase (S1, S2 and S3) or decrease (S4 and S5) in the crystallinity percentage upon irradiation.
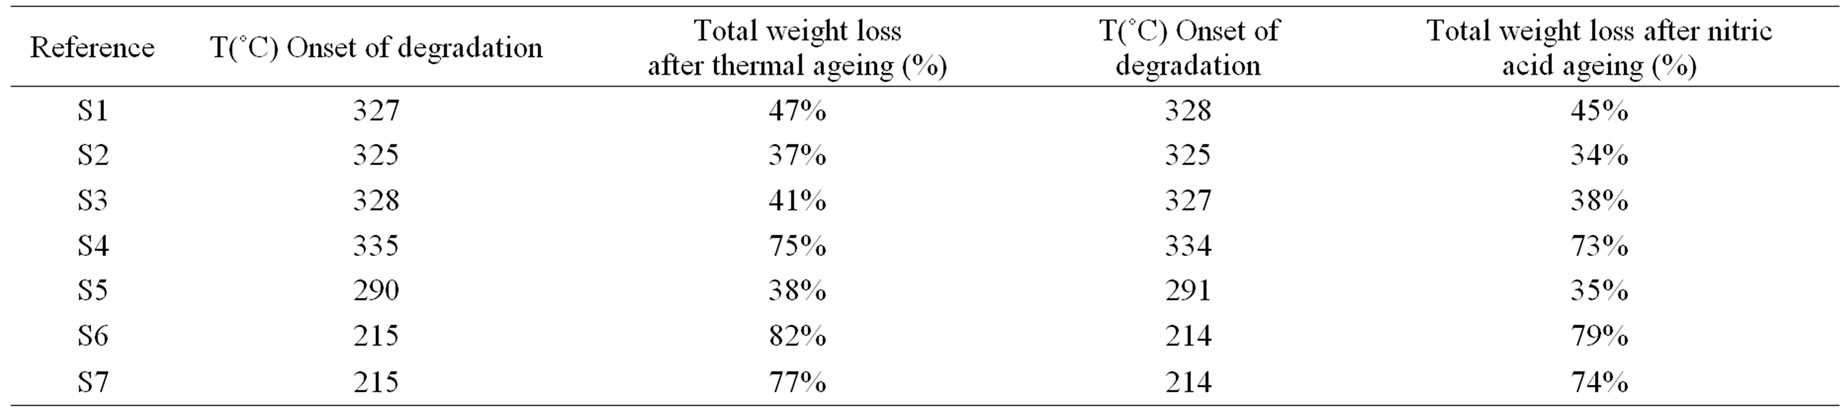
Table 3. Total weight loss by TGA of siloxane thermo-aged at 100˚C (100 hrs) or nitric acid treatment (10 hrs).
The samples S4 and S5 which are 55% crystalline presented a decrease of crystallinity upon ageings due to crosslinking, and the recrystallisation temperature shifted towards lower temperature (from –68˚C to –80˚C at 31 mW/cm2 for S5). S4 and S5 presented an opposite behaviour in terms of crystallinity change upon ageing. Crystallinity yield after 180 min of irradiation was around 15%. Crosslinked chains can not be very active in the formation of crystallites. When the crystallinity increases upon ageing it means that the degradation of polysiloxanes proceeds mainly by chain scission.
In Figure 12 we have compared the changes in crystallisation at different intensities for S3. We have observed that change in crystallinity by thermal ageing is negligible at 60˚C hence all the crystallinity changes are due to the photo-ageing phenomena. There is an acceleration of crystallinity change with increase in the intensity of light in photo-DSC device. The observed evolution

Figure 10. DSC thermograms of intial S2 and S3.
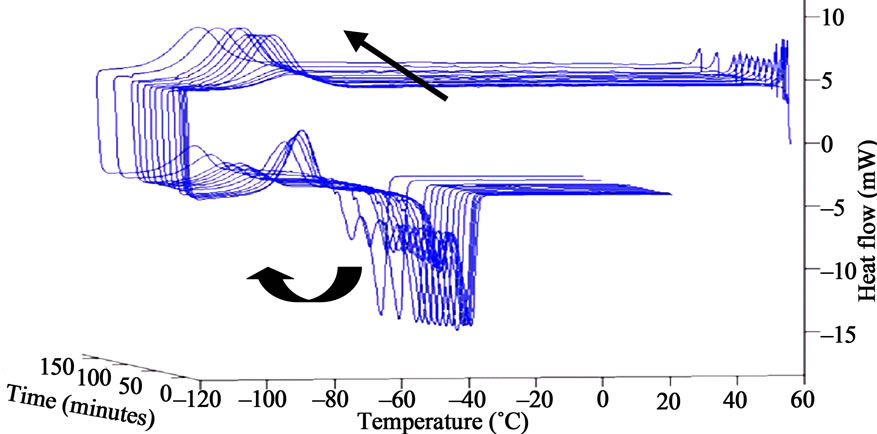
Figure 11. Photo-DSC thermograms after irradiation at 31 mW/cm2 at 60˚C (λ > 300 nm, initial, 30, 60, 90, 120, 150 and 180 min) for S3.

Figure 12. Comparison of changes in crystallinity with different ageings for S3 (irradiation by photo-DSC, SEPAP, thermal ageing at 60˚C.
with the intensity 146 mW/cm2 was drastic compared to irradiation in SEPAP or the other intensities (16 to 76 mW/cm2). Similar results were obtained for S2 and S1 (almost same crystallinity and molecular weight).
4. Discussion
Previous papers [1,4] gave the oxidation evolution (followed by FTIR spectroscopy) for PDMS with a high level of hydride, vinyl, dimethylene or phenyl groups. The characterization of average molecular weight of silicone prepolymer was proposed by Valles et al. [12] or Shah G. B. [18]. The multifunctionality of the prepolymers explained the differences observed between several methods for the determination of average molecular weights [18]. G. Camino et al. [9] showed with TGA the differences between the thermal decomposition under oxygen and under nitrogen. The total weight loss is slower under oxygen atmosphere in the case of PDMS, due to formation of products which are thermally stable at higher temperature. They also gave the influence of the decomposition rate (1, 50 or 100˚C /min). The weight loss shifts to higher temperature both under oxygen or nitrogen, when the decomposition rate is higher. In this paper we use the complementary approach of five analytical tools (FTIR, density, GPC, TGA and DSC) to compare the chemical structures and the physical properties of polysiloxanes. We have summarized main results in Table 4 giving us the structure-property relationships.
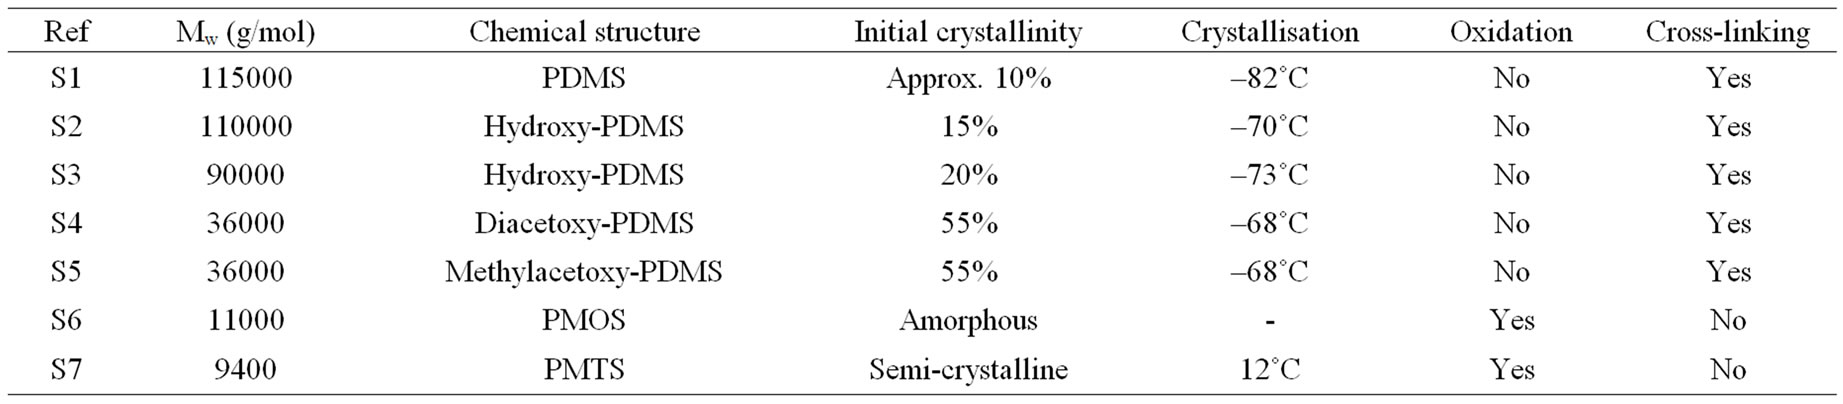
Table 4. Structure-property relationships.
At initial state samples can be divided into 3 groups according to their chemical structures (PDMS, PMOS and PMTS). Properties such as cristallinity, molecular weight are obviously very different. The PDMS samples (S1, S2, S3, S4 and S5) are different because of terminal group, molecular weight and cristallinity ratio. The crystallization behaviour depends on the molecular weight and the chemical structure. Shorter chains have larger mobility and thus can crystallize easily.
After ageing we observed an evolution of chemical structures and physical properties for all samples. The main backbone substitution and terminal groups play an important role in the properties of polysiloxanes. During the first step of degradation till 20 hours with photoageing or acid treatment, hydroxy-PDMS showed a significant increase of both Mw and cristallinity ratio. Then after 20 h Mw decreased and the critallinity ratio was stable. Cross-linking, which is favoured in amorphous part of materials, is predominant at the beginning of photoageing or acid treatment. In the case of thermal ageing at 100°C, during the first hours the increase of Mw is weak, then quite stable. The evolution of cristallinity ratio is slow. Chain scissions were favoured.
S4 and S5 presented a decrease in cristallinity observed with DSC upon ageing. After GPC experiments we can suggest that the increase of Mw can be correlated to a higher cross-linking level for S4 and S5, compared to S1, S2 and S3. The thermal stability of S5 is weaker than for S1, S2, S3 and S4. S4 and S5 have the same initial average molecular weight and the same cristallinity ration. The terminal group is diacetoxy for S4 and methylacetoxy for S5. The influence of the terminal group on the thermal stability is clearly demonstrated.
The presence of carbon chain in the backbone makes it susceptible to oxidation. S6 and S7 had a specific behaviour upon ageing with oxidation reactions. The five PDMS showed only cross-linking and chain scission reactions. The thermal stability of polysiloxanes increases when they have a methyl substitution on silicone compared to higher alkane group. Cross-linking appears preferentially with methyl groups on PDMS (see Scheme 1) after photochemical ageing. Oxidation reaction is the main degradation reaction for S6 and S7 and is also given in Scheme 1.
Different experiments by Nuclear Magnetic Resonance (H and C13) were carried out to analyze the evolution of bridges during ageing, but were unsuccessfull probably because of the very low content of CH2-CH2 bridges.
5. Conclusion
In view of the different analytical results we can conclude that complementary data were obtained. Sensitivity, accuracy and limitation of each method can be shown. With densimetry we showed that cross-linking reactions took place during the first four hours of ageing. With GPC we observed a competition between cross-linking and chain scission. The long term behaviour of PDMS is rather different upon thermal and photochemical ageings after 20 hours. Photo-ageing favoured mainly crosslinking. The observed levels of cross-linking depend on the chemical structure, the ageing and the initial rate of cristallinity. Differences given for S4 and S5 are very significant. The thermal stability of diacetoxy-PDMS S4
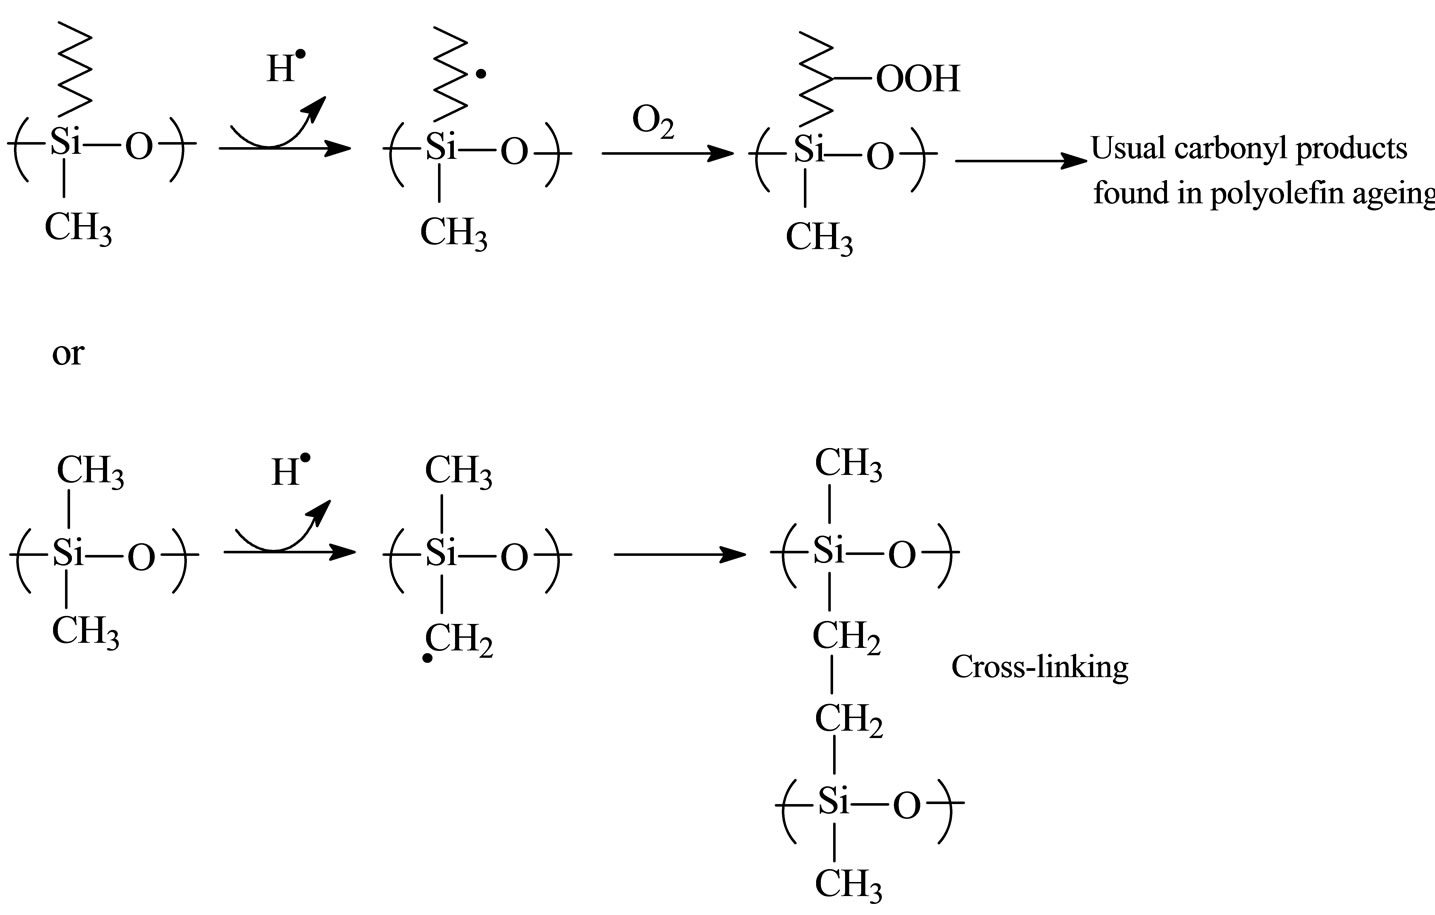
Scheme 1. Mechanism of oxidation and chain scission.
is less than other studied PDMS. The behaviour of S6 and S7 was specific with a high level of oxidation.
REFERENCES
- Y. Israëli, J. L. Philippart, J. Cavezzan, J. Lacoste and J. Lemaire, “Photo-Oxidation of PDMS Oils, Part 1, Effect of Silicone Hydride Groups,” Polymer Degradation and Stability, Vol. 36, No. 2, 1992, pp. 179-185.
- Y. Israëli, J. Cavezzan and J. Lacoste, “Photo-Oxidation of PDMS Oils, Part 2, Effect of Vinyl Groups,” Polymer Degradation and Stability, Vol. 37, No. 3, 1992, pp. 201- 208.
- Y. Israëli, J. Lacoste, J. Cavezzan and J. Lemaire, “Photo-Oxidation of PDMS Oils, Part 3, Effect of Dimethylene Groups,” Polymer Degradation and Stability, Vol. 42, No. 3, 1993, pp. 267-279.
- Y. Israëli, J. Lacoste, J. Cavezzan and J. Lemaire, “Photo-Oxidation of PDMS Oils, Part 4, Effect of Phenyl Groups,” Polymer Degradation and Stability, Vol. 47, No. 3, 1995, pp. 357-362.
- F. Virlogeux, D. Bianchini, F. Delor-Jestin, M. Baba and J. Lacoste, “Evaluation of Cross-Linking after Accelerated Photo-Ageing of Silicone Rubber,” Polymer International, Vol. 53, No. 2, 2004, pp. 163-168. doi:10.1002/pi.1329
- N. Grassie, K. F. Francey and I. G. Macfarlane, “The Thermal Degradation of Polysiloxanes,” Polymer Degra dation and Stability, Vol. 2, No. 1, 1980, pp. 67-83. doi:10.1016/0141-3910(80)90016-6
- G. Deshpande and M. E. Rezac, “The Effects of Phenyl Content on the Degradation of Poly Dimethyl Diphenyl Siloxane Polymers,” Polymer Degradation and Stability, Vol. 74, No. 2, 2001, pp. 363-370. doi:10.1016/S0141-3910(01)00186-0
- G. Deshpande and M. E. Rezac, “Kinetic Aspects of the Thermal Degadation of PDMS and Poly Dimethyl Diphenyl Siloxane,” Polymer Degradation and Stability, Vol. 76, No. 1, 2002, pp. 17-24. doi:10.1016/S0141-3910(01)00261-0
- G. Camino, S. M. Lomakin and M. Lazzari, “PDMS Thermal Degradation Part 1. Kinetic Aspects,” Polymer, Vol. 42, No. 6, 2001, pp. 2395-2402. doi:10.1016/S0032-3861(00)00652-2
- G. Camino, S. M. Lomakin and M. Lazzari, “PDMS Thermal Degradation Part 2 the Degradation Mechanism,” Polymer, Vol. 43, No. 7, 2002, pp. 2011-2015. doi:10.1016/S0032-3861(01)00785-6
- J. T. D. Hill, M. L. Preston, D. J. Salisbury and A. K. Whittaker, “Molecular Weight Changes and Scission and Crosslinking in Poly(Dimethyl Siloxane) on Gamma Radiolysis,” Radiation Physics and Chemistry, Vol. 62, No. 1, 2001, pp. 11-17. doi:10.1016/S0969-806X(01)00416-9
- T. Howard, Thomas and T. C. Kendrick, “Isothermal Depolymerization of PDMS,” Journal of Polymer Science Part A-2, Vol. 7, No. 3, 1969, pp. 537-549.
- E. Valles, C. Sarmoria, M. Villar, M. Lazzari and O. Chiantore, “Model PDMS Subjected to Thermal Weathering: Effect on Molecular Weight Distributions,” Polymer Degradation and Stability, Vol. 69, No. 1, 2000, pp. 67-71. doi:10.1016/S0141-3910(00)00041-0
- M. Morel, J. Lacoste and M. Baba, “Photo-DSC I: A new Tool to Study the Semi-Crystalline Polymer Accelerated Photo-Ageing,” Polymer, Vol. 46, No. 22, 2005, pp. 9275- 9282. doi:10.1016/j.polymer.2005.06.116
- S. J. Clarson and J. A. Semlyen, “Siloxane Polymers,” Prentice Hall, New Jersey, 1993, pp. 216-240.
- F. Delor-Jestin, N. S. Tomer, R. P. Singh and J. Lacoste, “Characterization of PDMS upon Photochemical, Thermal, Salt-Fog Ageings and Exposure to Acid Vapours,” E-Polymers, Vol. 13, No. 13, 2006, pp. 1-13.
- M. I. Aranguren, “Crystallization of PDMS: Effect of Silica and Curing,” Polymer, Vol. 39, No. 20, 1998, pp. 4897-4903. doi:10.1016/S0032-3861(97)10252-X
- G. B. Shah, “Characterisation of Silicone Prepolymers and Disparity in Results,” Express Polymer Letters, Vol. 2, No. 11, 2008, pp. 829-834.
NOTES
*Corresponding author.